


Summary
GPS measurement campaigns in the Mongolia–Baikal area show that: (1) the Baikal rift zone is currently opening at 4–5 mm yr−1 in a NW–SE direction and (2) the western part of the Amurian–north China block is moving eastward relative to Eurasia at 5–7 mm yr−1. These results are consistent with recent geodetic studies in Asia, and indicate that crustal motions in Mongolia and north China derived from geodetic measurements are significantly faster than those proposed by most deformation models of Asia. Using a numerical model, we test whether post-seismic deformation caused by viscoelastic relaxation in the lower crust following the Tsetserleg–Bolnay earthquake sequence (Mw= 7.9 and 8.4, 1905 July) can explain this discrepancy. We find that surface velocities at the GPS sites presented here for the 1997–2000 time period can reach 4 mm yr−1, depending on the earthquake source parameters and the rheology used in the models. Using a model based on our best current knowledge of lithospheric structure and rheology in the Mongolia–Baikal area, we find that the contribution of post-seismic effects to the GPS velocities presented here is less than 2 mm yr−1 for the Mongolian sites and less than 1 mm yr−1 for the Baikal sites. We therefore conclude that the post-seismic effects of the Mw= 8.4, 1905 Bolnay earthquake cannot explain why the GPS-derived crustal motions in Mongolia and the Baikal rift zone are significantly larger than those proposed by deformation models of Asia. This discrepancy must therefore be sought in processes not accounted for in most of these deformation models, such as the far-field contribution of the Pacific subduction zones and/or the effect of gravitational forces on intracontinental deformation.
1 Introduction
Mongolia occupies a peculiar place in Asia, at the transition between a N–S convergent province to the south in the Tien Shan and a NW–SE extensional province to the north in the Baikal rift zone (e.g. Baljinnyam et al. 1993; Cunningham et al. 1996; Schlupp 1996; Bayasgalan 1999; Bayasgalan et al. 1999). Western Mongolia has been the most seismically active intracontinental region in the world in this century (Fig. 1). Four earthquakes of magnitude 8 and greater have occurred since 1905 and ruptured three major fault systems along several hundred kilometres: the Bolnay fault system (1905 July Tsetserleg earthquake, M= 7.9; 1905 July Bolnay earthquake, M= 8.4), the Altai fault system (1931 Fu Yun earthquake, M= 8.0) and the Gobi–Altai fault system (1957 Bogd earthquake, M= 8.1) (Khilko et al. 1985; Baljinnyam et al. 1993). The Bolnay–Tsetserleg earthquake sequence, in particular, has released the largest amount of seismic energy ever observed inside a continent.
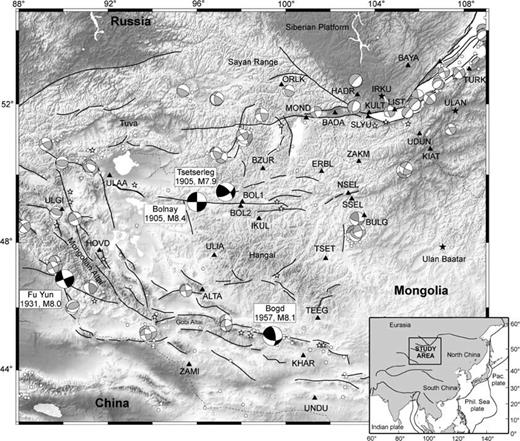
Seismotectonic setting and location of the GPS sites. White circles, recent earthquakes (ISC catalogue); white stars, historical earthquakes (Kilkho et al. 1985; Schlupp 1996). Focal mechanisms, 6 < M < 8 in grey, M > 8 in black (Bayasgalan 1999). Triangles, location of campaign GPS sites; black stars, permanent GPS sites. The topography indicates strong elevation changes from the Siberian craton to the north (∼450 m), to the Hangay dome and Mongolia–Altay belt (∼4500 m).
Geodetic measurements of crustal deformation in the northern part of central Asia are still limited. GPS results in the southern part of the Baikal rift zone show that it is currently opening at a rate of 4.5 ± 1.2 mm yr−1 in a WNW–ESE direction (Calais et al. 1998). In Mongolia, 3 years of continuous GPS measurements (1995–1998) at a permanent site in Ulan Baatar show a velocity of 6.4 ± 1.6 mm yr−1 at N125 ± 30° azimuth with respect to Eurasia (Calais & Amarjargal 2000). These results, together with GPS-derived velocities at other sites in Asia (Heki et al. 1999; Larson et al. 1999; Shen et al. 2000) are significantly faster than the velocity of the Amurian–north China block derived from indirect observations such as fault slip rates or earthquake moment tensors (e.g. Avouac & Tapponnier 1993; Peltzer & Saucier 1996; England & Molnar 1997a).
However, these observations are mostly based on geological strain and fault slip rates averaged over several 100 000 years, and, therefore, may not be compared directly with GPS-derived velocities, usually obtained over less than 10 yr. Geodetically derived crustal velocities may indeed capture transient strain effects that average out over geological timescales (1 Ma and longer). Indeed, post-seismic strain following large earthquakes can influence crustal velocities over a large area several decades or centuries after the event. Post-seismic strain effects have been observed after a number of large earthquakes, such as the M= 8.3, 1906 San Francisco earthquake (Thatcher 1975; Kenner & Segall 2000), the M= 8, 1857 Fort Tejon earthquake (Pollitz & Sacks 1992), the 1964, Mw= 9.2, Great Alaskan earthquake (Savage & Plafker 1991; Freymueller et al. 2000), or the M= 8.2, 1946 Nankaido earthquake (Thatcher 1984).
In this paper, we present new geodetic results of crustal velocities in the Baikal rift zone and the northern part of western Mongolia that confirm faster rates than are obtained by long-term deformation models of Asia. Since the Bolnay and Tsetserleg earthquakes (Mw= 7.9 and 8.4, 1905 July) occurred within 200 km of our GPS network, the related post-seismic effects could affect the geodetic velocities measured a century later. We model the delayed strain effects caused by viscoelastic relaxation in the lower crust using rupture parameters estimated from previous field and seismological studies (Okal 1977; Khilko et al. 1985; Baljinnyam et al. 1993; Schlupp 1996). We then compare these predictions with measured surface velocities in Mongolia and Siberia.
2 GPS data and results
2.1 GPS measurements and data processing
GPS measurements began in 1994 July in the Baikal rift zone and in 1997 August in western Mongolia. The network currently consists of 44 sites (Fig. 1), 16 of which have been surveyed at least three times. The measurements employ Ashtech Z12 GPS receivers, equipped with Geodetic II, Geodetic III and choke-ring antennas. During each campaign, each site is usually surveyed 22–24 h a day for an average of three consecutive days. In addition, we incorporate GPS data from two permanent sites: Irkutsk (IRKT), which has been operating within the framework of the International GPS Service for Geodynamics (IGS) since 1996 October, and Ulan Baatar (ULA1), which has operated continuously since 1995.
We analyse pseudo-range and phase GPS data in single-day solutions using the GAMIT software (King & Bock 2000). We solve for regional station coordinates, satellite state vectors, 13 tropospheric zenith delay parameters per site and day, and phase ambiguities using doubly differenced GPS phase measurements. We use IGS final orbits, IERS earth orientation parameters, and apply azimuth and elevation-dependent antenna phase-centre models, following the tables recommended by the IGS. We include 13 global IGS stations (ONSA, GRAZ, TIDB, FAIR, HART, KOKB, TSKB, USUD, TAIW, KIT3, SHAO, XIAN and IRKT) to serve as ties with the ITRF97 (Boucher et al. 1999). The least-squares adjustment vector and its corresponding variance–covariance matrix for station positions and orbital elements estimated for each independent daily solution are then passed to a Kalman filter (GLOBK, Herring et al. 1990) and combined with global SINEX (solution-independent exchange format) files from the IGS daily processing routinely done at Scripps Institution of Oceanography. We then impose the reference frame using this combined solution by minimizing the position and velocity deviations of IGS core stations with respect to ITRF97 while estimating an orientation, translation and scale transformation. The height coordinates and vertical velocities are weighted by a factor of 10 less than the horizontal components.
2.2 Velocity field
Our results over the 5 yr period 1994–1999 are listed in Table 1 and displayed in Fig. 2. The standard deviations have been computed by scaling the formal 1σ uncertainties of the final adjustment by the overall chi-squared value per degree of freedom. Long-term baseline repeatabilities (weighted rms scatter about the best-fitted linear regression to the position time-series) are 2–4 mm for the horizontal components and 5–12 mm for the vertical component. The velocity field, described hereafter, confirms and consolidates earlier results obtained in the southern part of the Baikal rift zone using a smaller number of sites and a shorter time span (Calais et al. 1998). In addition, velocities are now available at six new sites in the Baikal rift zone and in the northern part of western Mongolia.
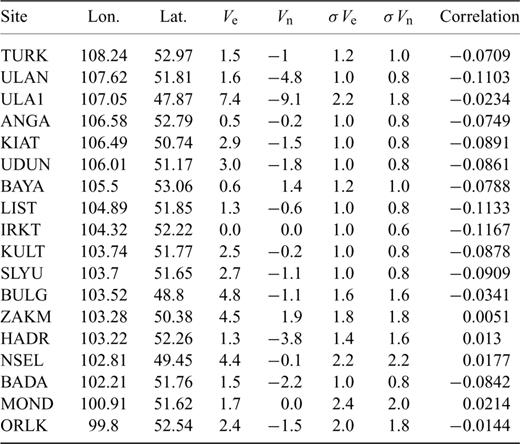
Velocities (Ve, Vn, mm yr–1) with respect to IRKT and associated one standard deviation errors (σVe, σVn, mm yr–1) computed by scaling the 1σ formal uncertainties of the final adjustment by the overall chi-squared per degree of freedom.

GPS-derived velocities (grey arrows with 95 per cent confidence error ellipses). Black arrows show the GPS velocities corrected for the post-seismic displacements, using parameters of the standard model (see explanations in the text).
In the southern Baikal area, the two sites located on the stable Siberian platform (IRKT, BAYA) show no relative motion greater than 1 mm yr−1, consistent with the interpretation that they sit on the same aseismic and undeformed crustal block. The sites located on the southeastern side of lake Baikal (UDUN, KIAT, ULAN) show velocities of 3–5 mm yr−1 in a southeast azimuth relative to the Siberian platform. The five sites located along the major active fault zone that bounds lake Baikal to the northwest and continues westward along the northern side of the Tunka basin (BADA, SLYU, KULT, LIST, ANGA) show intermediate velocities relative to IRKT of 1–3 mm yr−1. In addition, we obtain no significant relative motion (at the 1 mm yr−1 level) between KULT and SLYU, located 10 km from each other on opposite sides of the Sayan–south Baikal active fault. We interpret this pattern as opening of the Baikal rift zone at 4–5 mm yr−1. In the absence of large earthquakes (M > 6) during the geodetic measurements, this time interval essentially involves interseismic deformation. Strain appears to be accumulating elastically, suggesting that the faults mapped as active are currently locked. These results are consistent with earlier findings based on GPS measurements covering the 1994–1997 period only (Calais et al. 1998).
The sites located further south, close to the Russia–Mongolia border (ZAKM) and in Mongolia (NSEL, BULG, ULA1), show velocities of 4–6 mm yr−1 in an east to eastsoutheast azimuth relative to the Siberian platform. These sites are located more than 200 km from the nearest known active fault zones, the Bolnay fault and the Baikal rift, and are therefore unlikely to be affected by significant elastic strain accumulation. Therefore, these GPS sites should reflect the long-term motion of the Amurian–north China block.
2.3 Comparison with other geodetic results in Asia and with deformation models
Our results confirm the discrepancy between GPS-derived crustal velocities and continental deformation models. We show extension at 4–5 mm yr−1 across the Baikal rift zone, and Shen et al. (2000) show extension at a rate of 4 ± 2 mm yr−1 across the Shanxi rift in China, whereas deformation models obtain a significantly slower total rate of extension across these grabens, of between 0 and 1 mm yr−1 (Peltzer & Saucier 1996) and a maximum of 2 mm yr−1 (England & Molnar 1997a). We obtain 5–7 mm yr−1 of east- to southeastward motion at four GPS sites in the northern part of western Mongolia. Similarly, Takahashi et al. (1999), Heki et al. (1999) and Shen et al. (2000) find eastward velocities of 9–10 mm yr−1 relative to Eurasia at GPS sites in north China. Current deformation models of Asia, whether based on indirect observations of crustal motion such as fault slip rates or earthquake moment tensors (e.g. Avouac & Tapponnier 1993; Peltzer & Saucier 1996; England & Molnar 1997a) or on dynamic hypothesis (e.g. Houseman & England 1993; England & Molnar 1997b), give a northeastward motion of the Amurian–north China block relative to Eurasia, and velocities ranging between 0 and 2 mm yr−1 in western Mongolia and north China.
It therefore appears that crustal motions in Mongolia and north China derived from geodetic measurements are significantly faster than those derived from deformation models of Asia. However, GPS-derived velocities obtained over a few years may reflect transient processes, in particular post-seismic strain related to recent large earthquakes (see above). Therefore, in the following, we estimate the effect of post-seismic deformation caused by the Bolnay and Tsetserleg earthquakes (Mw= 8.4 and 7.9, 1905 July) to evaluate whether such processes could explain the relatively high GPS velocities in the Mongolia–Baikal area.
3 Post-seismic Deformation Model
3.1 Modelling approach
Several mechanical processes have been proposed to explain post-seismic strain, such as the downward propagation of aseismic slip along a lower crustal extension of the rupture plane (e.g. Brown et al. 1977), pore pressure re-equilibration (e.g. Peltzer et al. 1996) and viscous relaxation of the ductile lower crust (e.g. Pollitz 1991; Deng et al. 1998). The aim of this study is not to discriminate between these possible mechanisms, since there are no strain measurements available in Mongolia since the 1905 earthquake other than our recent GPS measurements. On the contrary, since we want to determine whether the 1905 Bolnay earthquake may still be influencing crustal motions in Mongolia, we consider the mechanism that maximizes post-seismic strain over long time and space scales. We therefore assume a mechanism of viscous relaxation in the lower crust, which has been suggested to explain long-duration (>5 yr), large-scale (>100 km) transients caused by large earthquakes (e.g. Savage & Svarc 1997; Deng et al. 1998).

We model the post-seismic effects of the Bolnay–Tsetserleg earthquake sequence using the VISCO1D program package (Pollitz 1991). VISCO1D uses a spherically stratified elastic–viscoelastic Earth model and computes the spatial distribution of stresses generated by an earthquake at given time intervals. The stresses are computed in terms of a spherical harmonic expansion of spheroidal and toroidal motion components, each component representing one ‘mode’ of relaxation with its own characteristic decay time and spatial deformation pattern. In this work, we focus on the predicted surface velocities and compare them with the velocities measured by GPS. In such a model, surface deformation is controlled by: (1) the rupture parameters (slip, size and geometry of the rupture plane), (2) the relative thickness of the upper (elastic) crust and the lower (viscoelastic) crust, and (3) the viscosity of the lower crust.
3.2 Rupture parameters
The Bolnay earthquake occurred on 1905 July 23 along the east–west trending segment of the Bolnay fault, in the northern part of western Mongolia (Fig. 3). Geological field data show that the rupture reached the surface, where it was mapped in detail (Khilko et al. 1985; Baljinnyam et al. 1993). It reached a total length of 388 km, with up to 8–11 m of left-lateral surface slip (Fig. 3). Okal (1977), using surface wave modelling based on the few seismological records available at that time, found a seismic moment Mo of 5.5 × 10²¹ N m (Mw= 8.43). Its source parameters were also determined more recently using waveform modelling by Schlupp (1996), who found a seismic moment ranging from 4 × 10²¹ (Mw= 8.3) to 7 × 10²¹ N m (Mw= 8.5). Schlupp (1996) found a best-fitting source depth of 43 km, but suggested that the rupture may have reached a depth of 80 km, therefore breaking the entire crust. The focal mechanisms obtained for the two main subevents show pure left-lateral strike-slip along a vertical, east–west trending plane, corresponding roughly to the observed main surface rupture (Fig. 3).
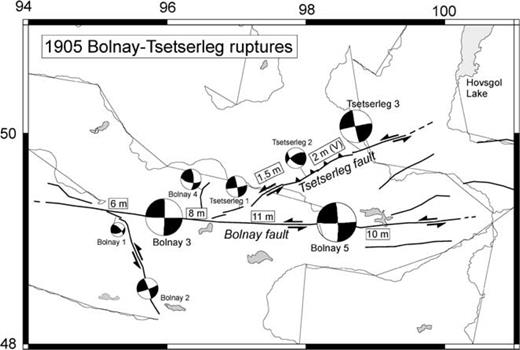
Simplified sketch of the Bolnay–Tsetserleg earthquake sequence. Surface ruptures associated with the two 1905 sequences (bold lines) are from Baljinnyam et al. (1993) and Schlupp (1996). Mean coseismic slip values (in metres) are from Khilko et al. (1985) and Baljinnyam et al. (1993). Each earthquake sequence has been modelled by Schlupp (1996) into several subevents with inverted focal solutions shown near corresponding fault segments. Labels Tsetserleg 1–3 and Bolnay 1–5 denote fault plane solutions of subevents obtained in best-determined rupture models of Schlupp (1996) for the Tsetserleg and Bolnay sequences, respectively. The size of the focal mechanisms is approximately proportional to the seismic moment. The double arrows show the main transcurrent slip motion observed in the field.
The Bolnay earthquake was preceded, 14 days earlier, by the Mw= 7.9 Tsetserleg earthquake (Khilko et al. 1985). The Tsetserleg earthquake ruptured a ∼175 km long NE–SW trending fault, connected at its southwestern termination with the Bolnay fault (Fig. 3, Khilko et al. 1985; Baljinnyam et al. 1993). Field investigations of the rupture zone indicate a purely strike-slip motion along its southwestern half. The northeastern half, although less constrained by field observations, is probably characterized by a combination of strike-slip and reverse motion (Fig. 3). Schlupp (1996) calculated a seismic moment Mo of 1.0 × 10²¹ N m for the Tserserleg earthquake and suggested that some part of the rupture (∼45 km) did not reach the surface.
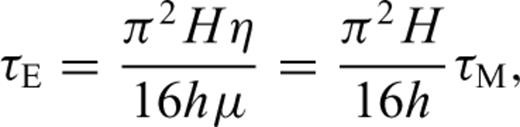
We model the Bolnay earthquake using a Mo= 5.9 × 10²¹ N m moment, averaged from Schlupp (1996) and an east–west trending, left-lateral, vertical, purely strike-slip fault extending over a length of 375 km. We model the Tsetserleg earthquake using a Mo= 1.0 × 10²¹ N m moment and an NE–SW trending, left-lateral, vertical, purely strike-slip fault extending over a length of 150 km horizontally. Neglecting the relatively small changes of geometry and kinematics observed along the Tsetserleg–Bolnay rupture does not alter our conclusions. We are not interested in the details of the post-seismic velocity field in the vicinity of the rupture but rather in the general pattern of far-field effects and their order of magnitude. In both cases, we assume a rupture affecting the entire thickness of the elastic upper crust. For the sake of simplicity, we model the post-seismic effects caused by the Bolnay and Tsetserleg earthquakes as if they occurred simultaneously. We assume the rupture length to be constant (L) and adjust the coseismic slip (U) in order to satisfy the seismic moment (Mo), for the various fault depths tested (W), using the relation Mo=μLWU. We use a rigidity parameter μ= 33 MPa, weighted average of PREM values along the fault depth (Preliminary Reference Earth Model, Dziewonski & Anderson 1981).
3.3 Crustal structure and rheology
Thermobarometric and petrologic analyses of mantle xenoliths in central Mongolia indicate an average crustal thickness of 46 km, with a maximum thickness of 50 ± 3 km beneath the northern Hangai area, just south of the Bolnay earthquake area (Ionov et al. 1998). This result is consistent with wide-angle seismic data that show crustal thicknesses of 45 km on the southern side of lake Baikal, about 500 km to the northeast of the Bolnay rupture but in the same geological block (Khamar–Daban range), and of 48–49 km at about 250 km north of Bolnay (Krylov et al. 1981, 1991). We therefore used a crustal thickness H= 45 km in the models.
Using the earthquake depth distribution from a subset of 632 relocated earthquakes extracted from the instrumental seismicity catalogue (Institute of the Earth Crust, Irkutsk, Russia) covering the Baikal area for the past 30 yr, Déverchère et al. (2001) show that most of the seismicity is concentrated between 10–20 km, and that the crust is seismogenic at depths as great as ∼35–40 km in all areas studied in the Baikol rift zone, including in the areas of thickened crust close to northern Mongolia (thicknesses of ∼45–50 km according to Krylov et al. 1981, 1991; Zorin et al. 1989). Déverchère et al. (1993) and Vertlib (1997) had also shown the occurrence of relatively deep earthquakes (30–40 km) in the northern part of the Baikal rift zone. Finally, Bayasgalan (1999) performed waveform modelling of several recent earthquakes in western Mongolia and found that five out of 29 earthquakes with mb > 5.0 occurred at depths of between 20 and 30 km. These observations therefore indicate a rather thick seismogenic crust in the western Mongolia–Baikal area. This result is consistent with a recent analysis of the earthquake depth distribution in terms of rheological properties of the lithosphere, which indicates a brittle–ductile transition at about 25 km and a seismogenic thickness of 35 ± 5 km (assuming a ∼100 Ma thermal lithosphere), with a quartz rheology in the upper 10 km and a diabase one from 10 to 45 km (Déverchère et al. 2001). In our standard model, we therefore use a h= 30 km thickness for the elastic upper crust. We will, however, test a 16 km thick upper crust (a more common value for intracontinental domains) in order to provide an upper bound for the influence of the brittle–ductile transition on post-seismic strain. Although the viscoelastic response of the upper mantle may also increase the Coulomb stress, and hence, post-seismic deformation (Pollitz et al. 2000; Freed & Lin 2001), we consider here that viscoelastic relaxation of the lower crust is the dominant post-seismic process, since the elastic thickness of the upper mantle in the Mongolia–Baikal area is rather high (∼45 km, Déverchère et al. 2001, and references therein).
In the absence of constraints on the viscosity of the lower crust, we use a value of 3 × 10¹⁸ Pa s in our standard model, typical for continental domains (Ranalli & Murphy 1987; Pollitz 1991; Piersanti 1999). We test the influence of this parameter on the surface velocity field.
3.4 Standard parameters
Our standard model therefore consists of a 45 km crust, with a 30 km thick elastic upper crust and a 15 km thick lower crust with a viscosity of 3 × 10¹⁸ Pa s. Fig. 4 shows the time and space distribution of the surface displacements predicted by this standard model. We find that displacements are concentrated within 75–100 km from the rupture zone for the first 25 yr after the earthquake, before gradually spreading out as far as 300 km away from the rupture zone. The largest post-seismic displacements occur around the rupture zone until about 40 yr after the earthquake. Afterwards, post-seismic motions in the close vicinity of the rupture zone decrease, whereas they remain stronger about 100 km of the rupture zone. Post-seismic displacements become small about 95 yr after the earthquake (less than 6 mm yr−1). During the whole time and space evolution of the post-seismic displacements, the model predicts a four-lobed dipole pattern.
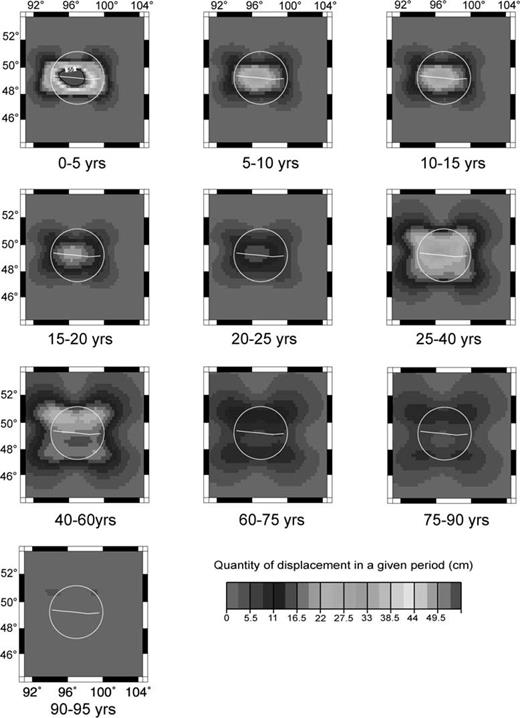
Standard model, time and space distribution of the surface displacements. Years shown are 5 yr time intervals elapsed since the occurrence of the Bolnay sequence. Poroelastic effects are not considered.
Fig. 5 shows the temporal evolution of predicted horizontal post-seismic displacements at the GPS sites in western Mongolia. Note that this figure does not account for poroelastic effects, which have been documented to be significant in the near-field region during relatively short times after large earthquakes (e.g. Peltzer et al. 1998; Pollitz et al. 2000). Poroelastic effects may therefore significantly alter these predictions for sites BOL1, BOL2 and possibly IKUL over the first few years after the earthquake. As expected from eqs (1) and (2), the time distribution of the predicted post-seismic displacements shows that post-seismic motions caused by viscoelastic relaxation are concentrated close to the rupture zone for the first 20–30 yr after the earthquake (sites BOL1, BOL2, BZUR, IKUL). During that time, post-seismic displacements are significantly lower at all the other sites, located further away from the rupture zone. Then, post-seismic displacements become negligible in the close vicinity of the rupture zone (sites BOL1 and BOL2), whereas they continue to increase slowly at the other sites. The model predicts that the maximum total post-seismic displacements occur at BZUR and IKUL (up to 1.7 m in 95 yr), located on each side of the Bolnay fault about 50 and 110 km from it, respectively. The sites least affected by post-seismic displacements (less than 0.1 m in 95 yr) are SSEL, NSEL, BULG (located about 200 km east of the eastern termination of the Bolnay fault) and ZAMI (located about 600 km south of the Bolnay fault).
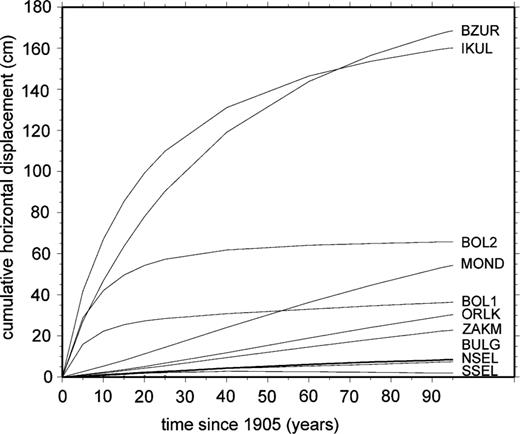
Standard model, temporal evolution of surface displacements at the GPS sites (cumulative horizontal displacements). Poroelastic effects are not considered.
Finally, the post-seismic velocities for the 1997–2000 period are shown in Fig. 6, with respect to the far-field region (background colour coded) and with respect to IRKT (black arrows, for easier comparison with the GPS-derived velocities of Fig. 2). This model predicts that the post-seismic effects of the Bolnay earthquake still contribute up to 6 mm yr−1 in horizontal velocities for the 1997–2000 period. With respect to Irkutsk, the maximum predicted post-seismic velocity for that time period is found at site ULIA (6 mm yr−1), for which we do not yet have a GPS-derived velocity. For sites where we currently have a GPS-derived velocity, predicted post-seismic velocities in the 1997–2000 period reach a maximum of 2.75 mm yr−1 at site MOND, but less than 2 mm yr−1 at all the other sites.
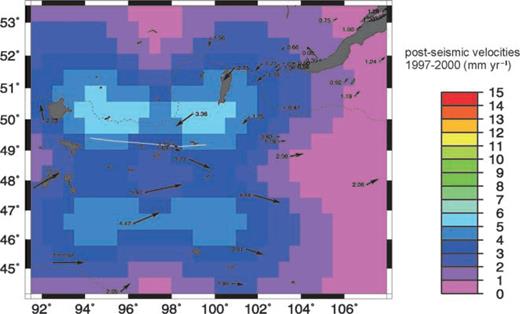
Standard model, post-seismic velocities for the 1997–2000 time period. The colour-coded background shows the post-seismic velocities with respect to the far-field region over the whole of western Mongolia. The black arrows show the post-seismic velocities at our GPS sites with respect to Irkutsk (Siberia).
3.5 Parameter tests
3.5.1 Effect of viscosity
If the viscosity of the lower crust is one order of magnitude larger than in the standard model (3 × 10¹⁹ Pa s, Fig. 7a), we find that post-seismic displacements during the 95 yr that follow the earthquake affect a smaller area, not more than 100 km from the rupture zone. The maximum total post-seismic displacements in that time period reach less than 0.8 m (sites BZUR and IKUL). Post-seismic effects are still occurring 95 yr after the earthquake, although at very slow rates. The maximum post-seismic displacements in the 1997–2000 period occur along the Bolnay fault (up to 8 mm yr−1) and decrease sharply away from it. Predicted GPS velocities with respect to Irkutsk for the 1997–2000 time period reach a maximum of 3–4 mm yr−1 at IKUL and BZUR, but are negligible at all the other sites, in particular at the sites where GPS-derived velocities are currently available (Fig. 2).
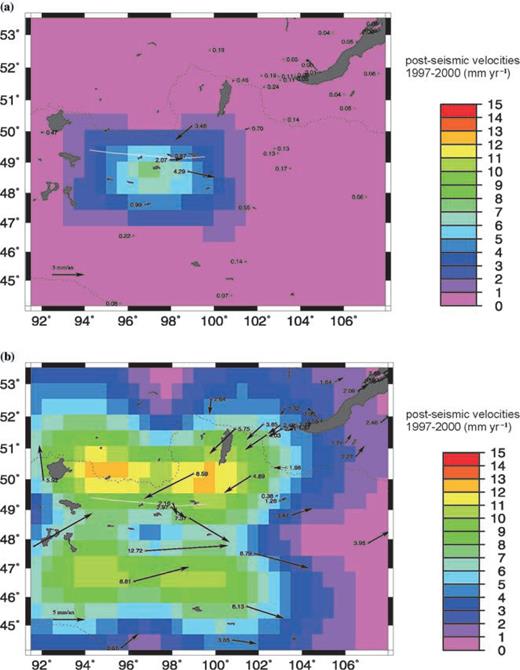
Post-seismic velocities for the 1997–2000 time period: (a) viscosity 3 × 10¹⁹ Pa s; (b) thickness of the elastic upper crust 15 km.
If the viscosity of the lower crust is smaller than in the standard model (3 × 10¹⁶ Pa s, not shown), we find that the post-seismic displacements affect a much larger area, up to about 400 km from the rupture zone. Some 90 per cent of the post-seismic motion is released in the first 10 yr after the earthquake, with maximum cumulative horizontal post-seismic displacements of 4.8 m 95 yr after the earthquake (sites BZUR and IKUL). In this case, we can neglect post-seismic motions in the 1997–2000 time interval because they are less than 1 mm yr−1 at all the GPS sites.
3.5.2 Effect of upper crust (elastic) thickness
If the thickness of the elastic upper crust is reduced to 16 km (Fig. 7b), we find that post-seismic displacements follow the same spatial pattern as in the standard model and affect a similar area. However, they propagate faster outward from the rupture zone with larger amplitudes. The maximum total post-seismic displacements reach 4.0 m after 95 yr at site IKUL. Post-seismic displacements for the 1997–2000 time period are larger about 150–200 km away from the rupture zone than along the rupture zone itself. Post-seismic velocities for the 1997–2000 period are about twice as large as in the standard model and still represent 1–3 mm yr−1 in the southern Baikal rift zone. Relative to Irkutsk, post-seismic velocities for the 1997–2000 period reach up to 13 mm yr−1 at site ULIA and are still significant at the sites where GPS-derived velocities are currently available (Fig. 2), with 3–4 mm yr−1 of post-seismic effects at sites ULA1 and BULG.
The maximum post-seismic contribution of the Bolnay earthquake on the 1997–2000 GPS velocities is obtained if the thickness of the elastic upper crust is reduced to 16 km (with a lower crust viscosity of 3 × 10¹⁸ Pa s), which is unlikely to represent either the base of the seismogenic layer (depth of 99 per cent seismicity cut-off), estimated at about 35 km depth, or the brittle–ductile transition depth, found to be at least 10 km deeper in the neighbouring area of the Baikal rift (Déverchère et al. 2001).
4 Discussion
GPS velocities presented here confirm earlier findings that (1) the Baikal rift zone is currently opening at 4–5 mm yr−1 in a NW–SE direction (Calais et al. 1998), (2) the western part of the Amurian–north China block is moving eastward relative to Eurasia at 5–7 mm yr−1 (Calais & Amarjargal 2000). These results are based on additional GPS measurements epochs and include six new sites in the Baikal rift zone and in the northern part of western Mongolia. They are consistent with recent geodetic studies in Asia (Takahashi et al. 1999; Heki et al. 1999; Shen et al. 2000), indicating that crustal motions in Mongolia and north China derived from geodetic measurements are significantly faster than those derived from indirect observations of large-scale crustal motions, such as fault slip rates or earthquake moment tensors (e.g. Avouac & Tapponnier 1993; Peltzer et al. 1996; England & Molnar 1997a), or from additional dynamic hypothesis (e.g. Houseman & England 1993; England & Molnar 1997b).
We tested above whether post-seismic deformation related to the Bolnay–Tsetserleg earthquake sequence (Mw= 8.4 and 7.9, 1905 July) could explain this discrepancy, at least for the sites located in the Mongolia–Baikal area. Assuming that viscoelastic relaxation in the lower crust is the only mechanism driving post-seismic strain following the Mw= 8.4, 1905, Bolnay earthquake, we find that the post-seismic effects of this earthquake continue through to the present day in most models. Surface velocities at the GPS sites presented in this paper for the 1997–2000 time period can reach 4 mm yr−1, depending on the earthquake source parameters and the rheology assumed in the models. As expected, we find that the thickness of the elastic upper crust controls the spatial pattern and quantities of displacements at the surface, whereas the viscosity controls mainly the temporal evolution of the displacement field (e.g. Pollitz 1991).
In the most plausible model, post-seismic displacements affect an area that extends up to 300 km away from the earthquake rupture zone. The total post-seismic motion reaches a maximum of 1.7 m, about one-fifth of the maximum coseismic motion measured at the surface. Post-seismic effects occur mostly during the first 20–30 yr after the earthquake, but may still contribute up to 7 mm yr−1 to the present-day surface velocities in central Mongolia, more than 95 yr after the earthquake. However, the contribution of post-seismic effects to the GPS velocities presented here is less than 2 mm yr−1 for the Mongolian sites and less than 1 mm yr−1 for the Baikal sites. The black arrows in Fig. 2 show the GPS-derived velocities after removing the post-seismic effect compared with the measured values (grey arrows). The figure shows that accounting for post-seismic effects does not modify the overall pattern of velocities significantly at the sites presented here. The largest difference is found at site MOND, where the velocity becomes larger but is still compatible with the neighbouring sites and the overall velocity pattern. In all cases, the influence of post-seismic effects on the GPS velocities at the sites presented here remains small (less than 4 mm yr−1, Fig. 7) and insufficient to explain the discrepancy with the long-term deformation models.
We also computed the present-day post-seismic velocities caused by the M= 8.1, 1957 Bogd earthquake (Khilko et al. 1985; Baljinnyam et al. 1993) using the standard parameters mentioned above. We found post-seismic surface velocities lower than 1 mm yr−1 at all GPS sites except at TEEG, KHAR and UNDU, where surface velocities are in the 2–4 mm yr−1 range. Finally, we computed the present-day post-seismic velocities caused by the M= 8.0, 1931 Fu Yun and M= 7.1, 1967 Mogod earthquakes (Khilko et al. 1985; Baljinnyam et al. 1993) and found that they are less than 1 mm yr−1 at all our GPS sites.
The post-seismic surface velocities computed here neglect poroelastic rebound, which may induce significant deformation during relatively short times after the earthquake (e.g. Pollitz et al. 1998). In the case of the Mw= 7.3 1992 Landers earthquake in California, Pollitz et al. (2000) show that processes such as fault zone collapse, poroelastic rebound or afterslip have a very limited contribution to the long-wavelength deformation pattern, in particular, a few months after the earthquake. Consequently, although poroelastic effects may have been significant in the near-field during the first months following the Bolnay earthquake, such effects will not modify our conclusions, which are based on the long-term and far-field effects only.
5 Conclusions
Using a numerical model for viscoelastic relaxation in the lower crust, we have found that the post-seismic effects of the Mw= 7.9 and 8.4, 1905, Tsetserleg–Bolnay earthquake sequence cannot explain why the GPS-derived crustal motions in Mongolia and the Baikal rift zone are significantly larger than those obtained by deformation models of Asia. This conclusion remains valid in the range of the lower crust viscosity and brittle–plastic transition depth tested here and assumes a simple rupture geometry for the Bolnay earthquake. The discrepancy between geodetic and modelled velocities in the Mongolia–Baikal area must therefore be sought in processes not accounted for in most of these deformation models, such as the far-field contribution of the Pacific subductions and/or the effect of gravitational forces on intracontinental deformation (Kong & Bird 1996; England & Molnar 1997b; Holt et al. 1995, 2000; Lesne 1999).
The analysis presented here is still preliminary and is limited by the absence of more constraining data on the lithospheric structure and rheology in the Mongolia–Baikal area and on a more accurate geometry of the 1905 ruptures. In particular, the thickness of the elastic upper crust and the viscosity of the lower crust, two key parameters controlling the post-seismic effect in a viscoelastic relaxation model, are still poorly known. A specific effort should be made in the future to better determine these parameters. In addition, a larger number of GPS velocities than presented here, in particular within 100 km of the Bolnay rupture, where post-seismic effects should be the largest, will be available in the near future and allow us to test post-seismic deformation models using the gradients of the velocity field. Finally, recent studies have suggested that stress transfer through viscoelastic relaxation may trigger earthquakes at a distance of several hundred kilometres (e.g. Pollitz 1997; Freed & Lin 2001). Further work should focus on modelling viscoelastic stress transfer following large earthquakes in Mongolia in order to test whether it can explain the clustering of the four M > 8 earthquakes that occurred between 1905 and 1957.
Acknowledgments
We thank F. Pollitz for sharing his viscoelastic code VISCO1D, for his assistance in using the code and for his comments on an earlier version of this paper. We thank all the field operators who participated in the acquisition of the GPS data. We thank Kurt Feigl and an anonymous reviewer for their constructive comments that contributed to significantly improve the paper. This work was funded by the INSU-CNRS (‘Intérieur de la Terre’), INTAS (project 96-2194), NATO Collaborative Linkage Grant ‘Stress transfer and seismic potential, southern Baikal Rift, Siberia’, the Siberian Branch of the Russian Academy of Sciences and the French Ministry for Foreign Affairs through the French Embassy in Mongolia. Contribution Géosciences Azur no 389.
References
Author notes
Now at: Department of Earth and Atmospheric Sciences, Purdue University, West Lafayette, IN 47907-1397, USA. E-mail: [email protected]
