-
PDF
- Split View
-
Views
-
Cite
Cite
Francisco J. Sánchez‐Sesma, Raul Madariaga, Kojiro Irikura, An approximate elastic two‐dimensional Green’s function for a constant‐gradient medium, Geophysical Journal International, Volume 146, Issue 1, July 2001, Pages 237–248, https://doi.org/10.1046/j.0956-540x.2001.01447.x
Close - Share Icon Share
Summary
Approximate analytical formulae for elastic 2‐D Green's functions for a constant‐gradient propagation velocity medium are presented. These solutions correspond to unit line forces per unit length: the antiplane SH line source and the in‐plane P–SV line sources, respectively. They are based on the asymptotic ray theory and account for both near‐source effects and low frequencies. The analytical expressions obtained are tested by means of the pseudospectral method with a velocity–stress staggered grid. The agreement of the approximate analytical displacement and stress fields with their numerical counterparts is generally very good. A measure of relative error is proposed.
Introduction
Local geological conditions may induce significant amplification of ground motion during earthquakes. The quantitative assessment of such effects can be made with numerical modelling (see Luco & De Barros 1995 and Sánchez‐Sesma 1996 for recent reviews). In many instances, local amplification of strong ground motion can be inferred reasonably assuming homogeneity of the materials in horizontally stratified layers. It is also common to assume homogeneous materials for strata with lateral irregularities in geometry. In many cases there is a need to consider the inhomogeneity of materials in order to obtain reliable results (e.g. Vrettos 1991).
The most realistic simulations to date are those of finite differences. The simulations by Olsen . (1995) on the response of the Los Angeles Basin, California, to a nearby M = 7.75 earthquake on the San Andreas fault, and near‐source studies for the Hyogo‐ken Nambu (Kobe), Japan, earthquake illustrate the power of finite differences well (see also Yomogida & Etgen 1993; Frankel & Vidale 1992; Frankel 1993; Graves 1995; Pitarka & Irikura 1996; Olsen & Archuleta 1996; Pitarka . 1998 ). Finite differences combined with the fast Fourier transform algorithm to compute the spatial derivatives gives rise to the pseudospectral method (for recent, large‐scale applications to realistic problems see Furumura & Kennett 1998). The other major domain approach is the finite element method, which has being applied with success to model the seismic response of large‐scale 3‐D alluvial valleys ( Bielak . 1998 ).
On the other hand, the boundary element methods (BEM) have gained increasing popularity. Significant advantages over domain approaches are the reduction of dimensionality, the relatively easy fulfilment of radiation conditions at infinity and the high accuracy of results. Excellent reviews of the available literature on BEM in elastodynamics are those by Manolis & Beskos (1988) and Brebbia & Domı´nguez (1992). Besides these reviews, it is worth mentioning the contributions of Kawase (1988), Kawase & Aki (1989), Kim & Papageorgiou (1993) and Pei & Papageorgiou (1996). These authors applied the direct BEM using the Green's function computed with the discrete wavenumber method to study 2‐D and 3‐D configurations. Another useful approach is that of the indirect boundary element method (IBEM), in which the problem is formulated in terms of force densities at the boundaries (e.g. Gaffet & Bouchon 1989; Sánchez‐Sesma & Campillo 1991; Sánchez‐Sesma . 1993 ; Pedersen . 1994 ; Sánchez‐Sesma & Luzón 1995; Yokoi & Takenaka 1995; Yokoi & Sánchez‐Sesma 1998; Pointer . 1998 ).
One severe limitation of BEM approaches is the availability of the Green's function, which can be easily obtained only for a homogeneous unbounded medium. For layered media several methods are available to compute the Green's functions (e.g. Hisada . 1993 ; Fujiwara & Takenaka 1994), but the computational burden can make the BEM approach impractical or expensive. It is clear to us that the possibilities of both finite differences and finite elements to model complex configurations are not yet available in a BEM formulation. However, there is a wide class of problems for which the information on geometry and properties has large uncertainties. Even in these cases it is reasonable to assume an increase of wave propagation velocities with depth (e.g. Vrettos 1990, 1991). In such circumstances, a fully fledged finite difference analysis may be quite expensive as compared to a simple BEM study. This is the motivation for the present work.
In this paper we present approximate analytical formulae for elastic 2‐D Green's functions for an inhomogeneous medium where the velocity increases linearly with depth. These formulae correspond to line unit forces per unit length; the antiplane (SH) horizontal line load and the in‐plane (P–SV) horizontal and vertical line forces, respectively. The body wave expressions are obtained from asymptotic ray theory and account for both near‐source effects and low frequencies. They are validated by means of the pseudospectral method with a velocity–stress staggered grid. Excellent agreement is found in both displacement and stress fields.
Analytical formulae
In order to present our analytical scheme, we will discuss first the simplest case regarding the scalar SH (antiplane) problem of a line force. With this case we introduce all the details of our approach. Then, the solution for the vector P–SV (in‐plane) cases is presented in a more compact way. All the derivations are performed in the frequency domain but, due to the simplicity of the results, they can readily be expressed in the time domain. To validate our approach, we compare numerical results in the time domain (for both displacement and stress fields) with those obtained using the pseudospectral formulation.
Antiplane case
The simplest model of wave propagation velocity for an inhomogeneous medium is the constant‐gradient one, in which it is assumed that velocity increases linearly with depth. The scalar wave equation in three dimensions allows for an exact solution ( Pekeris 1946). However, neither the 2‐D scalar wave equation nor the elastic wave equations (in two and three dimensions) are separable. To the best of authors' knowledge, there are no analytical expressions for elastic Green's functions under this condition (e.g. Hook 1962; Ben‐Menahem & Beydoun 1985).
A constant‐gradient medium has the interesting property that both wave fronts and rays in 2‐D wave propagation are circular ( Ben‐Menahem & Singh 1981), and ray theory is appropriate to represent analytically high‐frequency wavefields. A natural reference system to represent these rays and wave fronts is the bipolar one (e.g. Lebedev 1972; Timoshenko & Goodier 1970). The orthogonal bipolar coordinates are depicted in Fig. 1. Following Beydoun & Ben‐Menahem (1985) we summarize here the properties of both rays and wave fronts.
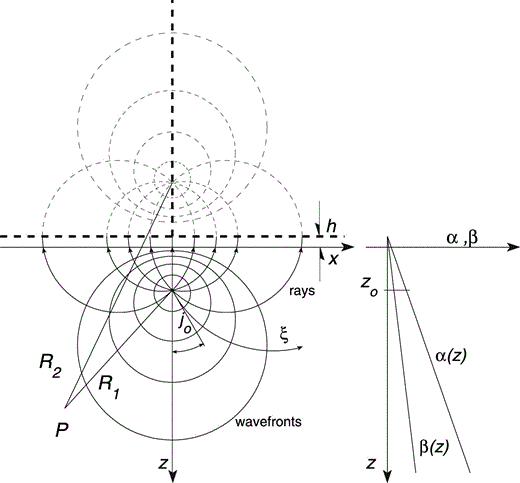
Schematic illustration of the bipolar coordinate system. Both rays and wave fronts are circular. Rays depend upon take‐off angle j0. Wave fronts depend on traveltime τ = ξt0, where t0 = h/β(0) and ξ is one of the bipolar coordinates (the other is j0). The distances R1 and R2 from the poles to point P are displayed. The plane for which z = − h corresponds to null propagation velocities.
Assume a medium with velocity and density given by

and

respectively. Here z0 = depth of source, β0 = shear wave velocity at the source level z = z0, β(0) = shear wave velocity at z = 0, ρ0 = mass density at the source level, ρ(0) = mass density at z = 0, γ = 1/h, h = distance from depth z = 0 to the level where the propagation velocity is null (z = − h), and additionally n ≥ 0, so that density may be constant or increase with depth. It can be shown that in a medium like this, with the source located at x0 = 0 and z0 > − h, the wave fronts and rays correspond to the expressions

and

respectively. In these equations,  ,
,  , j0 = sin−1[2x(z0 + h)/R1R2] = take‐off angle, R = radius of the ray with take‐off angle j0 and Rw = (z0 + h) sinh(γβ(0)τ) = R1R2/2(z + h) is the radius of the wave front either for a known traveltime τ or at a given point ( Ben‐Menahem & Beydoun 1985). The traveltime τ can be computed by means of

where t0 = h/β(0) = 1/γβ(0). The traveltime has a clear and simple dependence on the velocity model and the relative positions of source and receiver, and is proportional to the bipolar coordinate ξ. Note that ξ (or traveltime) controls both the radii and the centre locations of the circular wave fronts, whereas the take‐off angle j0 (the other bipolar coordinate) gives the ray characteristics. Eq. (5) holds everywhere for z > − h, even where the rays have turning points.
Approximate formulation
In Aki & Richards (1980) the ray theory for far‐field elastic waves from a point source is presented and general expressions are given for the so‐called geometrical ray solutions for P, SV and SH waves in a radially symmetric earth. These solutions also hold for vertically inhomogeneous media. For instance, in the frequency domain, the ray theory expression for the SH component (adapted from Aki & Richards 1980 and Pšenčı´k & Teles 1996) may be written as

where ρ(x) = mass density, β(x) = S‐wave velocity, x = receiver position vector, xr = reference position along the ray, ξ = source position, ℛℯS(x, ξ) = geometrical spreading, ℵSH(p, φ) = radiation pattern for SH waves, p = ray parameter, φ = solid angle, Ω = circular frequency,  , τ = traveltime and t = time. Both the geometrical spreading and the radiation pattern can be obtained from the ray theory formalism (see Červený & Pšenčı´k 1979; Aki & Richards 1980; Pšenčı´k & Teles 1996). However, a detailed derivation of equivalent formulae for line sources is beyond the scope of this work. Instead, we start our 2‐D approximation in a simple way including heuristically some concepts that are well known for homogeneous media. Moreover, in our proposal we use properties of wave propagation in constant‐gradient media.
Consider first the exact displacement field radiated by a unit line force in the y‐direction in a homogeneous elastic medium, which is given by

where Gyy is the 2‐D Green's function, that is, the displacement in the y‐direction for a unit line load (per unit length) in the y‐direction at a point at distance r from the line load, μ is the shear modulus (one of Lamé's constants), H0(1)(·) is Hankel's function of the first kind and zero order with argument Ωr/β = Ωτ (see e.g. Abramowitz & Stegun 1972) and τ is the traveltime. Neumann's asymptotic form of Hankel's function for large Ωr/β can be written as

From eqs (7) and (8) it is clear that wave fronts of the exact solution are circular with radius r and that the geometrical spreading is proportional to  . As the wave fronts in a constant‐gradient medium are also circular with radius Rw, we assume that the geometrical spreading is proportional to
  . Additionally, as in the homogeneous case, the radiation pattern is assumed to be unity.
Considering the above remarks, introducing the relative impedance term ρ(z0)β(z0)/ρ(z)β(z), which includes a normalization similar to the one used in eq. (6), and assuming a constant‐reference geometrical spreading for all rays, we propose an approximation for the constant‐gradient medium of the form

which can be regarded as a generalization of the far‐source approximation of the 2‐D Green's function for a homogeneous medium. In eq. (9a) the reference position was implicitly assumed to be the source. Here and hereafter the explicit time dependence exp−(iΩt) is omitted. This equation can be rewritten as

An approximation for the Green's function should at least be consistent with the asymptotic ray theory for large frequencies and traveltimes (large distances from the source). Therefore, in order to fulfil this asymptotic constraint and, at the same time, include near‐source propagation effects, we reinsert in eq. (9b) the Hankel function, with argument Ωτ. To take into consideration the medium inhomogeneity we keep the necessary modulating factors. The constant C accounts for the behaviour in the neighbourhood of the line source. Considering also eqs (1) and (2) and the expression for Rw, we obtain the approximate expression

for the 2‐D Green's function in the constant‐gradient medium studied here. The matching of our analytical ray‐based expression with an exact, radiating solution at the line source is similar to the matching used by Pšenčı´k & Teles (1996) for a point source. Here μ0 is the shear modulus at the source level. Our ansatz can be expressed compactly as

Using eq. (5) we can rewrite the first factor Λ in eqs (10) and (11) by means of

One may verify that this expression tends to unity when γ → 0 (or h → ∞). Thus

with  , the known behaviour for the homogeneous case. Green's function is the displacement in the y‐direction at x, z due to the application of a harmonic unit line load (per unit length) in the y‐direction at x = 0, z = z0.
In eq. (11) the frequency appears only in the argument of the Hankel function. It is straightforward to write the time‐domain equivalent as factor Λ depends only on the medium properties and location. Therefore, it is possible to write

where H(t − τ) is the Heaviside step function (equal to zero for t < τ and equal to 1 for t > τ). For the homogeneous case (1/h = γ = 0), Λ = 1, μ0 = μ and τ = r/β, and then we have the well‐known expression for a homogeneous medium (e.g. Achenbach 1973).
In‐plane case
The formulation of the in‐plane vector case of the Green's function for line loads is similar to that of the scalar counterpart. The main ideas parallel those of the scalar case. Suffice it to say that the starting equations are those for a line load at the origin of coordinates in a homogeneous isotropic elastic space. The displacements in standard polar coordinates r and θ (i.e. x = r cos θ and z = r sin θ) due to a harmonic line load F in the θ = 0 direction are given by

and

where

and

Here Hm(1)(·) is the Hankel function of the first kind and order m. Similar expressions are given in Sánchez‐Sesma & Campillo (1991). Eqs (14) and (15) show the radial and angular dependences in A and B and in cos θ and sin θ, respectively.
In order to illustrate the solution in the time domain, consider the equivalent of eqs (14) and (15) for an impulsive force Fδ(t) in a homogeneous medium,
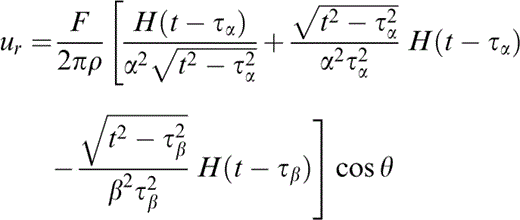
and
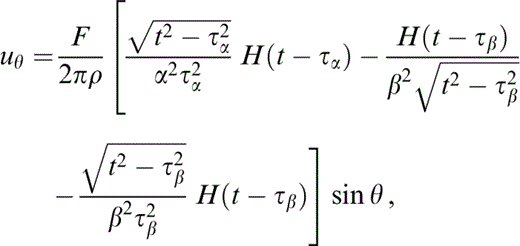
respectively, where τc = r/c is the traveltime of a wave with propagation velocity c. Eqs (18) and (19) are from Eason . (1956) .
To derive the approximate vector Green's function let us return to the frequency domain and explain the basic idea. In the homogeneous case, the equations for a line force arise naturally in polar coordinates. For the inhomogeneous medium under study the ‘natural’ system of reference is the bipolar one (e.g. Lebedev 1972; Timoshenko & Goodier 1970). In such a system, the analogous quantities to radius r and angle θ are traveltime τ and take‐off angle j0, respectively, as depicted in Fig. 1. The ‘radial’ and ‘angular’ components of displacement should refer to the radius Rw and to the local tangent to the wave front, respectively. This heuristic proposal is the natural extension of the scalar case discussed above (the radiation patterns at the source are also retained in the solution) and implies that ‘longitudinal’ and ‘transverse’ components along each ray are given by expressions analogous to eqs (14) and (15) or eqs (18) and (19) for the frequency and time domains, respectively. Such expressions should be corrected by the factor Λ presented above. Under the assumptions of unit line force in the z‐direction and a constant ratio of P‐ to S‐wave velocities (constant Poisson modulus), the factor Λ is the same for both P and S waves. Thus, the ‘radial’ and ‘transverse’ components of the Green's function can be written as

and

respectively. Here

and

To obtain the expressions for GRwx and Gj0x, which are the ‘radial’ and ‘transverse’ components of motion for a horizontal line force, it suffices to change cos j0 and sin j0 in eqs (20) and (21) to sin j0 and − cos j0, respectively. These Green's function components have indexes that belong to different coordinate systems. The expressions for Gij(x, z; x0, z0) can be easily obtained by local projection onto the global coordinates x, z,


where nx = (x − x0)/Rw and nz = {z − z0 − h[cosh(γβ(0)τ) − 1]}/Rw, as can be seen from eqs (2) and (3).
Testing of the approximate analytical green's functions
In order to show the validity of our approximate analytical formulae we compare the displacement and stress fields at selected receivers for a given inhomogeneous medium, with the corresponding results from a velocity–stress, staggered‐grid pseudospectral method. In this numerical technique the spatial derivatives are computed using the fast Fourier transform (FFT) algorithm and the time variations are approximated with a first‐order differencing scheme.
The comparisons are made in the time domain with eqs (18) and (19) for the P–SV case. Such equations are appropriately corrected for inhomogeneity and transformed according to eqs (24) and (27). The stresses are computed for each receiver and the derivatives are obtained using a centred scheme. From the expressions in the time domain, we obtained analytically the solution for a symmetrical triangular load in time. The same loading was used in the numerical scheme.
The pseudospectral scheme is validated by means of our analytical solution, which for a homogeneous medium coincides with the exact solution. In fact, we computed vertical and horizontal displacements and stresses in a homogeneous medium with α = 3, β = 1.5 and ρ = 1 due to a horizontal force located at z0 = 11.4 and x0 = 0. Fig. 2(a) shows the constant velocities. Here and hereafter distances and time are given in kilometres and seconds, respectively. The mass density has arbitrary but consistent units. Note that u ≡ Gxx and w ≡ Gzx because the applied unit force is horizontal. The positions of receivers are depicted in Figs 2(b) and (c). The rays and the wave fronts for given traveltimes (multiples of 1.5) are shown for both P and S waves in Figs 2(b) and (c), respectively. The results for displacements and stresses are shown in Figs 3 and 4, respectively. In these two figures our analytical solution is displayed with solid lines. The dotted lines show the pseudospectral results. The source time function duration is 0.4. We find that the agreement for displacements is excellent. For stresses the agreement is also very good, even for this sharp source time function.
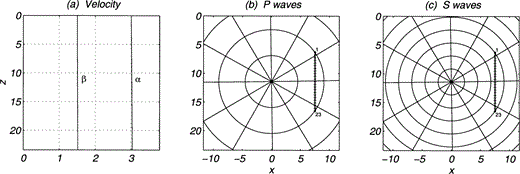
Homogeneous isotropic elastic medium with ρ = 1, α = 3 and β = 1.5. (a) Variation of wave velocities with depth. (b) , (c) Rays and wave fronts for traveltime multiples of 1.5 for P and S waves, respectively. In (b) and (c) the positions of the 23 receivers are marked with diamonds.
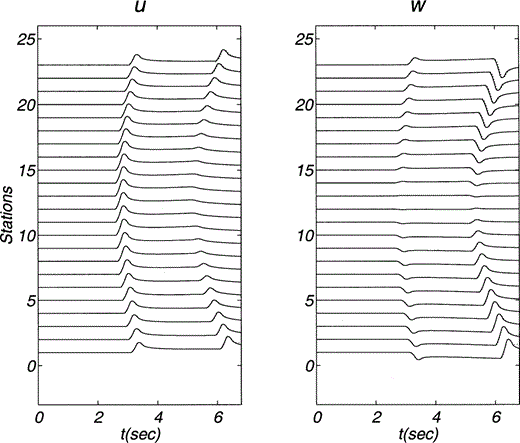
Horizontal (u) and vertical (w) displacements due to a horizontal line load within a homogeneous medium. Material properties and positions of source and receivers are described in Fig. 2. The source time function duration is 0.4. In this limiting case the analytical solution becomes the exact one. The exact solution is represented with solid lines while the numerical solution is shown with dotted lines.
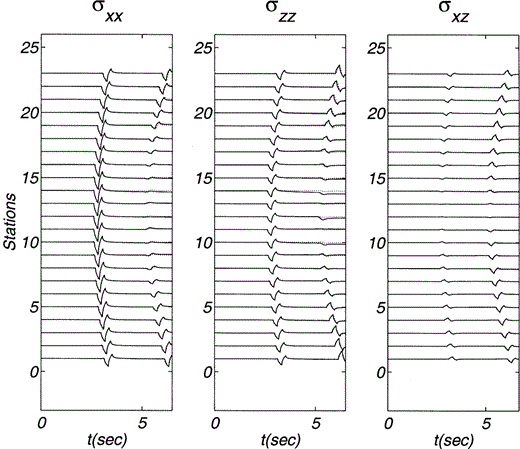
Stress components σxx, σzz and σxz due to a horizontal line load within a homogeneous medium. Material properties and positions of both source and receivers are described in Fig. 2. The source time function duration is 0.4. The stresses computed from the exact displacements are represented with solid lines while the numerical results are shown with dotted lines.
We now use the numerical method to validate our approximate analytical solution for an inhomogeneous case. To this end, we assume a medium with constant density ρ = 1 (n = 0) and velocities α = 1 and β = 0.5 for z = 0 and α = 3.2 and β = 1.6 at source level, which is located at z0 = 11.4. The vertical variation of wave velocities is displayed in Fig. 5(a). The receivers were placed on two vertical lines (A and B) at various depths; their offset depends on the staggered grid size positions. They are depicted in Figs 5(b) and (c). Again, the rays and the wave fronts for given traveltimes (multiples of 1.5) are computed. They are shown for both P and S waves in Fig. 5(b) and (c), respectively.
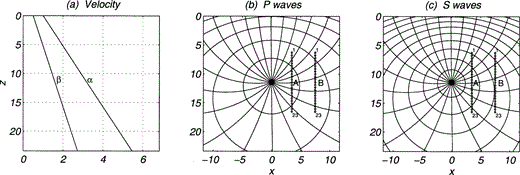
Inhomogeneous medium with constant density ρ = 1 (n = 0). Velocities α = 1 and β = 0.5 for z = 0, and α = 3.2 and β = 1.6 at z0 = 11.4, the source level. (a) Variation of wave velocities with depth. (b) , (c) Rays and wave fronts for traveltime multiples of 1.5 for P and S waves, respectively. In (b) and (c) the positions of the 23 receivers (sets A and B) are marked with diamonds.
The source time function is again a symmetric triangular pulse with a duration of 0.4. Figs 6 and 7 depict horizontal and vertical displacements due to a vertical force for the two lines of receivers at x = 3.0 and x = 7.5, respectively. Stress components are shown in Figs 8 and 9. The approximate analytical solution is represented with solid traces while the numerical results are shown using dotted lines. The agreement is very good in both displacements and stresses, except for a range between the arrivals of P and S waves in the horizontal component for which some small differences in the displacement amplitudes arise.
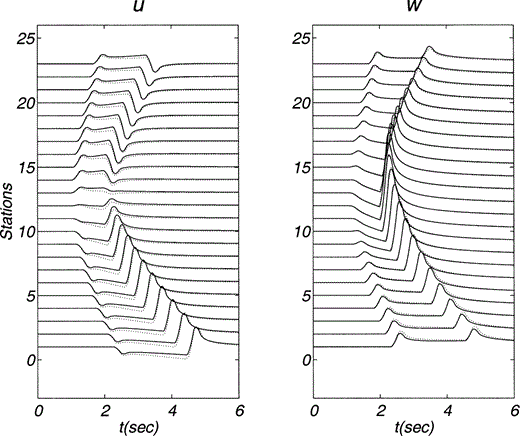
Horizontal (u) and vertical (w) displacements due to a vertical line force within an inhomogeneous medium. Material properties and positions of both source and receivers are described in Fig. 5. The source time function duration is 0.4. The positions of receivers (set A) are also depicted in Fig. 5. The source time function duration is 0.4. Our approximate solution is represented by solid lines while the numerical solution is shown using dotted lines.
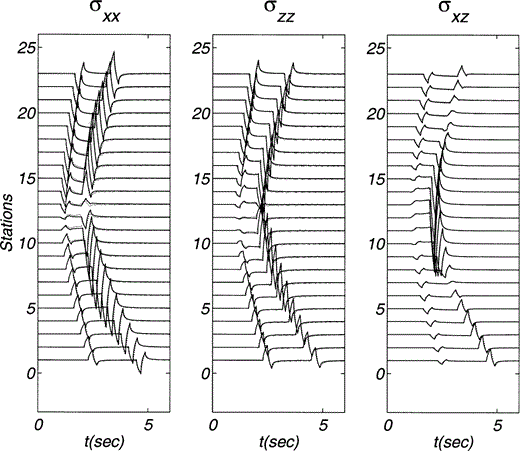
Stress components σxx, σzz and σxz due to a vertical line load within an inhomogeneous medium. Material properties and positions of both source and receivers (set A) are described in Fig. 5. The source time function duration is 0.4. The stresses computed from the analytical displacements are represented with solid lines while the numerical results are shown with dotted lines.
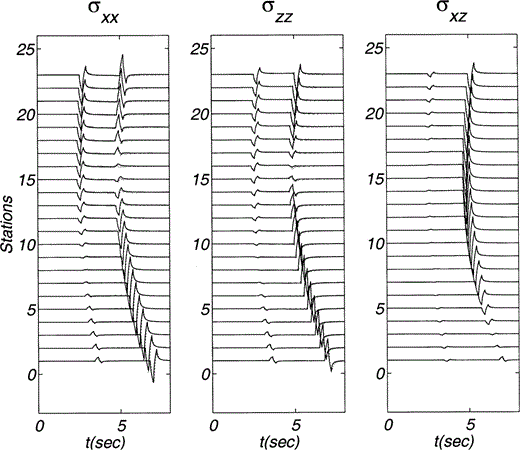
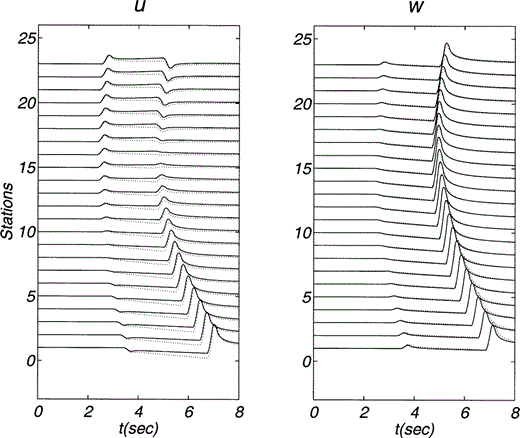
The third example ( Fig. 10) considers the same gradient and load direction as in the preceding one. The variations of velocities with depth are given in Fig. 10(a). There are now 18 receivers and they are far from the source (x = 21). Figs 10(b) and (c) show rays and wave fronts for P and S waves, respectively. Note that the set of rays depicted is the same for both cases. The wave fronts reveal the differences in the velocities of the two waves. Finally, Figs 11 and 12 show displacements and stresses, respectively. The analytical solution is represented with solid traces while the numerical results are shown by dotted lines. The agreement is very good for both displacements and stresses. The pseudospectral traces show some oscillations that can be eliminated using a finer grid. Fortunately, these oscillations do not affect the amplitudes of the main arrivals and are of no relevance here. As in Figs 6 and 7, small differences in the displacement amplitudes arise between the arrivals of P and S waves. They are probably due to the neglect of dispersion in our analytical solution. The main effects of inhomogeneity are clearly seen in both traveltimes and amplitudes.
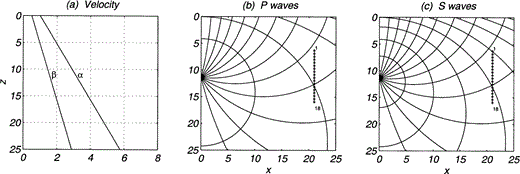
Inhomogeneous medium with constant density ρ = 1 (n = 0). Velocities α = 1 and β = 0.5 for z = 0, and α = 3.2 and β = 1.6 at z0 = 11.4, the source level. (a) Variation of wave velocities with depth. (b) , (c) Rays and wave fronts for traveltime multiples of 3.0 for P and S waves, respectively. In (b) and (c) the positions of the 18 receivers are marked with diamonds.
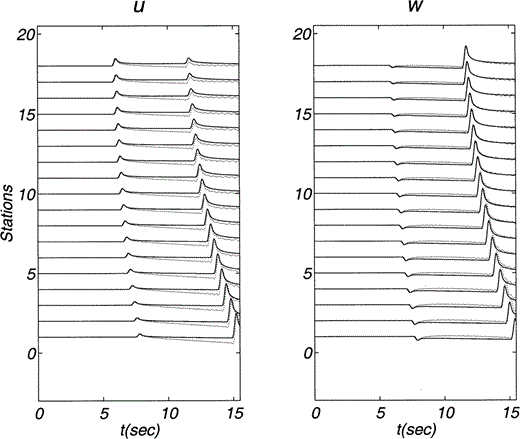
Horizontal (u) and vertical (w) displacements due to a vertical line force within an inhomogeneous medium computed with the approximate analytical solution. Material properties and positions of both source and receivers are described in Fig. 10. The source time function duration is 0.4.
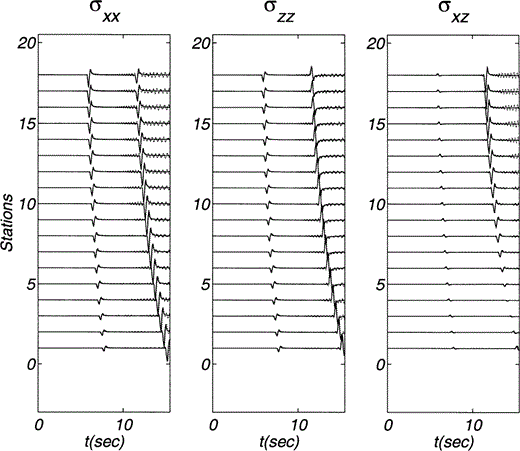
Stress components σxx, σzz and σxz due to a vertical line load within an inhomogeneous medium. Material properties and the positions of source and receivers are given in Fig. 10. The source time function duration is 0.4. These stresses have been computed from the analytical displacements presented in this paper.
Other gradients and receiver configurations were studied with good results. The main limitations arose in the validation of results using the pseudospectral method for higher frequencies and larger gradients. In particular, distant receivers are difficult to compute numerically because the size of the grid needed can be exceedingly large. Typical calculations of the numerical examples presented herein require several hours of CPU time on a SUN‐ULTRA workstation. In contrast, our approximate analytical solution takes a few seconds.
Discussion
Our approximate analytical ansatz is regular and can be computed easily. It appears to be reliable in many circumstances. However, it is convenient to consider other aspects of the problem. The exact 3‐D solution for the explosive source in a constant‐gradient elastic medium was obtained by Beydoun & Ben‐Menahem (1985) from the Pekeris (1946) solution to the 3‐D scalar problem. Their results, which correspond to the propagation of only P waves, clearly illustrate that a significant part of the displacement occurs along the ξ‐coordinate. We established in our heuristic 2‐D proposal that most ‘radial’ displacement corresponds to P waves. This is in qualitative agreement with their results. They also showed that the heterogeneity induces some dispersion, which we neglect in our approach. This fact could probably be used to explain the small differences observed. Indeed, a more detailed study of the range of validity of the approximate analytical solution has to be carried out, starting with Beydoun & Ben‐Menahem's (1985) results.
A subject that will require further scrutiny is the estimation of the errors. An appropriate measure of relative error can be defined in terms of the governing equation of the problem. For example, in the following we propose a measure of the relative error for the SH problem. Away from the source, the equation of motion can be written as

Clearly, for an exact solution ε = 0. In this expression ε is the error and has the same units as Gyy; therefore, a natural measure of the relative error is the ratio |ε/Gyy|, despite the fact that the Green's function is approximate. We thus define the relative percentage error as E(%) = |ε/Gyy| × 100, which can be expressed explicitly as

We computed this relative error for various configurations and generally found it to be less than 1 per cent. Derivatives were calculated again with a centred scheme with spatial intervals being about 1/20 of a wavelength. The corresponding measure of error for the P–SV case is being developed along these lines.
Conclusions
We have presented approximate analytical formulae for elastic 2‐D Green's functions for an inhomogeneous medium with a constant gradient of propagation velocity. For this medium both rays and wave fronts are circular. The solutions correspond to the antiplane SH line load and the in‐plane (P–SV) horizontal and vertical line forces, respectively. This idea is being extended to the 3‐D case. Our ansatz are based on the asymptotic ray theory and account for near‐source effects and low frequencies. The approximate analytical expressions obtained were verified by comparing them with results obtained using a pseudospectral method with a velocity–stress staggered grid. The agreement of the approximate analytical displacement and stress fields with their numerical counterparts is very good. For SH waves a measure of relative error has been proposed to gauge the goodness of the approximation. For a wide range of properties, the computed errors are small. Extension to the P–SV cases is under way.
The derivation of our approximate solutions is heuristic and based upon ray theory considerations. The final result is simple: to compute the approximate 2‐D Green's function for the constant‐gradient medium studied herein,
- 1
calculate the displacements in bipolar coordinates using the expressions for a homogeneous medium (in polar coordinates) with the correct traveltime of the inhomogeneous medium;
- 2
correct the amplitudes by multiplying by the factor Λ; and
- 3
rotate the results to the coordinate system of interest.
For many applications this approach may provide a fast and reliable way to compute both the displacement and the stress fields.
Our approximation is regular everywhere. At the point of application of the line force the singularity can be handled by conventional means. Moreover, by construction our formulae provide the appropriate scaling between near‐source and far‐source displacement solutions. Therefore, due to their analyticity, the Green's functions presented herein could be well suited for boundary integral formulations.
Acknowledgments
Many thanks to L. Ramı´rez for his multifarious help in the numerical computations and to O. Coutant, F. Janod, M. Korn, K. Larner, I. Pšenčı´k, R. Vai and J.‐P. Vilotte for their constructive, keen and critical remarks. S. Aoi, R. Avila‐Carrera and A. Pech participated in early stages of this research. M. Caamaño and X. Palomas helped us to locate valuable references. This work was partially supported by DGAPA‐UNAM, México, under grant IN104998, by CONACYT, México, under project NC‐204 and by the Japanese Society for the Promotion of Science.
References


