


Summary
In this paper we present newly acquired high‐quality wide‐angle seismic data of the GRANU95 project and first models of the crustal structure along two profiles (95‐A and 95‐B) beneath the Saxonian Granulites, a major ellipse‐shaped exposure of lower‐crustal material within the mid‐European Variscan belt in southeastern Germany (Saxony). The crust is subdivided into four layers. The crystalline basement with velocities higher than 6.0 km s−1 is generally reached at shallow depths, with three major sedimentary structures as prominent exceptions where velocities considerably lower than 6.0 km s−1 (as low as 5.1 km s −1 ) reach as deep as 4 km. The highest upper‐crustal velocities (up to 6.5 km s−1 ) are not seen below the exposed granulites themselves, but at shallow depths (4 km) SW of the exposure. These shallow high velocities correlate well in depth with highly reflective zones observed on three seismic‐reflection lines of DEKORP (85‐4N, 95‐01, 95‐02) at their intersection with the seismic‐refraction line 95‐B, where they appear as a set of NW–SE‐trending dome‐shaped reflections. On profile 95‐A this high‐velocity upper‐crustal layer (6.3 km s−1 ) dips from 5 to 9 km beneath the SE margin of the exposed granulites. These results suggest that the granulite dome and its western continuation are widely underlain by a NE‐trending antiformal structure (probably a sheet of metabasic rocks) where the exposed felsic granulites form just a local cap on top. Below the upper‐crustal high velocities, a layer with decreased velocity (6.2–6.25 km s−1 ) extends down to an average depth of 15 km along the Variscan strike (95‐B) and to 11–16 km depth (slightly dipping towards the SE) perpendicular to the terrane boundaries (95‐A). At mid‐crustal levels a weak reflection from a layer with a velocity of 6.4–6.6 km s−1 may indicate the classical Conrad discontinuity. At the depth range 22–24 km the velocity jumps to an average value of 7.0 km s−1, thus defining a prominent high‐velocity layer in the lower crust, which may be viewed as the well‐known laminated lower crust typical of Variscan structures, but with higher average velocity than usually detected. The crust–mantle boundary at about 30–31 km is typical for western Europe and confirms the extensional signature of the West European crust. Below the Moho, poorly constrained upper‐mantle velocities of about 7.9–8.0 km s−1 are derived. The high velocities observed in the lower‐crustal layer would not exclude the possibility of mantle‐derived intrusions, but the lack of any sign of an updoming Moho favours the interpretation of a more passively driven extension.
1 Introduction And Geology
The Saxonian Granulites represent a large unit of exposed granulitic lower crust within the Saxothuringian terrane. The high‐pressure granulites are part of the Variscan orogenic belt and are located at the northern margin of the Bohemian Massif (Fig. 1).
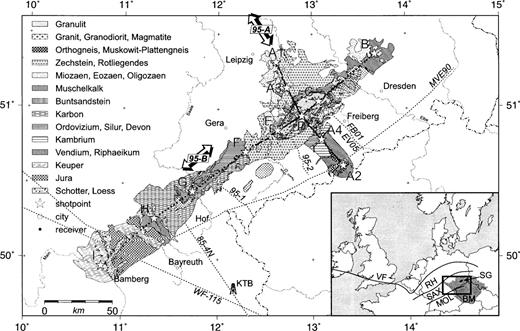
Location map and geological framework of the seismic experiment GRANU95 involving 2 profiles: 95‐A and 95‐B. The shotpoints of the refraction seismic experiment are marked by stars and each receiver is represented by a black circle. Other seismic lines (FB‐01/EV05, Bölsche & Kresser 1980; 95‐01 and 95‐02, DEKORP & Orogenic Processes Working Groups 1998; 85‐4N, DEKORP Research Group 1988; reflection: MVE90, DEKORP Research Group 1994b; refraction: WF‐115, Zeis et al. 1990) in the vicinity of our study area are plotted as dashed lines. (Inset: VF = Variscan Front; RH = Rhenohercynian belt; SAX = Saxothuringian belt; MOL = Moldanubian belt; BM = Bohemian Massif; SG = Saxonian Granulites.)
The understanding of processes that transported lower‐crustal material to the Earth's surface within the era of the Variscan orogeny is one of the main challenges in reconstructing its evolutionary history. Various models involving magmatic and/or tectonic processes were proposed by geologists to explain the exhumation of the Saxonian Granulites. While early interpretations favoured compressional mechanisms, interpreting the granulite complex as an isolated diapir of deep crustal material (Behr 1978; Behr 1984), more recent interpretations have focused on post‐collisional extension as the main cause of the exhumation of the Saxonian Granulites. For example, Matte et al. (1990) suggests that the granulites were emplaced along a low‐angle normal fault that formed during the orogenic collapse of the Variscides.
A petrological reconstruction of the metamorphic history of the Saxonian Granulites reveals a near‐isothermal decompression path (Rötzler 1992) and therefore indicates that at least part of these granulites were intruded in an extensional regime. Taking this into account, Franke (1993) used the model of a ‘metamorphic core complex’ to explain the exhumation of the Saxonian Granulites in a multistage evolution that involves Precambrian protolith formation, two periods of Palaeozoic rifting (granulite facies metamorphism) including simple‐shear extension, and finally moderate compression. He points out that the Saxonian Granulites strongly resemble the ‘metamorphic core complexes’ of the Basin and Range Province in the western USA (Coney 1980), where similar processes seem to be active today.
Detailed seismic exploration of the metamorphic core complexes of the Basin and Range Province by the US Geological Survey allow one to quantify the anatomy of this metamorphic core complex (McCarthy et al. 1991). Important results from their interpretation of the seismic data include a shallow zone of high velocities (6.4 km s−1 ), a generally thinned crust (<30 km) with a thickened lens‐shaped mid‐crustal layer (6.35–6.5 km s−1 ) below the exposed high‐grade rocks, underlain by a high‐velocity lower‐crustal layer (6.6 km s−1 ) and an almost subhorizontal Moho.
Reinhardt & Kleemann (1994) describe the Saxonian Granulites as a classical example of formerly deep crustal rocks in tectonic contact with low‐pressure sequences (upper‐crustal rocks), which indicates tectonically driven exhumation. They propose a ‘hot core complex’ model of asymmetric crustal extension with rapid exhumation of granulitic lower crust along a low‐angle detachment zone. In the Basin and Range Province, such a crust‐penetrating shear zone is not seen in the data of McCarthy et al. (1991). On the contrary, they resolved more vertical alignments of extension‐related structures in the upper, middle and lower crust.
The zircon fractions from core granulites have been dated at 352 ± 2 or 340 ± 4 Ma (pre‐Devonian) and interpreted to reflect the stage of high‐pressure metamorphism Quadt & Gebauer 1990), which is not compatible with the biostratigraphic age of the overlying Devonian and Early Carboniferous sedimentary and volcanic rocks. Franke & Oncken (1996) conclude from the isotopic data that the Saxothuringian parautochton and the underlying high‐pressure rocks must represent a tectonic sequence of originally separate terranes. They propose a model in which the high‐pressure floor of the Saxothuringian was formed by subduction in the Rhenohercynian belt, lying adjacent to and to the northwest of the Saxothuringian, and emplaced by tectonic underplating under the Saxothuringian lithosphere, which had earlier been thinned by Palaeozoic rifting.
While there is nowadays general agreement among the majority of geoscientists about the importance of extension in the exhumational history of the Saxonian Granulites, there are still controversial ideas about the deeper structure and the lateral extent of the granulite complex. Do the Saxonian Granulites represent an isolated body in the upper crust or are they associated with a deeper root, which would be implied by magmatically driven processes? Is there seismic evidence for a crust‐penetrating shear zone as proposed by Reinhardt & Kleemann (1994)? Is there a structural link to other exposed high‐pressure rocks (e.g. the Münchberger Gneismasse) in the near vicinity?
A series of geophysical experiments involving seismic refraction (this paper), seismic reflection (DEKORP & Orogenic Processes Working Groups 1998) and magnetotelluric measurements (Oettinger, Schwarz & Haak 1996; Oettinger et al. 1997) was carried out to resolve the crustal structure and to derive its composition. This knowledge, combined with geological data, can provide well‐constrained models for a better understanding of the processes leading to the exhumation of the Saxonian Granulites.
In this paper we present new wide‐angle data from the seismic‐refraction experiment GRANU95, together with a first interpretation, including 2‐D models, for the crustal structure beneath the Saxonian Granulites.
2 Experiment Design
In May 1995 a seismic‐refraction experiment was carried out as part of the priority program of the Deutsche Forschungsgemeinschaft (DFG) ‘Orogenic processes—their quantification and simulation at the example of the Variscides’.
Two profiles, 95‐A and 95‐B, were completed in two deployments (Fig. 1). In order to obtain a complete picture of the Saxothuringian anomaly, the seismic line 95‐B was designed to obtain recording distances of up to 260 km. This ensures that seismic waves generated by borehole explosions penetrate the whole crustal depth range. A contemporaneous high‐resolution cross‐profile (95‐A) serves to investigate the crustal structure beneath the Saxonian Granulites in three dimensions. Along the 90 km long NW–SE profile (95‐A) from Leipzig to the Erzgebirge (border with the Czech Republic) through the metamorphic dome of the Saxonian Granulites, 74 instruments were installed; in addition 56 stations were placed symmetrically around shotpoint D along line 95‐B (perpendicular to 95‐A). Shots were executed at locations Al, A2, A3 and A4 (Fig. 1). The two smallest shots, A3 and A4, served to provide detailed seismic control in the area of the exposed granulites. The station spacing for this high‐resolution deployment was around 1.3 km. Every second instrument from deployment A was then moved to complete line 95‐B. The 260 km long SW–NE profile (95‐B) from Dresden to Bamberg crosses the Saxonian Granulites between shotpoints C and E. Shots were executed at locations B, C, D, E, F, G, H and I (Fig. 1) and recorded along line 95‐B with 93 instruments and on line 95‐A (perpendicular to 95‐B) with 37 instruments at a receiver spacing of about 2.6 km.
In total, 12 borehole shots varying in charge size from 100 to 900 kg (Table 1) were executed and over 4500 seismograms were collected using 130 instruments. The average distance between the different shot locations was about 23 km on line 95‐A and 33 km on line 95‐B. The largest shots, B and I, were located off the ends of profile 95‐B to the southwest and northeast, respectively, yielding maximum source‐to‐receiver offsets of 260 km. Additionally, the DEKORP reflection system DFS‐5 (96 channels) was installed near shotpoint F and recorded all shots with a geophone spacing of approximately 80 m (see Fig. 2).
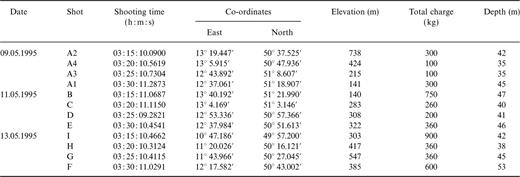
Shotpoint data for the seismic‐refraction experiment GRANU95.
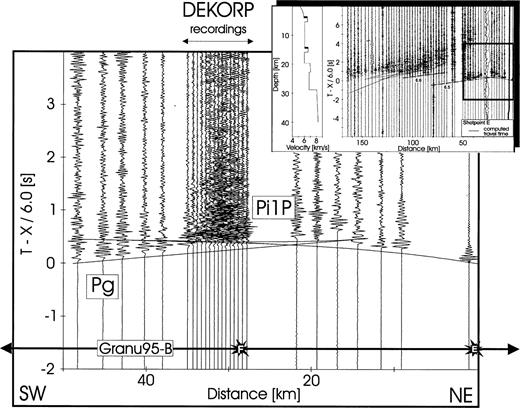
Seismic record section from shotpoint E to the SW. Inset: left—1‐D velocity–depth function; right—P‐wave record section showing traveltime curves computed from the 1‐D model on the left. The 1‐D modelling suggests the presence of a high‐velocity layer near 5 km depth. The area near shotpoint F is shown enlarged. Main diagram: near shotpoint F the DEKORP reflection system has recorded all shots with a geophone spacing of about 80 m (96 channels). Here these data were particularly useful in identifying the near‐surface reflection Pi1 P.
Two different types of digital data acquisition instruments with their individual data formats have been used for recording the explosions. All instruments were equipped with identical three‐component 1 Hz seismometers. The data were recorded with a sample rate of 10 ms. After downloading and merging, the data were converted to the SEG‐Y format (Barry, Cavers & Kneale 1975). Details of the recording equipment are provided in Table 2.
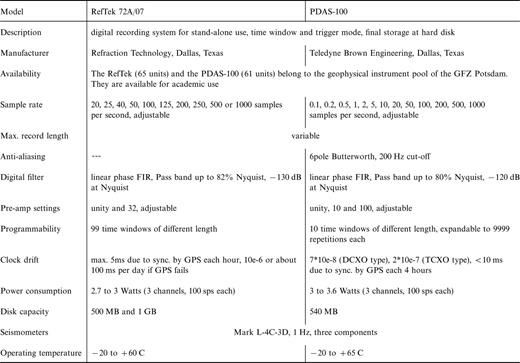
Technical specifications of the seismic‐refraction equipment from the geophysical instrument pool of the GeoForschungsZentrum (GFZ) Potsdam.
In an almost parallel study the DEKORP Working Group (DEKORP & Orogenic Processes Working Groups 1998) carried out near‐vertical seismic‐reflection measurements along two lines perpendicular to profile 95‐B. The first reflection seismic line (95‐01) crosses the refraction line 95‐B between shotpoints G and F and the second (95‐02) crosses at shotpoint E (Fig. 1).
The shots of the GRANU95 experiment were also recorded by the KTB seismic array (recording area: Oberpfalz), the University of München (recording area: Oberpfalz), the Technical University of Freiberg (recording area: Sachsen) and the Polish Academy of Sciences, Warsaw (recording area: extension of line 95‐B on Polish territory). In the framework of GRANU95, magnetotelluric data have also been collected along the seismic refraction profile (95‐A). These data, however, are discussed elsewhere (e.g. Oettinger et al. 1996; Schuster et al. 1997) and are not the subject of this contribution.
3 Data And Correlation Of Phases
Filtered record sections with a reduced traveltime are the best means of presenting explosion seismic data. All record sections presented in Figs 2–4 are the vertical‐component sections, plotted with a reducing velocity of 6 km s−1. Amplitudes are plotted trace‐normalized, which means that the maximum amplitude is the same for each trace. The records were bandpass filtered in the range 2–24 Hz (useful for the detection of upper‐crustal structures) on line 95‐A. For line 95‐B a bandpass filter in the range 2–12 Hz gave the best results.
The phases that have been interpreted are Pg (the diving wave in the crystalline basement), Pi1 P (the reflection from the upper‐crustal layer), Pi2 P (the reflection from mid‐crustal levels), Pi3 P (the reflection from the lowest crustal layer), Pi3 (the diving wave below the lowest intercrustal boundary), PM P (the reflection from the Moho) and Pn (the diving wave beneath the Moho). The traveltime curves in the record sections of Figs 2–4 are theoretical traveltimes calculated from the final models shown in Fig. 7.
P‐wave velocity models for GRANU95 along line 95‐A (upper right) and line 95‐B (bottom). Labels give the P‐wave velocity in km s−1. In addition, the 1‐D velocity–depth function at the intersection of both models is shown (upper left).
3.1 Near‐surface and basement refractions
In general, a common feature of all seismogram sections is a clear Pg phase recognized as the refracted wave through the uppermost crust. This phase is seen on all record sections as first arrivals which disappear at shotpoint–receiver distances greater than 80–100 km on line 95‐B and 50–60 km on line 95‐A. The abrupt disappearance of this phase points to a change in the velocity gradient at shallow depths. In the time‐reduced record sections (Vred = 6.0 km s−1 ) the Pg phases appear almost horizontal. Prominent exceptions are the observations to the SW of the record sections of shotpoints D, E, and F (Fig. 4), where the slope of Pg is clearly negative and indicates higher apparent velocities in the basement of this area.


Assemblage of trace‐normalized P‐wave record sections for all shotpoints on line 95‐B, plotted with a reduction velocity of 6·0 km s−1. The data have been band‐pass filtered from 2 to 12 Hz. Superimposed are the traveltimes (dashed lines) computed with ray‐tracing from the P‐wave model for line 95‐B shown in Fig. 7. The record sections are plotted together with an elevation profile along the seismic line, which also shows the locations of shotpoints and the main geological features (FL = Franconian Line, GJZ = Gera‐Jachymov Zone, exposed granulites, EL = Elbe Line).
3.2 Crustal reflections
Three major intracrustal phases, Pi1P , Pi2 P and Pi3 P, could be identified on both profiles. The Pi1 P phase is mainly observed on line 95‐B as a shallow reflection southwest of the exposed granulites. This phase is reflected from a high‐velocity layer (up to 6.5 km s−1 ) at a shallow depth range (4–5 km). Along profile 95‐A, Pi1 P could be identified in the same depth range (about 5 km in the northern part and about 9 km in the southern part) as a reflection from a layer with a velocity of about 6.3 km s−1. Pi2 P and Pi3 P are interpreted as reflections from the lower part of the crust. Pi2 P, interpreted as a reflection from the bottom of the upper crust (at about 15 km depth), is not seen in all the record sections and in general has weak amplitudes. Two exceptions, where a strong Pi2 P phase occurs, are the record sections for shotpoints A2 and A4 (Fig. 3). In contrast to Pi2 P, the Pi3 P phase appears with higher amplitudes just before the reflection from the crust–mantle boundary (PM P). The Pi3 P phase marks a zone of high velocity (about 7 km s−1 ) at the bottom of the lower crust (22–24 km depth).
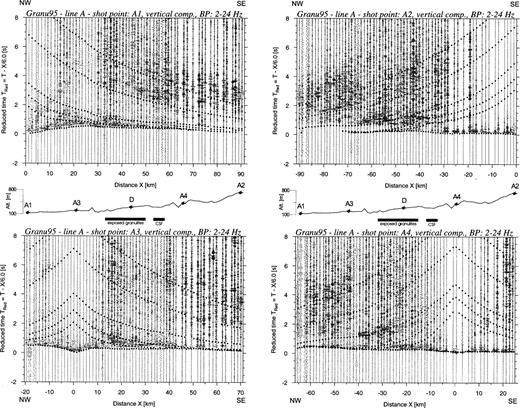
Assemblage of trace‐normalized P‐wave record sections for all shotpoints on line 95‐A, plotted with a reduction velocity of 6.0 km s−1. The data have been bandpass filtered from 2 to 24 Hz. Superimposed are the traveltimes (dashed lines) computed with ray tracing from the P‐wave model for line 95‐A shown in Fig. 7. The record sections are plotted together with an elevation profile along the seismic line, which also shows the locations of shotpoints and the main geological features (exposed granulites, CSF = Central Saxonian Fault System).
Other intracrustal phases could be correlated on line 95‐A, most probably due to the denser station interval (1.3 km versus 2.6 km on profile B). These phases are not very clear and the present data set cannot distinguish between intercrustal reflections on the one hand and scattering effects and/or strong lateral variations of the three major reflectors mentioned above. Keeping in mind the complex geology of the area of investigation (crossing and/or running parallel to several fault zones), scattering effects and/or 3‐D effects cannot be excluded.
3.3 Moho reflection and upper‐mantle refraction
Since no clear Pn is observed and the PM P phase is often masked by the coda of the Pi3 P phase, Moho depths are derived with some uncertainties. The maximum recording distance on line 95‐A is about 90 km and the critical point of the PM P reflection is between 80 and 90 km. Thus most of the PM P energy observed on line 95‐A is subcritical and therefore weak. This is not the case on line 95‐B, where the maximum recording distance is up to 260 km. Here the PM P is in general strong, but not sharp. A classical phase correlation of the PM P is almost impossible since no coherent energy occurs from trace to trace. In a more general study of the PM P reflection, Enderle et al. (1997) describe the observed PM P coda as a wave package of supercritical multiple reflections or peg‐legs with about the same amplitudes as the primary PM P reflection, slightly shifted in space and displaced in time by about the dominant period of the primary PM P reflection. In the GRANU95 data also, the PM P is typically accompanied by a strong coda (cf. shotpoint C in Fig. 4), lasting for a few cycles, which may indicate a transitional nature for the seismic velocity near the Moho.
4 Interpretation Techniques And Model
4.1 Techniques
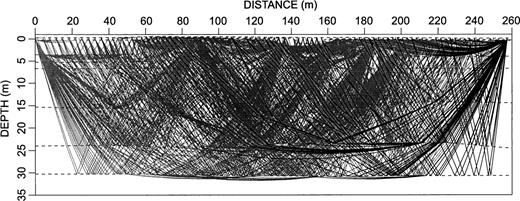
For a first interpretation, forward traveltime modelling was applied, which consists of three major steps. First, in each record section (Figs 3 and 4) those phases which could be identified over larger distance ranges were correlated. Second, after the identification of the main phases, including reciprocal time checks for the reflected and refracted phases, 1‐D velocity–depth functions were calculated for each individual shotpoint and profile direction. To take into account traveltime undulations caused by varying thickness of near‐surface material, an inversion of Pg traveltimes using the time‐term approach (Bamford 1976) for line 95‐B (Fig. 5) and a finite‐difference first‐arrival algorithm Podvin & Lecomte 1991) for line 95‐A was used to determine the time delay of sediments and the velocity of the crystalline basement (Pg ). Third, the iterative ray‐tracing technique based on the ray theory described by Červený, Molotkov & Pšenčik (1977) was applied to derive the P‐wave velocity models presented in Fig. 7. Topography, varying between 140 and 740 m in the study area, was taken into account along both profiles. In Fig. 6 we present as an example a ray diagram showing the depth penetration of seismic rays beneath shotpoint B (black rays) and the total ray coverage for all shots and all phases along line 95‐B (grey rays).
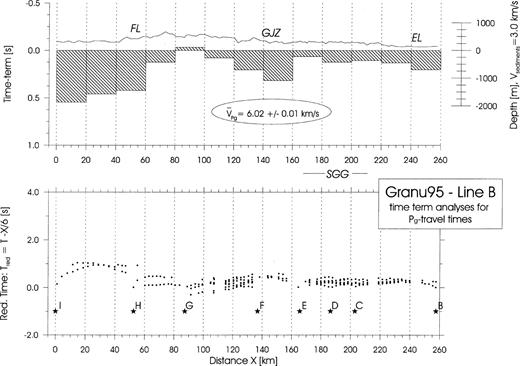
Time‐term analyses for Pg data (upper diagram) along line 95 ‐B provides an average velocity of 6·0 km s−1 for the Pg phase observed along this line (lower diagram). Note the good correlation of large delay times with the sedimentary basin SW of the Franconian Line, the Gera‐Jachymov Zone (GJZ) and the Elbe Line (EL).
Ray diagram showing the depth penetration of seismic rays beneath shotpoint B (black rays) and the total ray coverage for all shots and all phases along line 95‐B (grey rays).
4.2 Velocity model
4.2.1 Near‐surface velocity structure
In the northern part of the approximately 90 km long profile 95‐A, trending from NW to SE, the Tertiary syncline sedimentary structure south of Leipzig could be resolved very well (see Fig. 7). From Pg modelling a high‐velocity structure between profile km 25 and 30 rises to a depth of about 1.5 km. Towards the SE the Saxonian Granulites are exposed along the ensuing 15 km with velocities of about 6.0 km s−1. The southeastern boundary of the exposed Saxonian Granulites consists of a nearly 10 km wide fault zone, the so‐called Central Saxonian Fault System. Shot points A4 and A2 were located in the northern part of the East Erzgebirge Crystalline rocks. To model the basement, velocities of about 6.05 km s−1 were used.
Along line 95‐B two major sedimentary basins are resolved. First, the Franconian Line near shotpoint H separates sedimentary rocks to the west with velocities of about 5 km s−1 to about 4.5 km depth from basement rocks to the east with velocities greater than 6 km s−1. Second, the Permo‐Carboniferous basin when crossing the Gera–Jachymov Zone at the SW edge of the exposed Saxonian Granulites is evident in a local delay of the first arrivals (Fig. 7). Lateral variations of the basement velocity in the Variscan strike direction range from 6.0 km s−1 east of the Elbe river (near shotpoint B) to 6.3 km s−1 below the area of the Werdauer Wald (shotpoint F). Further to the SW the P‐wave velocity decreases to values of about 6.1 km s−1 and becomes as low as 5.1 km s−1 at the Franconian line.
4.2.2 Upper‐ and mid‐crustal velocity structure
On line 95‐A the main feature of the upper crust is a highly reflective boundary at depths between 5 and 9 km with a velocity of 6.3 km s−1. The reflector is indicated by strong amplitudes which coincide with the appropriate critical distances (cf. Pi1 P in Figs 3 and 4). The reflector depth changes from about 5 to 9 km in the region of the SW–NE‐striking Central Saxonian Fault System. The step is modelled as a flexure, but the available data would not exclude a fault‐like step of the reflector. One additional phase gives indications for a reflector at the bottom of this approximately 3 km thick high‐velocity layer (HVL). These results are in good agreement with a final stack section from profile MVE 90 (DEKORP Research Group 1994a) which intersects line 95‐A in the area of Olbernhau at the southeastern end of the profile. Here, reflectors at about 3.0 and 4.0 s two‐way time (TWT) can be correlated with the HVL. Furthermore, similar SE‐dipping events in the same depth range were found on profiles FB01V‐75 and EV05‐78 Bölsche & Kresser 1980). Both NW–SE‐striking profiles are located 30 km NE of profile 95‐A and reach line 95‐B near shotpoint C (Fig. 1).
A highly reflective boundary has also been modelled for line 95‐B, based on a near‐surface reflection (Pi1 P) which is particularly well resolved in the area of shotpoint F. Near shotpoint F the DEKORP 96‐channel seismic recording system DFS‐5 has recorded all shots with a geophone spacing of about 80 m. These data were particularly useful in identifying the Pi1 P reflection (Fig. 2). The seismic‐reflection data recorded by DEKORP on lines 95‐01 and 95‐02 (Fig. 1) show highly reflective zones, especially at the intersection with the refraction line 95‐B (DEKORP & Orogenic Processes Working Groups 1998), which are in good agreement with the depth location of the high‐velocity layer derived from the refraction data in model B (Fig. 7). These high velocities are interpreted as high‐grade metamorphic rocks similar to the granulites which are exposed further east. There, however, the exposed granulites do not generate such high velocities in the Pg phase (e.g. shotpoint D to the NE), probably because of weathering and pressure release and possibly also due to a different petrology.
Modelling Pi2 P along profile 95‐A results in a reflector which dips smoothly southeastwards from a depth of about 10 km in the NW to about 15 km depth in the SE. On profile B this reflector is at a depth of about 15 km, slightly deeper in the central part of model B. The velocity of this layer ranges from 6.4 to 6.6 km s−1.
4.2.3 Lower‐crustal velocity structure and crust–mantle boundary
The lowermost crust shows a high average velocity of about 7 km s−1. This velocity is constrained by traveltime modelling of the Pi3 P phase and is supported by refracted waves (e.g. Pi3 in Fig. 4, shotpoint B). Although PM P is partly masked by the preceding phase Pi3 P and Pn cannot be identified, the identification of the crust–mantle boundary is nevertheless unique, and as a result the Moho is modelled at a depth of about 30–31 km without any major topography and with poorly constrained velocities of 7.9–8.0 km s−1 below. A visual inspection of the amplitude characteristic of the supercritical PM P (Fig. 4) indicates that the signal generated at the crust–mantle boundary carries the most prominent reverberations compared to the other phases. These reverberations or coda may originate from fine structure at or near the crust–mantle boundary. The PM P phase must therefore be regarded as a complex response from the crust–mantle transition and needs full‐wavefield modelling to explain its appearance. However, it has been realized by various authors that within the PM P coda phase velocities considerably lower than typical mantle velocities of 8 km s−1 are evident (Enderle et al. 1997; Giese 1972).
4.3 Uncertainties
From experience in the interpretation of many deep‐seismic‐sounding data it is known that the main structural features can be reliably resolved by a careful traveltime analysis of P waves only. It is the purpose of this contribution to present a first overview of the data and to derive a first model which can be discussed and used by the geoscientific community and which shall serve as a basis for a more advanced analysis of the seismic data in the context of other geological and geophysical data. Therefore, at this stage we have deliberately restricted ourselves to traveltime modelling. As is the case with all forward‐modelling interpretations, uniqueness is impossible to guarantee. The 2‐D model presented here is non‐unique but does account for the major features observed in the seismic data. Since the greatest errors are introduced by the interpreter during the phase correlation it is difficult, if not impossible, to give quantitative errors for the velocity model. Velocities derived from refracted phases such as Pg or Pn are certainly more reliable than velocities derived from reflected phases. Nevertheless, it can be estimated that depth errors for velocity boundaries derived for the first‐arrival Pg phases are within a few hundreds of metres, while depth errors for velocity boundaries derived from later‐arrival reflections are of the order of 1–2 km, always assuming that the phase correlations are unique.
The evaluation of P‐wave traveltimes alone can only provide a preliminary velocity and structural model. A more advanced analysis of the full wavefield, applying for example the reflectivity method Fuchs & Müller 1971; Sandmeier & Wenzel 1986) or finite‐difference calculations Levander & Holliger 1992), may provide more details resulting in further refinements of the present 2‐D model, such as lamination of the lower crust and the fine structure of the crust–mantle transition zone, as is discussed by e.g. Enderle et al. (1997), Gajewski & Prodehl (1987), Giese (1972) and Zeis, Gajewski & Prodehl (1990). Also, S waves, which were recorded with good quality, have not yet been interpreted.
5 Discussion
5.1.1 Special features of the crustal structure
The analysis of all Pg phases results in an average basement velocity of about 6.0 km s−1, including the area where granulites are exposed. There is some indication of a reflective body underlying the exposed granulites from reflected phases on profile 95‐A. Modelling of the data from shotpoints E, F and G indicates a zone of high P‐wave velocities (6.5 km s−1 ) at shallow depths SW of the Saxonian Granulites. The constant depth level of this high‐velocity layer along line 95‐B and the morphology, indicated in line 95‐A and in the line 95‐02 data (DEKORP & Orogenic Processes Working Groups 1998), both perpendicular to the Variscan strike, suggest a sudden increase in depth of this high‐reflective/high‐velocity zone south of line 95‐B.
The crust consists of four layers: upper, middle and lower crust, with a subdivision of the lower crust. The existence of a lowermost crust with a velocity as high as 7.0 km s−1 is evidenced by the reflections Pi3 P clearly visible immediately in front of the PM P phases. This zone of high velocity above the Moho has been recognized before within the Saxothuringian part of the EGT (Aichroth, Prodehl & Thybo 1992) as well as along the MVE‐90 line through the Erzgebirge (DEKORP Research Group 1994a). Its existence seems to be a typical feature of the Saxothuringian belt and is usually not seen in other parts of the Variscan crust [e.g. the Moldanubian zone, Gajewski & Prodehl (1987), the Rhenohercynian zone, Mechie, Prodehl & Fuchs (1983) and the EGT traversing all zones, Aichroth et al. (1992) ]. As Pn is not clearly observed and PM P is often masked by the coda of the reflection from the lower crust, the velocity in the upper mantle and the depth of the Moho are not well constrained.
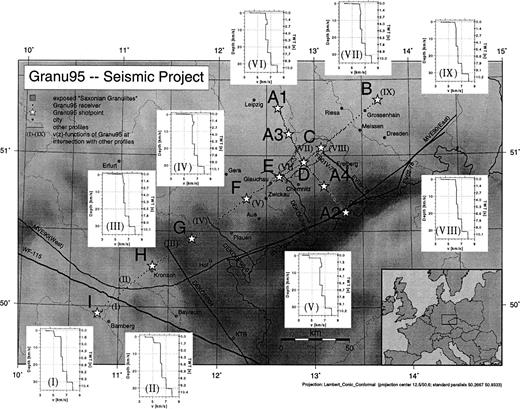
Fig. 8 summarizes the results of the refraction seismic survey GRANU95. In this map nine velocity–depth functions taken from the 2‐D model for line 95‐B are plotted at various locations. Most are given at intersections of the GRANU95 line 95‐B with existing or newly investigated seismic‐reflection profiles. The velocity–depth functions are displayed with an additional non‐linear axis showing the corresponding TWT for a given depth. These diagrams enable a comparison of the results obtained from seismic‐refraction study GRANU95 with seismic images obtained by seismic‐reflection profiling. A first comparison of this model 95‐B and the crossing reflection lines of DEKORP, 95‐01 and 95‐02, shows a remarkable coincidence of highly reflective zones at about 1.5 s TWT and the top of the high‐velocity zone of model 95‐B at about 4 km depth. Also, at its base at about 6 km depth an analogous reflection can be traced at least on the reflection section 95‐02 (Krawczyk & DEKORP & Orogenic Processes Working Groups 1998). For a compilation of our results together with the DEKORP95 seismic‐reflection data and first results of the magnetotelluric studies along line 95‐A, the reader is referred to a joint publication of the DEKORP & Orogenic Processes Working Groups (1998).
![Map of study area with nine velocity–depth functions taken from the 2‐D model for line 95‐B (cf. Fig. 7, bottom). The v(z) functions (I)–(VIII) correspond to intersections of line 95‐B with seismic‐reflections lines of DEKORP [MVE90, (II); DEKORP4N, (III); 95‐01, (IV); 95‐02, (VI); DEKORP95 at shotpoint F, (V) ], the seismic‐reflection line FB01‐V (VIII), 95‐A [ (VII), this paper], the seismic refraction line WF‐115 (I) from the Wildflecken experiment (for references see caption to Fig. 1). The v(z) function (IX) is given for shotpoint B.](https://oup.silverchair-cdn.com/oup/backfile/Content_public/Journal/gji/133/2/10.1046/j.1365-246X.1998.00462.x/2/m_133-2-245-fig008.jpeg?Expires=1749921678&Signature=oEFRbnlhdcCk4pIluh6BZeyAKvE9jb6lmJY6LPeT8GY~QBRDOuoB4YxDz2zAzFJcTfhrovoJ3cWv28VjVuwycraQrBWdng4spcBFDgHWlQxKUtph5WaqZD9O80nEJt-yGFUHeI2WMtGXYyhcSPT9OT7PvcSgI3GKbI4m7J0Vz2Y6KGXhyc7nXvKEJK3V8Zb~aXH3oFFEsGEwKrOuCHVAvl9BI6wMXk6d6EciD9g1tBsgSzquWcxP1RANi1GhI4rthZceYaWT7zRD2WCe2zoPCopoFOjFwIQ2667LIewn584MIAup2R6zaMZ6V-uX7mdGVUkPPGwDNEOs1mW8p7emuQ__&Key-Pair-Id=APKAIE5G5CRDK6RD3PGA)
Map of study area with nine velocity–depth functions taken from the 2‐D model for line 95‐B (cf. Fig. 7, bottom). The v(z) functions (I)–(VIII) correspond to intersections of line 95‐B with seismic‐reflections lines of DEKORP [MVE90, (II); DEKORP4N, (III); 95‐01, (IV); 95‐02, (VI); DEKORP95 at shotpoint F, (V) ], the seismic‐reflection line FB01‐V (VIII), 95‐A [ (VII), this paper], the seismic refraction line WF‐115 (I) from the Wildflecken experiment (for references see caption to Fig. 1). The v(z) function (IX) is given for shotpoint B.
5.1.2 Petrological implications
The correlation of in situ seismic velocities and laboratory measurements of rock samples is influenced by pressure and temperature, where temperature is the more difficult parameter to estimate. Moving from the southwest along 95‐B the heat‐flow values rapidly decrease from values of above 80 mW m−2 when crossing the Franconian line. In the area of the exposed granulites only few heat‐flow measurements are available and thus the average heat flow can only be roughly estimated, but is generally low and does not seem to exceed 60–65 mW m−2Hurtig & Rockel 1991). In the framework of the EGT (Blundell, Freeman & Müller 1992) Čermák (1979) compiled a map of heat‐flow density which shows heat‐flow values as low as 30 mW m−2 in the vicinity of the shallow high‐velocity zone (shotpoints F and G) on line 95‐B. These heat‐flow measurements would predict low temperatures in upper‐crustal levels that generally increase the near‐surface velocities of felsic granulites compared to those in high‐temperature regimes. Christensen & Mooney (1995) summarized the composition of the continental crust in a global review and gave an average seismic velocity of 6.321 ± 0.133 km s−1 for felsic granulites at 5 km depth (ρ = 2755 ± 76 kg m−3 ) in a low‐temperature regime (64 °C).
P‐wave velocities from GRANU95 just below the exposed granulites (shotpoint D) correlate well with laboratory measurements of felsic granulite (Fig. 9, modified after Müller 1995) down to a depth of about 15 km, excluding the depth range 4–6 km, where velocities are too high (up to 6.5 km s−1 ) for felsic granulites and therefore, in order to be explained, need more mafic compositions. Further to the SW the seismic P‐wave velocities (shotpoint F) would be compatible with laboratory measurements only in the depth range 7–15 km. The coincidence of the velocities of the seismic and the laboratory measurements in this depth range is at this stage only a poor constraint for tracing the granulite complex to greater depths, because there is a wide range of rocks which could also explain the observed P‐wave velocity. The investigation of S waves, which is now in progress, may provide important constraints that narrow the range of possible compositions.
Comparison of velocity–depth functions derived from laboratory measurements (solid lines) for three different types of granulites from the Saxonian granulites (Müller 1995) with two velocity–depth functions from the 2‐D model along line 95‐B (cf. Fig. 7, bottom). The dashed line is a 1‐D cut through the model at the intersection of line 9 5‐A and B in the centre of the exposed granulites and the dotted line is a 1‐D cut through model B at shotpoint F SW of the exposed granulites. While the lower velocities in the upper crust correlate well with the velocity–depth function of felsic granulite, the high‐velocity body cannot be explained with felsic granulite.
Taking an average heat flow of 55 mW m−2 for our study area SE of the Franconian line and using the temperature–depth approach of Chapman & Furlong (1992), the temperature at the Moho depth would be about 476 °C. The velocity of the lowermost crust, with an average value of 7.0 km s−1 derived from GRANU95 data, is compatible with velocity estimates of mafic garnet granulite at 30 km depth and a temperature of about 467 °C Christensen & Mooney 1995). Alternatively, the lower crust could consist of felsic granulite facies if mafic eclogites are present in similar proportions. Such an intercalation of material with P‐wave velocities of about 6.3 and 7.9 km s−1 would strongly influence the amplitude pattern of the recorded seismograms. In the GRANU95 data we clearly see reverberating energy in the amplitude pattern of the deeper phases, but this has to be investigated in more detail by future amplitude modelling.
5.1.3 Tectonic speculation
The World Stress Map (Wehrle & World Stress Map Working Group 1997; Zoback 1992) provides only a few data points in the eastern part of Germany, which do not allow a conclusive interpretation themselves but do not contradict the conclusion of Müller et al. (1997) that Europe is presently under compression. In contrast to the present tectonic regime, the exhumation of the Saxonian Granulites during Variscan times is often explained by the model of a ‘metamorphic core complex’ (Franke 1993; Reinhardt & Kleemann 1994). In these models, the tectonic denudation is based on the concept of asymmetric crustal extension using the simple‐shear model of Wernicke (1985).
One consequence of applying the classical simple‐shear concept would be a major updomed Moho structure and owing to isostacy an unacceptably large reduction in local topographic elevation (3–5 km) above core complex structures Block & Royden 1990). None of these features, however, is observed in the Basin and Range Province (McCarthy et al. 1991) or in the Saxonian Granulite Massif. In the classical concept of isostacy this requires that mountain ranges 3–5 km higher than the surrounding area with a corresponding crustal root have existed at each site of a future core complex. In the case of the Saxonian Granulites the gravitational collapse of a Himalayan‐sized Variscan mountain belt and the post‐orogenic extension as a primary cause for the exhumation of the metamorphic core (Kroner 1995) is an obvious possibility for explaining the re‐equilibration of the Moho and surface topography. Alternatively, models of lower‐crustal flow Block & Royden 1990; Ruppel 1995) have become more and more popular in explaining core complex geometries. In these models the lower crust has a high viscosity and the ability to flow laterally on a regional scale, which accounts for isostatic compensation. This concept provides an obvious means of maintaining a flat Moho beneath zones of upper‐crustal doming without the necessity for pre‐existing Moho and surface topography.
Regardless of which model is used to exhume deep crustal material, all models generally feature a low‐angle shear zone along which deep crustal material may be transported to the surface. This shear zone extends down to the lower crust in the case of the ‘lower‐crustal‐flow model’ or even penetrates the whole crust in the ‘simple‐shear model’. Even if there is some indication in our data for dipping structures in the upper crust (especially on line 95‐A), at the present stage our model does not provide evidence for a crust‐penetrating fault. There are two simple possibilities for this: first, there is none, which may call for a second, more recent process that cleaned up the traces of extensional unroofing; or second, our seismograms are not densely enough sampled to resolve such faults, which may be connected with only relatively small velocity contrasts. These, however, are two critical points which hamper our interpretation in terms of evolutional processes. While it is difficult to exclude the interference of possible later processes [cf. the World Stress Map and the interpretation of Müller et al. (1997) ] with the exhumation process during Variscan times, the second problem of low spatial resolution of refraction seismic has been overcome by carrying out additional reflection seismic surveys. These data, together with a more advanced interpretation in terms of the tectonic evolution of the Saxonian Granulites, are presented in a separate paper (DEKORP & Orogenic Processes Working Groups 1998).
6 Conclusions
The seismic‐refraction lines GRANU95‐A and 95‐B were interpreted by forward traveltime modelling. The main features of the model are as follows.
(1) There is a good correlation of modelled sedimentary basins with surface geology.
(2) Basement velocities vary between 6.0 and 6.2 km s−1, but are slightly increased up to 6.3 km s−1 in the area SW of the exposed granulites.
(3) High velocities of 6.5–6.6 km s−1 are seen SW of the exposed granulites at shallow depths (4 km) and again at about 15–17 km depth (6.6 km s−1 ). This is in good agreement with highly reflective zones as seen in DEKORP95 data (DEKORP & Orogenic Processes Working Groups 1998).
(4) A sudden increase in depth of the high‐velocity upper‐crustal layer is only seen south of the Saxonian Granulites on line 95‐A perpendicular to the direction of Variscan strike. This is supported by the seismic‐reflection data DEKORP95 (DEKORP & Orogenic Processes Working Groups 1998).
(5) The lowermost crust shows a high average velocity of about 7.0 km s−1, which would not exclude the possibility of intrusions of mantle‐derived material. This zone of high velocity above the Moho seems to be a typical feature of the Saxothuringian belt which is not seen in other parts of the Variscan crust.
(6) Using classical phase correlations, the Moho has been modelled at about 30 km depth without major topography. Below the Moho poorly constrained upper‐mantle velocities of 7.9–8.0 km s−1 are derived.
(7) Evidence for a crust‐penetrating shear zone, as claimed by various authors (Matte et al. 1990; Reinhardt & Kleemann 1994), is not seen in the present data set. In the Basin and Range Province, such a crust‐penetrating shear zone is not seen in seismic‐refraction data from metamorphic core complexes (McCarthy et al. 1991). On the contrary, and similar to our present model for GRANU line 95‐B, McCarthy et al. (1991) resolved more vertical alignments of extension‐related structures in the upper, middle and lower crust.
Further refinement of these observations, combined with the results of magnetotelluric studies and the DEKORP reflection measurements carried out in the same area, will require a more refined and comprehensive study of the seismic‐refraction data, including the fan observations and S waves. This should lead to major advances in our understanding of the Variscan orogeny and orogenic processes in general.
Acknowledgements
This investigation would not have been possible without the continuous effort of many volunteers. We would like to thank all additional participants, especially those people who have been directly involved in the fieldwork: Thomas Fechner (Clausthal‐Zellerfeld), Martin Flinspach (Karlsruhe), Rüdiger Giese (Potsdam), Ellen Gottschämmer (Karlsruhe), Christian Haberland (Berlin), Jörg Herwanger (Clausthal‐Zellerfeld), Thomas Heßland (Leipzig), Martin Itzin (Karlsruhe), Michael Jordan (Karlsruhe), Thomas Kummerow (Berlin), Frank Lorenz (Potsdam), Ewald Lüschen (Potsdam), Niko Marquardt (Karlsruhe), Jim Mechie (Potsdam), Guido Oettinger (Leipzig), Lutz Ortlepp (Potsdam), Karl Otto (Potsdam), Thomas Plenefisch (Karlsruhe), Peter Röwer (Berlin), Sabine Spindler (Karlsruhe), Marc Tittgemeyer (Karlsruhe) and Veronika Wehrle (Karlsruhe). We are grateful to W. Franke, H.‐J. Dürbaum, P. Giese, P. Bankwitz, V. Haak, O. Oncken and G. Schwarz for many fruitful discussions which finally led to the successful realization of the project. Data have been collected using the seismic equipment of the GeoForschungsZentrum Potsdam. The data preparation and part of the computations were carried out using the facilities of the Computer Centres of the GFZ Potsdam and of the University of Karlsruhe. Drilling and explosion work was carried out under the supervision of C&E Consulting & Engineering GmbH Chemnitz. The search for suitable shotpoint locations was supported by many institutions and individuals. In particular, the help of the governmental forestry offices at Brandis (A1), Olbernhau (A2), Kleinbardau (A3), Flöha (A4), Heinrichsort (E), Luebnitz‐Forst (F), Saaldorf (G), Kronach (H) and for private properties the help of Mrs Vater (B), Mrs Seidel (C), Mr Thiemer (D) and Mr Bäuerle (I) in giving us permission to set off the explosions is gratefully acknowleded. Last but not least we would like to thank Luetgert (1992, MacRay) and Sandmeier & Liebhard (1993, Refra) for making valuable scientific software available for our study. The comments of H. Thybo and an anonymous reviewer helped to improve the manuscript. The project was funded through the priority program of the Deutsche Forschungs gemeinschaft ‘Orogenic processes—their quantification and simulation at the example of the Variscides’. Geophysical Institute Contribution Number 757.
References
