


Abstract
The expanding world population is expected to double the worldwide demand for food by 2050. Eighty-eight percent of countries currently face a serious burden of malnutrition, especially in Africa and south and southeast Asia. About 95% of the food energy needs of humans are fulfilled by just 30 species, of which wheat, maize, and rice provide the majority of calories. Therefore, to diversify and stabilize the global food supply, enhance agricultural productivity, and tackle malnutrition, greater use of neglected or underutilized local plants (so-called orphan crops, but also including a few plants of special significance to agriculture, agroforestry, and nutrition) could be a partial solution.
Here, we present draft genome information for five agriculturally, biologically, medicinally, and economically important underutilized plants native to Africa: Vigna subterranea, Lablab purpureus, Faidherbia albida, Sclerocarya birrea, and Moringa oleifera. Assembled genomes range in size from 217 to 654 Mb. In V. subterranea, L. purpureus, F. albida, S. birrea, and M. oleifera, we have predicted 31,707, 20,946, 28,979, 18,937, and 18,451 protein-coding genes, respectively. By further analyzing the expansion and contraction of selected gene families, we have characterized root nodule symbiosis genes, transcription factors, and starch biosynthesis-related genes in these genomes.
These genome data will be useful to identify and characterize agronomically important genes and understand their modes of action, enabling genomics-based, evolutionary studies, and breeding strategies to design faster, more focused, and predictable crop improvement programs.
Background
The world's population is expected to reach 9.8 billion by 2050. Ensuring a sustainable food supply to meet the energy and nutritional needs of the expanding population is one of the greatest global challenges [1]. Approximately 88% of countries currently face a serious burden of malnutrition [2]. To overcome this burgeoning food and nutritional challenge, the use of potential crop plants (both model and non-model) appears to be a better choice. Throughout history, humans have relied on an astonishing variety of plants for energy and nutrition; from 390,000 known plant species, around 5,000–7,000 have been cultivated or collected for food [1, 2]. However, in the present century, fewer than 150 species are commercially cultivated for food purposes, and just 30 species provide 95% of human food energy needs. More than half of the protein and calories we obtain from plants are acquired from just three “megacrops”: rice, wheat, and maize [3]. This narrow range of dietary diversity is partly a result of decades of intensive research focused on just a few species, which has successfully led to the production of high-yielding varieties of these major crops, usually cultivated under high-input agricultural systems. However, in some regions, we are now witnessing a drastic decrease in their yields, and the question has been raised as to whether rice and wheat (in particular) are currently making enough breeding progress to meet the challenge. All three megacrops are high-energy carbohydrate sources but are limited in protein content. Even if these crops can meet the energy requirement of the increasing world population, they cannot meet the nutritional requirement for active health by themselves [2].
To diversify the global food supply, enhance agricultural productivity, and tackle malnutrition, it is necessary to diversify and focus more on crop plants that are utilized in rural societies as a local source of nutrition and sustenance but have so far received little attention for crop improvement. These landraces (Traditional plant varieties) tend to be locally adapted and can often provide a rich source of nutrition, yet they have largely been ignored by modern interventions. The goal of the African Orphan Crops Consortium [4], an international public–private partnership, is to sequence, assemble, and annotate the genomes of 101 plants that contribute to traditional African food supplies by 2020. These neglected or orphan plants have been seldom studied by scientists but are of major importance in many African countries. They are usually grown by smallholder farmers, either for consumption or local sale, and are a major food source for 600 million rural Africans [5, 6]. In this study, we sequenced and assembled draft genomes of five African orphan plant species (Fig. 1), which are highly important to augment food and nutritional security in Africa.
![Phylogenetic and evolutionary analysis. Values at branch points indicate estimates of divergence time (million years ago [Mya]); blue numbers show divergence time (Mya); red nodes indicate previously published calibration times. V. sub shows seeds of Vigna subterranea; L. pur, flowers of Lablab purpureus; F. alb, seed pods of Faidherbia albida; S. bir, fruit of Sclerocarya birrea; andM. ole, flowers of Moringa oleifera. Scale bar = 10 million years.](https://oup.silverchair-cdn.com/oup/backfile/Content_public/Journal/gigascience/8/3/10.1093_gigascience_giy152/4/m_gigascience_8_3_giy152_f1.jpeg?Expires=1750261116&Signature=jHQMFc~tLrkMWaL2SV25~Q0KS~AsRFG1YnauTfLUxuKEDZYOgMoG3~wkazkliNN-HpHrUaLjbt~fxbvg3aYGT8SjYOctDzXybcJ23sHXQ74cck2U2Gendnc6rPPeGwCOxiQYBZ9UbJ1MA4BmPIqbvw3fCkWopKYQs9E70PKKu9W5WoZFa9nZCcUC46RSTd0yufijUIMf0V1rFOa9VYzuaI~4OlRmxGU4d-8xzc57kwq4UfRVpNeTd4dPtnpkIN2PVy2FHTv11SLFsxojeS89~X9YEUIEnL-nQIXRu6WfyY0Z83XodI4K39RPw764RU5xSRcYgEni3OLKmQQmT7THWA__&Key-Pair-Id=APKAIE5G5CRDK6RD3PGA)
Phylogenetic and evolutionary analysis. Values at branch points indicate estimates of divergence time (million years ago [Mya]); blue numbers show divergence time (Mya); red nodes indicate previously published calibration times. V. sub shows seeds of Vigna subterranea; L. pur, flowers of Lablab purpureus; F. alb, seed pods of Faidherbia albida; S. bir, fruit of Sclerocarya birrea; andM. ole, flowers of Moringa oleifera. Scale bar = 10 million years.
Vigna subterranea (Bambara groundnut; National Center for Biotechnology Information [NCBI]: txid115715), belonging to the Fabaceae family, is a leguminous plant species that originated in West Africa and is cultivated in sub-Saharan areas, particularly Nigeria [7, 8]. With good nitrogen-fixing ability and drought tolerance, on average the seeds contain 63% carbohydrate, 19% protein, and 6.5% fat, thereby making bambara groundnut a complete food. Approximately 165,000 tons of this species are produced in Africa each year, but yields are low because efforts to improve Bambara have been neglected for many years [9]. The genomes of mung bean and adzuki bean, which also belong to the Vigna genus, have been published [10, 11].
Moringa oleifera (Moringa; NCBI: txid3735) is a highly nutritious, fast-growing, and drought-tolerant tree that is indigenous to northern India, Pakistan, and Nepal [12]. Presently, this species is ubiquitously distributed throughout tropical and subtropical countries, and in particular, covers the major agro-ecological region in Nigeria. The leaves are rich in protein, minerals, beta-carotene, and antioxidant compounds, which are generally used as nutritional supplements and in traditional medicine. The seeds are used to extract oil, and seed powder can be used for water purification [13, 14]. There are varying reports of Moringa production. India is the largest producer of Moringa with an annual production of 1.1–1.3 million tons of tender fruits from an area of 38,000 ha. In Limpompo province, Moringa is cultivated in relatively small areas (0.25–1 hectares), with seed yields of 50–100 kg/ha [15]. Prior to this study, a draft genome of M. oleifera from Yunnan (China) was reported [16], which estimated a similar genome assembly size and gene numbers to our version.
Lablab purpureus (Dolichos bean or hyacinth bean; NCBI: txid35936), a member of the Fabaceae family, is one of the most ancient (>3,500 years) domesticated and multipurpose legume species, which is used as an intercrop in livestock systems. Although it has large agromorphological diversity in south Asia, its origin appears to be African [17]. It is rich in protein, has good nitrogen-fixing ability, and is highly adaptable to diverse environmental conditions [18]. Limited production data are available, suggesting that yields are low. In southwestern parts of Bangladesh, Lablab is reported to have a total production area of approximately 48,000 hectares [17]. In other areas, it has a similarly relatively low production area; e.g., Kenya, approximately 10,000 hectares [19] and Karnataka, India, 79,000 hectares [20].
Faidherbia albida (apple-ring acacia; NCBI: txid138055) is the only tree species in the Faidherbia genus (Fabaceae). Its distinctive key features, such as reverse phenology (leaves grow in the long, dry season and shed during the rainy season) and nitrogen-fixing ability, mean that F. albida has been planted as a key agroforestry species in traditional African farming systems for hundreds of years [21]. It originated in the Sahara or eastern and southern Africa, then spread across semi-arid tropical Africa, and later to the Middle East and Arabia. Estimates suggest that during the last decade, the tree was cultivated over an area of 300,000 hectares [22]. Average pod production ranges from 6–135 kg per tree per year in the Sudanian zone. In Mana Pools, Zimbabwe, two trees averaged 161 kg per tree in one year [23]. This yield per unit area is about 2,000–3,000 kg/ha, assuming a density of ~20 mature trees per hectare [24].
Sclerocarya birrea (Marula; NCBI: txid289766) belongs to the Anacardiaceae family and is a traditional fruit tree found in southern Africa, mostly south of the Zambezi river [25]. Fruits are eaten fresh or are used to produce juices and wine, which has substantial socioeconomic and commercialization importance. The seeds of the fruits are rich in nutrition and oil content (56%) and are often consumed raw. It is estimated that the total value of the commercial marula trade is worth USD $160,000 per year to rural communities [26], with values per tree ranging from 315 kg (17,500 fruits) to 1,643 kg (91,300 fruits) [26, 27]. A survey in north-central Namibia showed that, on average, there are 5.33 farms per household, with a total of 13,278 fruiting trees.
Considering the limited systematic efforts to improve the breeding of these understudied tropical crops to date, making their genomic data available will provide much-needed impetus to conduct basic and applied translational research to improve and develop them as important, sustainably cultivated food crops. These efforts will be vital for directly or indirectly improving nutrition for the increasing urban populations in the regions where these crops are grown.
Data Description
Sample collection, library construction, and sequencing
Genomic DNA was extracted either from a tree (F. albida, M. oleifera) or from nursery plantlets (V. subtarranea, L. purpureus, S. birrea) grown at the World AgroForestry Center campus in Kenya using a modified Cetyl TrimethylAmmonium Bromide (CTAB) method [28].
Extracted DNA was used to construct paired-end libraries (insert size ranging from 170 to 800 bp) and mate-pair libraries (insert size >2 kb) following Illumina (San Diego, CA) protocols. Subsequently, sequencing was performed on a HiSeq 2000 platform (Illumina) using a shotgun sequencing strategy to generate more than 100 Gb raw data for each species (see Additional file 1: Table S1). Data were filtered using SOAPfilter (v2.2) [29] as follows: (1) small insert size reads were discarded; (2) Polymerase Chain Reaction (PCR) duplicates and adapter contamination were discarded; (3) reads with ≥30% low-quality bases (quality score ≤15) were removed; (4) bases of low quality were trimmed from each end of the reads; and (5) reads with ≥10% uncalled (“N”) bases were removed. At the end, more than 100 × high-quality reads were obtained for each species according to their estimated genome size (see Additional file 1: Table S1).
RNA for transcriptome sequencing was extracted from different tissues of V. subterranea, L. purpureus, F. albida, and M. oleifera. The RNA was extracted using the PureLink RNA Mini Kit (Thermo Fisher Scientific, Carlsbad, CA) according to the manufacturer's instructions. For each sample, RNA libraries were constructed by following the TruSeq RNA Sample Preparation Kit (Illumina) manual and were then sequenced on the Illumina HiSeq 2500 platform (paired-end, 100-bp reads), generating ~36 Gb of sequence data for each species. Data were then filtered using a similar method to that used in DNA filtration, with a slight modification: (1) reads with ≥10% low-quality bases (quality score ≤15) were removed and (2) reads with ≥5% uncalled (“N”) bases were removed (see Additional file 1: Table S2). All the transcriptome data from different tissues were compiled, and the combined version was used to check the completeness of the whole-genome sequence assembly.
Evaluation of genome size
where Num represents the read number of reads used, Len represents the read length, K represents the k-mer length, and K_Dep refers to where the main peak is located in the distribution curve [30].
k-mer distributions of F. albida, S. birrea, and M. oleifera showed two distinct peaks (see Additional file 1: Fig. S1), where the second peak was confirmed as the main one for each of the species. The genome sizes of V. subterranea, L. purpureus, F. albida, S. birrea, and M. oleifera were predicted as 550, 423, 661, 356, and 278 Mb, respectively (see Additional file 1: Table S3).
De novo genome assembly
For de novo genome assembly, SOAPdenovo2 (SOAPdenovo2, RRID:SCR_014986) [29] was used for constructing contigs, followed by scaffolding, and finally gap filling. To build contigs, libraries ranging from 170 to 800 bp were used to construct de Bruijn graphs with the parameters “pregraph –d 2 –K 55,” and contigs were subsequently formed with the parameters “contig –g –D 1” to delete links with low coverage. In the scaffolding step, paired-end and mate-pair information was used to order the contigs with parameters “scaff –g –F” and “map –g –k 55.” Finally, to fill the gaps within scaffolds, GapCloser version 1.12 (GapCloser, RRID:SCR_015026) [29] was used with the parameters “–l 150 –t 32” using the pair-end libraries. Finally, total assembled lengths of 535.05, 395.47, 653.73, 330.98, and 216.76 Mb were obtained for V. subterranea, L. purpureus, F. albida, S. birrea, and M. oleifera genomes, respectively (Table 1). This accounted for approximately 97.3%, 93.5%, 98.9%, 92.9%, and 77.9% of their respective estimated genome sizes.
Statistical analysis of the final de novo genome assembly of Vigna subterranea, Lablab purpureus, Faidherbia albida, Sclerocarya birrea, and Moringa oleifera
| Parameter | V. subterranea | L. purpureus | F. albida | S. birrea | M. oleifera | ||||||
|---|---|---|---|---|---|---|---|---|---|---|---|
| Contig | Scaffold | Contig | Scaffold | Contig | Scaffold | Contig | Scaffold | Contig | Scaffold | ||
| Length (bp) | N90 | 3,804 | 75,271 | 785 | 860 | 8,254 | 95,167 | 3,661 | 21,833 | 6,676 | 57,837 |
| N80 | 7,872 | 197,296 | 8,009 | 61,348 | 16,321 | 251,730 | 7,649 | 82,385 | 16,503 | 241,828 | |
| N70 | 11,464 | 325,826 | 16,144 | 205,392 | 24,165 | 380,587 | 11,885 | 155,416 | 25,754 | 441,152 | |
| N60 | 15,122 | 474,616 | 24,010 | 359,168 | 32,440 | 534,880 | 16,393 | 243,236 | 35,081 | 644,014 | |
| N50 | 19,154 | 640,666 | 32,223 | 621,373 | 42,029 | 692,039 | 21,349 | 335,449 | 45,268 | 957,246 | |
| N40 | 23,828 | 865,081 | 42,690 | 950,808 | 53,479 | 881,230 | 26,914 | 485,585 | 58,406 | 1,446,587 | |
| N30 | 29,382 | 1,133,817 | 54,401 | 1,489,002 | 69,167 | 1,197,388 | 33,914 | 705,409 | 74,710 | 1,878,891 | |
| N20 | 36,928 | 1,503,436 | 70,790 | 1,971,744 | 92,147 | 1,501,241 | 43,984 | 1,098,843 | 96,626 | 2,565,629 | |
| N10 | 49,695 | 2,049,645 | 95,643 | 2,606,483 | 139,388 | 1,925,526 | 62,875 | 2,089,533 | 136,952 | 3,296,678 | |
| Number | N90 | 29,245 | 1,087 | 26,272 | 9,409 | 16,834 | 1,132 | 17,585 | 1,537 | 5,524 | 366 |
| N80 | 20,188 | 664 | 9,869 | 715 | 11,420 | 727 | 11,678 | 787 | 3,574 | 191 | |
| N70 | 14,829 | 453 | 6,576 | 366 | 8,198 | 514 | 8,313 | 499 | 2,542 | 125 | |
| N60 | 10,943 | 315 | 4,630 | 222 | 5,898 | 370 | 6,001 | 332 | 1,833 | 84 | |
| N50 | 7,932 | 220 | 3,244 | 138 | 4,151 | 263 | 4,277 | 214 | 1,295 | 56 | |
| N40 | 5,532 | 147 | 2,204 | 86 | 2,791 | 179 | 2,929 | 131 | 876 | 37 | |
| N30 | 3,590 | 93 | 1,403 | 52 | 1,728 | 114 | 1,857 | 74 | 553 | 24 | |
| N20 | 2,024 | 52 | 776 | 29 | 912 | 64 | 1,012 | 36 | 300 | 13 | |
| N10 | 806 | 22 | 306 | 12 | 326 | 26 | 387 | 12 | 112 | 6 | |
| Maximum length | 148,612 | 3,684,321 | 240,194 | 5,699,750 | 529,842 | 4,746,824 | 227,874 | 5,850,796 | 449,426 | 4,637,711 | |
| Total length | 512,516,846 | 535,052,523 | 385,303,786 | 395,472,305 | 644,456,383 | 653,726,905 | 322,977,033 | 330,983,508 | 213,739,255 | 216,759,177 | |
| Total number ≥100 bp | 104,575 | 65,586 | 135,039 | 118,976 | 75,572 | 51,470 | 64,158 | 40,280 | 29,972 | 22,329 | |
| Total number ≥2,000 bp | 35,465 | 2,920 | 15,984 | 4,265 | 26,459 | 5,758 | 22,172 | 4,852 | 8,300 | 2,166 | |
| N content (%) | 4.21 | 2.57 | 1.42 | 2.42 | 1.39 | ||||||
Genome evaluation
Genome assembly completeness was assessed with Benchmarking Universal Single-Copy Orthologs (BUSCO) version 3.0.1 (BUSCO, RRID:SCR_015008) [31]. From the 1,440 core embryophyta genes, 1,326 (92.1%), 1,341 (93.2%), 1,315 (91.3%), 1,384 (96.1%), and 1,297 (90.1%) were identified in the V. subterranea, L. purpureus, F. albida, S. birrea, and M. oleifera assemblies, respectively, with 1,244 (86.4%), 1,258 (87.4%), 1,231 (85.5%), 1,352 (93.9%), and 1,278 (88.8%) genes, respectively, being complete (Table 2).
Completeness evaluation of genome assembly using BUSCO database in five species
| BUSCO | Vigna subterranea | Lablab purpureus | Faidherbia albida | Sclerocarya birrea | Moringa oleifera | |||||
|---|---|---|---|---|---|---|---|---|---|---|
| N | % | N | % | N | % | N | % | N | % | |
| Complete single copy | 1,244 | 86.39 | 1,258 | 87.40 | 1,231 | 85.50 | 1,352 | 93.90 | 1,278 | 88.80 |
| Complete duplicated | 82 | 5.69 | 83 | 5.80 | 84 | 5.80 | 32 | 2.20 | 19 | 1.30 |
| Fragmented | 28 | 1.94 | 20 | 1.40 | 34 | 2.40 | 21 | 1.50 | 23 | 1.60 |
| Missing | 86 | 5.97 | 79 | 5.40 | 91 | 6.30 | 35 | 2.40 | 120 | 8.30 |
| Total | 1,440 | 100 | 1,440 | 100 | 1,440 | 100 | 1,440 | 100 | 1,440 | 100 |
Abbreviation: BUSCO, Benchmarking Universal Single-Copy Orthologs; N, number
To evaluate the completeness of genes in the assemblies, unigenes were generated from the transcript data of each species using Bridger software with the parameters “–kmer_length 25 –min_kmer_coverage 2” [32] and then aligned to the corresponding assembly using Basic Local Alignment Search Tool (BLAST)-like alignment tool (BLAT, RRID:SCR_011919) [33]. The results indicated that each of the assemblies covered about 90% of the expressed unigenes, suggesting that the assembled genomes contained a high percentage of expressed genes (Table 3).
Gene coverage of candidate species based on transcriptome data
| Species | Dataset | Number | Total length (bp) | Base coverage by assembly (%) | Sequence coverage by assembly (%) |
|---|---|---|---|---|---|
| Vigna subterranea | All | 116,223 | 161,077,155 | 89.61 | 98.21 |
| >200 bp | 116,223 | 161,077,155 | 89.61 | 98.21 | |
| >500 bp | 72,139 | 147,068,299 | 89.03 | 98.00 | |
| >1,000 bp | 47,952 | 129,884,929 | 88.33 | 97.52 | |
| Lablab purpureus | All | 86,867 | 80,837,182 | 93.59 | 99.25 |
| >200 bp | 86,867 | 80,837,182 | 93.59 | 99.25 | |
| >500 bp | 41,252 | 66,764,786 | 92.94 | 99.18 | |
| >1,000 bp | 24,627 | 55,074,989 | 92.32 | 99.02 | |
| Faidherbia albida | All | 50,294 | 46,650,067 | 93.62 | 98.85 |
| >200 bp | 50,294 | 46,650,067 | 93.62 | 98.85 | |
| >500 bp | 26,352 | 39,282,694 | 93.32 | 99.05 | |
| >1,000 bp | 15,569 | 31,560,858 | 92.78 | 98.95 | |
| Moringaoleifera | All | 60,964 | 57,114,636 | 88.98 | 92.16 |
| >200 bp | 60,964 | 57,114,636 | 88.98 | 92.16 | |
| >500 bp | 29,581 | 47,523,018 | 88.85 | 92.69 | |
| >1,000 bp | 18,322 | 39,528,310 | 88.70 | 92.99 |
To confirm the accuracy of the assemblies, some of the paired-end libraries were mapped to the genome assemblies, and the sequencing coverage was calculated using SOAPaligner, version 2.21 (SOAPaligner/soap2, RRID:SCR_005503) [34]. Sequencing coverage showed that >99% of the bases had a sequencing depth of more than 10× and confirmed the accuracy at the base level (see Additional file 1: Fig. S2). GC content and average depth were also calculated with 10 kb non-overlapping windows. The distribution of GC content indicated a relatively pure single genome without contamination or GC bias (see Additional file 1: Fig. S3). The GC content of each sequenced genome was also compared with that of a related species. As expected, close peak positions showed that the related species were similar in GC content (see Additional file 1: Fig. S4).
Repeat annotation
Repetitive sequences were identified using RepeatMasker (version 4.0.5) [35], with a combined Repbase and a custom library obtained through careful self-training. The custom library comprised three parts: MITEs (miniature inverted repeat transposable elements), LTRs (long terminal repeats), and an extensive library that was constructed as follows. First, the annotated MITE library was created using MITE-hunter [36] with default parameters. Then, a library of LTR elements with lengths of 1.5–25 kb and two libraries of terminal repeats ranging from 100 to 6,000 bp with ≥85% similarity were constructed using LTRharvest [37] integrated in Genometools (version 1.5.8) [38] with parameters “–minlenltr 100, –maxlenltr 6000, –mindistltr 1500, –maxdistltr 25000, –mintsd 5, –maxtsd 5, –similar 90, –vic 10.” Subsequently, we used several strategies to filter the candidates, i.e., (1) presence of intact poly purine tracts or primer binding sites [39] using the eukaryotic tRNA library [40]; (2) removal of contamination from local gene clusters and tandem local repeats by inspecting 50 bases of the upstream and downstream LTR flanks using multiple sequence comparison by log-expectation (MUSCLE, RRID:SCR_011812) [41] for a minimum of 60% identity; and (3) removal of nested LTR candidates from other types of the elements. Exemplars for the LTR library were extracted from the filtered candidates using a cutoff of 80% identity in 90% of the sequence. Regions of the genome annotated as LTRs and MITEs were masked and then put into RepeatModeler (version 1-0-8; RepeatModeler, RRID:SCR_015027) to predict other repetitive sequences for the extensive library. Finally, the MITE, LTR, and extensive libraries were integrated into the custom library, which was combined with the Repbase library and taken as an input for RepeatMasker to identify and classify genome-wide repetitive elements. The pipeline identified 205,189,285 (38.35% of the genome length), 147,050,327 (37.18%), 358,653,534 (54.86%), 149,551,125 (45.18%), and 87,944,150 (40.57%) bases of non-redundant repetitive sequences in V. subterranea, L. purpureus, F. albida, S. birrea, and M. oleifera, respectively. LTR elements were predominant, taking up 19.8%, 23.8%, 44.6%, 38.8%, and 22.7% of each genome, respectively (Table 4).
Proportion of different classes of repeats (%) in five species
| Repeat type | Vigna subterranea | Lablab purpureus | Faidherbia albida | Sclerocarya birrea | Moringa oleifera | |||||
|---|---|---|---|---|---|---|---|---|---|---|
| % in genome | Length (bp) | % in genome | Length (bp) | % in genome | Length (bp) | % in genome | Length (bp) | %in genome | Length (bp) | |
| SINE | 0 | 313 | 0.005 | 19,444 | < 0.01 | 1,966 | 0.02 | 69,836 | 0.11 | 248,569 |
| LINE | 0.25 | 1,387,567 | 0.45 | 1,784,785 | 0.91 | 6,003,271 | 0.19 | 647,579 | 1.83 | 3,970,802 |
| LTR | 19.77 | 105,828,735 | 23.78 | 94,062,428 | 44.65 | 291,901,514 | 38.78 | 128,362,381 | 22.69 | 49,200,625 |
| DNA | 7.15 | 38,294,871 | 4.76 | 18,851,402 | 4 | 26,164,519 | 1.76 | 5,829,982 | 5.81 | 12,599,607 |
| Satellite | 0.01 | 71,679 | 0.02 | 107,451 | 0.01 | 110,749 | 0 | 18,597 | 0.74 | 1,623,399 |
| Simple repeat | 0.35 | 1,922,719 | 0.2 | 821,773 | 0.04 | 308,481 | 0.04 | 153,135 | 0.29 | 630,662 |
| Others | 11.94 | 63,926,350 | 8.95 | 35,400,400 | 6.48 | 42,426,306 | 5.11 | 16,918,179 | 10.35 | 22,439,026 |
| Total | 38.35 | 205,189,285 | 37.18 | 147,050,327 | 54.86 | 358,653,534 | 45.18 | 149,551,125 | 40.57 | 87,944,150 |
Abbreviations: bp, base pairs; LINE, long interspersed nuclear element; LTR, long terminal repeats; SINE, short interspersed nuclear element.
Gene prediction
Repetitive regions of the genome were masked before gene prediction. Structures of protein-coding genes were predicted using the MAKER-P pipeline (version 2.31) [42] based on RNA, homologous, and de novo prediction evidence. For RNA evidence, the clean transcriptome reads were assembled into inchworms using Trinity (version 2.0.6) [43] and then provided to MAKER-P as expressed sequence tag evidence. For homologous comparison, protein sequences from the model plant Arabidopsis thaliana and related species of each sequenced species were downloaded and provided as protein evidence. Related species used for homologous evidence were Arachis duranensis, A. ipaensis, Glycine max, Lotus japonicus, Medicago truncatula, and Vigna angularis for V. subterranea; A. duranensis, Cajanus cajan, G. max, M. truncatula, Phaseolus vulgaris, and V. angularis for L. purpureus; C. cajan, V. angularis, L. japonicus, P. vulgaris, M. truncatula, and G. max for F. albida; Actinidia chinensis and Musa acuminata for S. birrea; and G. max, Oryza sativa, Populus trichocarpa, and Sorghum bicolor for M. oleifera.
For de novo prediction evidence, a series of training sets was made to optimize different ab initio gene predictors. Initially, a set of transcripts was generated by a genome-guided approach using Trinity with the parameters “–full_cleanup, –jaccard_clip, –genome_guided_max_intron 10000, –min_contig_length 200.” The transcripts were then mapped back to the genome using PASA (version 2.0.2) [44], and a set of gene models with real gene characteristics (e.g., size and number of exons/introns per gene, features of splicing sites) was generated. Complete gene models were picked for training Augustus [45]. Genemark-ES (version 4.21) [46] was self-trained with default parameters. The first round of MAKER-P was run based on the evidence as above, with default parameters except “est2genome” and “protein2genome” being set to “1,” yielding only RNA and protein-supported gene models. SNAP [47] was then trained with these gene models. Default parameters were used to run the second and final rounds of MAKER-P, producing the final gene models.
The number of protein-coding genes identified in each species was 31,707 in V. subterranea, 20,946 in L. purpureus, 28,979 in F. albida, 18,937 in S. birrea, and 18,451 in M. oleifera. Compared to the other sequenced species in the same genus [10, 11], V. subterranea has more genes than mung bean (22,427) but fewer than adzuki bean (34,183). Various gene structure parameters were compared to the related species of each sequenced genome, as summarized in Table 5 and Additional file 1: Fig. S5. BUSCO evaluation showed that at least 85% of 1,440 core genes could be identified across all the species, suggesting an acceptable quality of gene annotation for the five sequenced genomes (see Additional file 1: Table S4).
Gene structure parameters of Vigna subterranea, Lablab purpureus, Faidherbia albida, Medicago truncatula, Glycine max, Sclerocarya birrea, Moringa oleifera, Carica papaya, Theobroma cacao, and Citrus sinensis
| Species | Protein-coding gene number | Mean gene length (bp) | Mean coding sequence length (bp) | Mean exons per gene | Mean exon length (bp) | Mean intron length (bp) |
|---|---|---|---|---|---|---|
| V. subterranea | 31,707 | 3,287 | 1,163 | 5 | 222 | 501 |
| L. purpureus | 20,946 | 3,696 | 1,276 | 5 | 239 | 557 |
| F. albida | 28,979 | 3,396 | 1,207 | 5 | 226 | 504 |
| M. truncatula | 50,358 | 2,334 | 986 | 4 | 243 | 440 |
| G. max | 55,137 | 3,144 | 1,169 | 5 | 232 | 488 |
| S. birrea | 18,937 | 3,561 | 1,343 | 6 | 239 | 479 |
| M. oleifera | 18,451 | 3,308 | 1,238 | 5 | 232 | 478 |
| C. papaya | 24,107 | 2,531 | 962 | 4 | 223 | 473 |
| T. cacao | 41,951 | 3,684 | 1,323 | 6 | 223 | 479 |
| C. sinensis | 35,182 | 3,797 | 1,424 | 6 | 237 | 475 |
Non-coding RNA genes in the sequenced genomes were also annotated. Using BLAST, ribosomal RNA (rRNA) genes were searched against the A. thaliana rRNA database or by searching for microRNAs (miRNA) and small nuclear RNA (snRNA) against the Rfam database (Rfam, RRID:SCR_004276; release 12.0) [48]. tRNAscan-SE (tRNAscan-SE, RRID:SCR_010835) was also used to scan for tRNAs [49]. The results are summarized in Table 6.
Annotation of non-coding RNA genes in the genomes of Vigna subterranea, Lablab purpureus, Faidherbia albida, Sclerocarya birrea, and Moringa oleifera
| Species | Type | Copy | Average length (bp) | Total length (bp) | % of genome | |
|---|---|---|---|---|---|---|
| miRNA | 102 | 122 | 12,466 | 0.002330 | ||
| tRNA | 756 | 75 | 56,639 | 0.010586 | ||
| rRNA | rRNA | 1,080 | 124 | 134,185 | 0.025079 | |
| 18S | 55 | 560 | 30,798 | 0.005756 | ||
| 28S | 62 | 126 | 7,793 | 0.001456 | ||
| V. subterranea | 5.8S | 17 | 124 | 2,110 | 0.000394 | |
| 5S | 946 | 99 | 93,484 | 0.017472 | ||
| snRNA | snRNA | 523 | 117 | 61,006 | 0.011402 | |
| CD-box | 327 | 100 | 32,643 | 0.006101 | ||
| HACA-box | 47 | 133 | 6,236 | 0.001165 | ||
| splicing | 149 | 149 | 22,127 | 0.004135 | ||
| miRNA | 109 | 123 | 13,398 | 0.003388 | ||
| tRNA | 611 | 75 | 45,748 | 0.011568 | ||
| rRNA | rRNA | 633 | 227 | 143,466 | 0.036277 | |
| 18S | 213 | 446 | 95,074 | 0.024041 | ||
| 28S | 283 | 121 | 34,186 | 0.008644 | ||
| L. purpureus | 5.8S | 53 | 135 | 7,177 | 0.001815 | |
| 5S | 84 | 84 | 7,029 | 0.001777 | ||
| snRNA | snRNA | 457 | 118 | 54,029 | 0.013662 | |
| CD-box | 278 | 97 | 26,915 | 0.006806 | ||
| HACA-box | 48 | 133 | 6,371 | 0.001611 | ||
| splicing | 131 | 158 | 20,743 | 0.005245 | ||
| miRNA | 126 | 122 | 15,364 | 0.002350 | ||
| tRNA | 458 | 75 | 34,388 | 0.005260 | ||
| rRNA | rRNA | 1,008 | 107 | 107,518 | 0.016447 | |
| 18S | 25 | 321 | 8,034 | 0.001229 | ||
| 28S | 26 | 118 | 3,063 | 0.000469 | ||
| F. albida | 5.8S | 6 | 118 | 710 | 0.000109 | |
| 5S | 951 | 101 | 95,711 | 0.014641 | ||
| snRNA | snRNA | 1,996 | 108 | 216,482 | 0.033115 | |
| CD-box | 1,836 | 106 | 194,676 | 0.029779 | ||
| HACA-box | 42 | 132 | 5,548 | 0.000849 | ||
| splicing | 118 | 138 | 16,258 | 0.002487 | ||
| miRNA | 106 | 122 | 12,899 | 0.003897 | ||
| tRNA | 564 | 75 | 42,181 | 0.012744 | ||
| rRNA | rRNA | 313 | 142 | 44,378 | 0.013408 | |
| 18S | 80 | 240 | 19,239 | 0.005813 | ||
| 28S | 57 | 113 | 6,460 | 0.001952 | ||
| S. birrea | 5.8S | 16 | 103 | 1,644 | 0.000497 | |
| 5S | 160 | 106 | 17,035 | 0.005147 | ||
| snRNA | snRNA | 841 | 115 | 96,517 | 0.029161 | |
| CD-box | 638 | 105 | 67,216 | 0.020308 | ||
| HACA-box | 34 | 124 | 4,217 | 0.001274 | ||
| splicing | 169 | 148 | 25,084 | 0.007579 | ||
| miRNA | 111 | 119 | 13,161 | 0.006072 | ||
| tRNA | 1,241 | 75 | 93,620 | 0.043191 | ||
| rRNA | rRNA | 8,406 | 309 | 2,598,079 | 1.198602 | |
| 18S | 3,256 | 608 | 1,979,080 | 0.913032 | ||
| 28S | 3,808 | 113 | 430,280 | 0.198506 | ||
| M. oleifera | 5.8S | 1,182 | 150 | 177,612 | 0.08194 | |
| 5S | 160 | 69 | 11,107 | 0.005124 | ||
| snRNA | snRNA | 229 | 119 | 27,158 | 0.012529 | |
| CD-box | 119 | 97 | 11,578 | 0.005341 | ||
| HACA-box | 38 | 132 | 4,999 | 0.002306 | ||
| splicing | 72 | 147 | 10,581 | 0.004881 |
Functional annotation of protein-coding genes
Functional annotation of protein-coding genes was based on sequence similarity and domain conservation by aligning predicted amino acid sequences to public databases. Protein-coding genes were first searched against protein sequence databases, such as the Kyoto Encyclopedia of Genes and Genomes (KEGG, RRID:SCR_012773) [50], the National Center for Biotechnology Information (NCBI) non-redundant (NR) and the Clusters of Orthologous Groups (COGs) databases [51], SwissProt, and TrEMBL [52], for best matches using BLASTP with an E-value cutoff of 1e-5. Then, InterProScan 55.0 (InterProScan, RRID:SCR_005829) [53] was used to identify domains and motifs based on Pfam (Pfam, RRID:SCR_004726) [54], SMART (SMART, RRID:SCR_005026) [55], PANTHER (PANTHER, RRID:SCR_004869) [56], PRINTS (PRINTS, RRID:SCR_003412) [57], and ProDom (ProDom, RRID:SCR_006969) [58]. In total, 98.0%, 98.2%, 93.6%, 98.1%, and 98.8% of genes in V. subterranea, L. purpureus, F. albida, S.birrea, and M. oleifera, respectively, were functionally annotated. Of the unannotated genes, 400, 305, 1,514, 293, and 172 were specific to V. subterranea, L. purpureus, F. albida, S. birrea, and M. oleifera, respectively (Table 7).
Statistical analysis of the functional annotations of protein-coding genes in the genomes of Vigna subterranea, Lablab purpureus, Faidherbia albida, Sclerocarya birrea, and Moringa oleifera
| Database | V. subterranea | L. purpureus | F. albida | S. birrea | M. oleifera | |||||
|---|---|---|---|---|---|---|---|---|---|---|
| N | % | N | % | N | % | N | % | N | % | |
| NR | 31,013 | 97.81 | 20,540 | 98.06 | 27,021 | 93.24 | 18,547 | 97.94 | 18,203 | 98.65 |
| SwissProt | 22,496 | 70.95 | 15,905 | 75.93 | 21,247 | 73.32 | 15,513 | 81.92 | 15,109 | 81.88 |
| KEGG | 22,141 | 69.83 | 14,699 | 70.18 | 20,184 | 69.65 | 14,623 | 77.22 | 14,044 | 76.11 |
| COG | 10,814 | 34.11 | 7,854 | 37.50 | 10,526 | 36.32 | 7,715 | 40.74 | 7,662 | 41.52 |
| TrEMBL | 30,964 | 97.66 | 20,489 | 97.82 | 26,828 | 92.58 | 18,477 | 97.57 | 18,193 | 98.60 |
| InterPro | 22,744 | 71.73 | 18,911 | 90.28 | 25,401 | 87.65 | 15,537 | 82.05 | 15,134 | 82.02 |
| Gene Ontology | 18,894 | 59.59 | 13,811 | 65.94 | 15,182 | 52.39 | 11,505 | 60.75 | 11,877 | 64.37 |
| Overall | 31,074 | 98.00 | 20,574 | 98.22 | 27,118 | 93.58 | 18,573 | 98.08 | 18,236 | 98.83 |
| Unannotated | 633 | 2.00 | 372 | 1.78 | 1,861 | 6.86 | 364 | 1.92 | 216 | 1.17 |
Gene family construction
Protein and nucleotide sequences from the five sequenced species and nine other species (A. thaliana, Carica papaya, Citrus sinensis, G. max, M. truncatula, O. sativa, P. vulgaris, S. bicolor, and Theobroma cacao) were retrieved to construct gene families using OrthoMCL software [59] based on an all-versus-all BLASTP alignment with an E-value cutoff of 1e-5. A total of 609, 104, 499, 205, and 150 gene families were found specific to V. subterranea, L. purpureus, F. albida, S. birrea, and M. oleifera, respectively (see Additional file 1: Table S5).
Furthermore, the 10,103 gene families of V. subterranea, L. purpureus, F. albida, M. truncatula, and G. max were clustered (Fig. 2A). There were 1,105 orthologous families shared by the four Papilionoideae species, while 808 gene families containing 1,966 genes were specific to F. albida, 281 gene families containing 538 genes were specific to L. purpureus, and 789 gene families containing 3,118 genes were specific to V. subterranea.
![The groups of orthologs shared by the orphan crops. (A) Groups of orthologs shared between Lablab purpureus (L. pur), Faidherbia albida (F. alb), Glycine max (G. max), Medicago truncatula (M. tru), and Vigna subterranea (V. sub). (B) Groups of orthologs shared between Sclerocarya birrea (S. bir), Moringa oleifera (M. ole), Carica papaya (C. pap), Citrus sinensis (C. sin), and Theobroma cacao (T. cac). Venn diagram generated using [60].](https://oup.silverchair-cdn.com/oup/backfile/Content_public/Journal/gigascience/8/3/10.1093_gigascience_giy152/4/m_gigascience_8_3_giy152_f2.jpeg?Expires=1750261116&Signature=fyDl5zXuGDychvhklxtgU4ylRl9DBOMevlcovfO-6Bp1xsWiOKUvsbHb-euMPrB8VStjcqzDsmrBfDAIqmhvfMwJaxquWnO6u3FPDRUB8r~-wJSYPXQPGJUZl3xtp5PjATkFhVYaZwfmUwJ~haD7XrYmp9~G2glD7tz4Fbh9EF0ppUPAVCw0Lv9vMngh2OA7YBbUZOlwtYqzLkZ675gnNV47Fw0vpEXCsGqwMMAp4342Lb4CDfAdvHiRG~alPFoa1XTv~fUm6dC-NUjOD9Dk6DeKtlZN8T1gL6qJp14JAQxGRDDzihFz0IdwiMcva31jyUpqxaAk~z5EFnX0nA4k6g__&Key-Pair-Id=APKAIE5G5CRDK6RD3PGA)
The groups of orthologs shared by the orphan crops. (A) Groups of orthologs shared between Lablab purpureus (L. pur), Faidherbia albida (F. alb), Glycine max (G. max), Medicago truncatula (M. tru), and Vigna subterranea (V. sub). (B) Groups of orthologs shared between Sclerocarya birrea (S. bir), Moringa oleifera (M. ole), Carica papaya (C. pap), Citrus sinensis (C. sin), and Theobroma cacao (T. cac). Venn diagram generated using [60].
Moreover, 8,184 gene families of S. birrea, M. oleifera, C. papaya, C. sinensis, and T. cacao were clustered (Fig. 2B), of which 365 gene families containing 798 genes were specific to M. oleifera and 362 gene families containing 796 genes were specific to S. birrea. KEGG pathway enrichment analysis of paralog genes was also conducted (Additional file 1: Tables S6, S7). Functional annotation revealed that in V. subterranea, these paralogs corresponded mainly with carbon fixation, zeatin biosynthesis, and glyoxylate and dicarboxylate metabolism. However, for L. purpureus, the fatty acid elongation pathway was enriched, while in F. albida, pathways corresponding to plant–pathogen interactions and cyanoamino acid metabolism were enriched. In S. birrea, enrichment occurred in plant–pathogen interaction, starch and sucrose metabolism, and fatty acid biosynthesis pathways. In M. oleifera, pathways related to fatty acid and diterpenoid biosynthesis and with cyanoamino acid metabolism were enriched. Using Gene Ontology (GO) analysis, paralog genes in V. subterranea, L. purpureus, F. albida, M. oleifera, and S. birrea were enriched in ion binding, metabolic processes, disease resistance, cell components, and biological processes, respectively.
Phylogenetic analysis and estimation of divergence time
We identified 141 single-copy genes in the 14 species used for the above analysis and subsequently used them to build a phylogenetic tree. Coding DNA sequence alignments of each single-copy family were generated following protein sequence alignment with MUSCLE (MUSCLE, RRID:SCR_011812) [41]. The aligned coding DNA sequences of each species were then concatenated to a supergene sequence. The phylogenetic tree was constructed with PhyML-3.0 (PhyML, RRID:SCR_014629) [61], with the HKY85+gamma substitution model on extracted four-fold degenerate sites. Divergence time was calculated using the Bayesian relaxed molecular clock method with MCMCTREE in PAML (PAML, RRID:SCR_014932) [62], based on published calibration times (39–59 Mya between M. truncatula and the main branch of legumes, 15–30 Mya between G. max and P. vulgaris, and 83–90 Mya between T. cacao and A. thaliana) [11, 63].
Based on the tree constructed using single-copy-family genes, the divergence time between F. albida and Papilionoideae was predicted to be 79.1 (70.0–87.0) Mya. This is a little different from a previous prediction of the origin of legumes based on two gene markers (matk and rbcL) [64]. The divergence time between M. oleifera and C. papaya was predicted to be 65.4 (59.2–71.1) Mya and 67.9 (53.6–77.3) Mya between S. birrea and C. sinensis (Fig. 1).
Subsequently, to evaluate gene gain and loss, CAFE (CAFE, RRID:SCR_005983) [65] was employed to estimate the universal gene birth and death rate, λ, under a random birth and death model using the maximum likelihood method. Results for each branch of the phylogenetic tree were estimated and are represented in Fig. 1.
GO enrichment analysis was also conducted on gene pathways in expanded families in the lineage of each sequenced species (Additional file 1: Tables S8, S9). Terms related to energy and nutrient metabolism were commonly distributed in the enrichment output of V. subterranea, L. purpureus, M. oleifera,andS. birrea, e.g., proton-transporting two-sector ATPase complex, cyclase activity, nutrient reservoir activity, and carbohydrate derivative binding.
In F. albida, expanded gene families were related to signal transfer or regulation, e.g., signaling receptor activity, phosphatase regulator activity, and regulation of response to stimulus. Furthermore, the regulatory factors GLABRA3, ENHANCER OF GLABRA 3, AUX1, LAX2, and LAX3 [66–68], which are related to the formation of root hairs and lateral roots, were identified in these families. As a traditional agroforestry tree in Africa, F. albida was previously reported to have a root system architecture that displays wide variation under different environmental factors (soil depth, nutrient amount, or water reservoirs) [69]. This suggests its adaptability to the complex environment, which requires signal transferring and regulation. The results obtained from the GO enrichment analysis were consistent with the biological characteristics of F. albida.
Mining of transcription factors
Transcription factors (TFs) in the sequenced species were identified using protein sequences of plant TFs from the plant TF database [70] by BLASTP search with an e-value cutoff of 10E−10, a minimum identity of 40%, and a minimum query coverage of 50%. About 59 TF families were revealed across the genes in M. truncatula, G. max, P. vulgaris, C. papaya, C. sinensis, and the five sequenced species (see Additional file 2: Table S14). Among these TFs, bHLH, NAC, ERF, MYB-related, C2H2, MYB, WRKY, bZIP, FAR1, C3H, B3, G2-like, Trihelix, LBD, GRAS, M-type MADS, HD-ZIP, MIKC_MADS, HSF, and GATA were found in abundance ( Fig. 3).
![Percentages of transcription factors in five orphan species. Blastp was used to search against 58 plant transcription factor families obtained from PlantTFDB [70] (see Additional file 2: Table S14). In this figure, MADS includes M-type_MADS and MIKC_MADS. MYB includes MYB and MYB_related. NF-YA/B/C includes NF-YA, NF-YB and NT-YC. “Others” comprises 31 types of transcription factors (E2F/DP, Nin-like, TALE, YABBY, GeBP, BES1, DBB, CO-like, CPP, SBP, STAT, WOX, BBR-BPC, CAMTA, AP2, ZF-HD, S1Fa-like, ARR-B, SRS, GRF, LSD, NF-X1, EIL, RAV, HRT-like, HB-PHD, VOZ, Whirly, SAP, LFY and NZZ/SPL) whose percentage was less than 1%.](https://oup.silverchair-cdn.com/oup/backfile/Content_public/Journal/gigascience/8/3/10.1093_gigascience_giy152/4/m_gigascience_8_3_giy152_f3.jpeg?Expires=1750261117&Signature=4QjDjDE2lj8uP~CLEby28FoZeRBJ0it~8Yq8vnvuwP68BTj~fESneH-1v--hZnj~qDbiWclolMpgSjP5AdT8xkEDGZsLgQZIbnXYUjWoLKjQZL-upxTwMolF9MLLF-lHs5l77-Z~bbnvoBmuiXbYGlO2I0qkP3Z4D17XHLF51vw331Rs1P9jwPCCgT6IOs-ibS77iGPnV0pt~jQ~qCYWDrcasEPkoBjujFKXKv9H1PDpGLSMGmeS~Lv88cKL-s4VXSQc8wbGBi1uItAHuWL-3OiN63cw6iiBjKIJdDbRXFK8JheH1fKkUTtXHJUT-WR0kkIdkEsDLW6CXXuwLyb5vA__&Key-Pair-Id=APKAIE5G5CRDK6RD3PGA)
Percentages of transcription factors in five orphan species. Blastp was used to search against 58 plant transcription factor families obtained from PlantTFDB [70] (see Additional file 2: Table S14). In this figure, MADS includes M-type_MADS and MIKC_MADS. MYB includes MYB and MYB_related. NF-YA/B/C includes NF-YA, NF-YB and NT-YC. “Others” comprises 31 types of transcription factors (E2F/DP, Nin-like, TALE, YABBY, GeBP, BES1, DBB, CO-like, CPP, SBP, STAT, WOX, BBR-BPC, CAMTA, AP2, ZF-HD, S1Fa-like, ARR-B, SRS, GRF, LSD, NF-X1, EIL, RAV, HRT-like, HB-PHD, VOZ, Whirly, SAP, LFY and NZZ/SPL) whose percentage was less than 1%.
Identification of protein, starch, and fatty acid biosynthesis-related genes
Using the amino acid, starch, and fatty acid synthesis genes in soybean [11, 71] as bait, we performed an ortholog search in V. subterranea, L. purpureus, F. albida, S. birrea, M. oleifera, G. max, Triticum aestivum, Zea mays, and O. sativa (Additional file 1: Tables S10–S13). Vigna subterranea is a good source of resistant starch (RS) [72], which has the potential to protect against diabetes and reduce the incidence of diarrhea and other inflammatory bowel diseases [73]. High amylose levels can contribute to RS. Previously, studies have shown that deficiency in SSIIIa (soluble starch synthase gene) decreases amylopectin biosynthesis and increases amylose biosynthesis by a granule-bound starch synthase (GBSS) encoded by the Wx gene in O. sativa indica [74]. Downregulation of the soluble starch synthase SSII and of SBE leads to higher levels of RS in barley [75]. Interestingly, in V. subterranea, two out of four GBSSs underwent expansion, suggesting their vital role in controlling starch synthesis (Fig. 4) at the transcriptional and post-transcriptional level. No expansion in GBSS was observed in the genomes of L. purpureus, F. albida, S. birrea, or M. oleifera; in V. subterranea, soluble starch synthase was not expanded. Therefore, we speculate that the expansion of GBSS might be why V. subterranea is rich in RS.
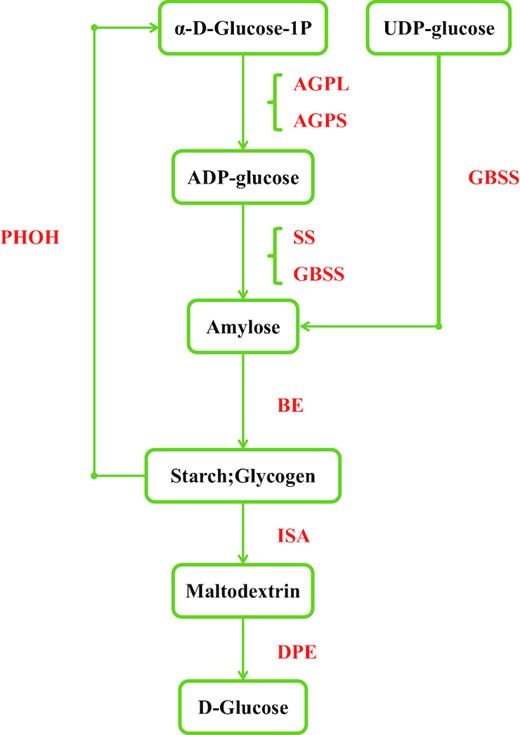
Identification of genes involved in the starch biosynthesis pathway. Genes identified as being involved in starch synthesis are shown in red. Numbers of homolog genes are presented in Additional file 1: Table S11. AGP, ADP-glucose pyrophosphorylase; AGPL, AGP large subunit; AGPS, AGP small subunit; PHOH, starch phosphorylase H (cytosolic type); GBSS, granule-bound starch synthase; SS, soluble starch synthase; BE, starch branching enzyme; ISA, isoamylase; DPE, starch debranching enzyme.
Similarly, differences in the copy numbers of choline kinase, a key factor in fatty acid synthesis and storage, were found between the four legumes (V. subterranea, 7; F. albida, 4; L. purpureus, 2; and G. max, 5) and between two orphan species (S. birrea, 1, and M. oleifera, 3). Choline kinase is the first enzyme in the cytidine diphosphate–choline pathway that is involved in lecithin biosynthesis [76, 77]. Based on these observations, we inferred that all the factors required to synthesize lecithin are present in V. subterranea. However, gene expression data remain lacking in terms of the GBSS and choline kinase genes in these the five species. More transcriptomic analysis and chemical tests are required to uncover the mechanisms of their nutrition metabolism.
Identification of the root nodule symbiosis pathway
Legumes (Fabaceae) are well known for their ability to fix nitrogen; an important trait to replenish nitrogen supplies in soil and agricultural systems. Being part of the human food production chain, legumes have a major impact on the global nitrogen cycle. Nitrogen-fixing plants can fix nitrogen through root nodule symbiosis (RNS) using symbiotic nitrogen-fixing bacteria. In a previous report, RNS was revealed to be restricted to Fabales, Fagales, Cucurbitales, and Rosales, which together form the monophyletic nitrogen-fixing clade. This suggests a predispositional event in their common ancestor, which enabled their subsequent evolution [78]. Despite this genetic predisposition, many leguminous members of the nitrogen-fixing clade are non-fixers [79]. This has raised the question as to whether the nodulation trait evolved independently in a convergent manner or originated from a single evolutionary event followed by multiple losses. The answer to this question cannot be explained with current genomic approaches because available genomic information of nodulating species is, at present, limited to a single subfamily, the Papilionoideae, in the Fabaceae. Although the Mimosoideae subfamily within the Fabaceae also contains nitrogen-fixing species, none of its members have been genome sequenced.
In this analysis, we identified 16 RNS signal (Sym) pathway genes in three legumes (V. subterranea, L. purpureus, and F. albida) and two non-legumes (S. birrea and M. oleifera). First, we collected the protein sequences of previously reported genes in the Sym pathways of L. japonicus and M. truncatula [80] (Fig. 5). Using these sequences as bait, we predicted the Sym genes in V. subterranea, L. purpureus, F. albida, S. birrea, and M. oleifera through reciprocal best hits generated by a BLASTP search with an E-value of 1e-5 (Table 8). To verify this prediction with syntenic analysis, all-versus-all BLASTP results were subjected to MCSCANX [81] with default parameters to generate syntenic blocks. The result showed that among the legumes, all of the components in the pathway were conserved except for MtNFP/LjNFR5, LjCASTOR, CCaMK, MtCRE1/LjLHK1, and NF-YA2, while many components were missing in the non-legumes. Among the three legumes, the orthologous genes MtNFP/LjNFR5, LjCASTOR, and MtIPD3/LjCYCLOPS were absent in F. albida. As previously reported, the expression of NIN is lower in the ipd3-mutant line [82]; analysis of the M. truncatula mutant C31 showed that the Nod Factor Perception gene is essential in Nod factor perception at early stages of the symbiotic interaction [83]. Meanwhile, the function of IPD3 was proved to be partly redundant, which means it is likely that other proteins phosphorylated by CCaMK can partially fulfill this role when IPD3 is absent [82]. Differences in the components of the RNS pathway (Table 8), together with the relatively weak nitrogen-fixing ability [84] of F. albida, is thus a good reference for RNS diversification research.
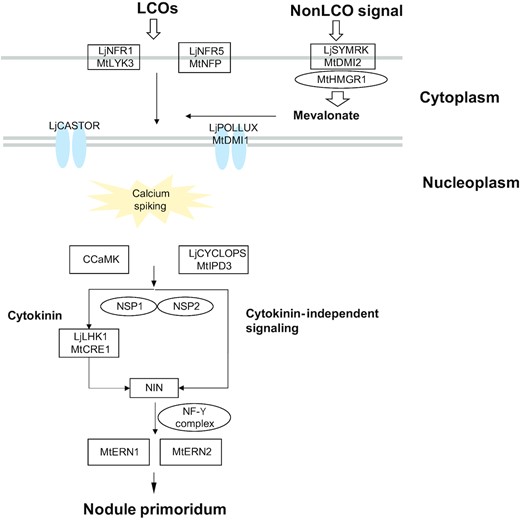
The common symbiosis signaling pathway among the orphan crops. Sixteen root nodulation symbiosis signal (Sym) pathway genes were identified in three legumes (Vigna subterranea, Lablab purpureus, and Faidherbia albida) and two non-legumes (Sclerocarya birrea and Moringa oleifera). Lj, Lotus japonicus; Mt, Medicago truncatula; LCOs, Lipochitooligosaccharides.
Orthologs of nitrogen fixation genes in Vigna subterranea, Lablab purpureus, Faidherbia albida, Moringa oleifera,andSclerocarya birrea
| Gene | V. subterranea | L. purpureus | F. albida | M. oleifera | S. birrea |
|---|---|---|---|---|---|
| MtLYK3/LjNFR1 | Vigsu176S22567_VIGSU | Labpu216S12485_LABPU | Faial2789S13350_FAIAL | —— | —— |
| MtNFP/LjNFR5 | Vigsu1898S04417_VIGSU | Labpu54S03611_LABPU | —— | —— | Sclbi409S02347_SCLBI |
| MtDMI2/LjSYMRK | Vigsu107959S16599_VIGSU | Labpu4785S15752_LABPU | Faial1833S08172_FAIAL | Morol36160S02362_MOROL | Sclbi59955S15146_SCLBI |
| LjCASTOR | Vigsu108012S17109_VIGSU | Labpu27S13484_LABPU | —— | —— | ——— |
| MtHMGR1 | —— | —— | —— | —— | ——— |
| MtDMI1/LjPOLLUX | Vigsu108496S19983_VIGSU | Labpu4332S15101_LABPU | Faial363S16033_FAIAL | Morol36085S07630_MOROL | ——— |
| NSP1 | Vigsu2922S08781_VIGSU | Labpu723S04373_LABPU | Faial1104S01086_FAIAL | Morol36102S01150_MOROL | Sclbi5005S02593_SCLBI |
| NSP2 | Vigsu107793S01507_VIGSU | Labpu887S08157_LABPU | Faial757S23006_FAIAL | Morol36224S03158_MOROL | Sclbi2944S01716_SCLBI |
| CCaMK | Vigsu91S05737_VIGSU | —— | Faial752S22546_FAIAL | —— | ——— |
| MtIPD3/LjCYCLOPS | Vigsu104856S09608_VIGSU | Labpu701S17462_LABPU | —— | —— | Sclbi2578S10386_SCLBI |
| NIN | Vigsu273S23676_VIGSU | Labpu165S10337_LABPU | Faial788S23538_FAIAL | Morol36195S02810_MOROL | Sclbi2838S04948_SCLBI |
| MtCRE1/LjLHK1 | —— | Labpu2293S02028_LABPU | Faial1226S02883_FAIAL | —— | —— |
| NF-YA1 | Vigsu107799S13964_VIGSU | Labpu193775S11413_LABPU | Faial246S12019_FAIAL | Morol36154S02289_MOROL | Sclbi406S12278_SCLBI |
| NF-YA2 | —— | —— | Faial858S26716_FAIAL | —— | ——— |
| MtERN1 | Vigsu107612S00570_VIGSU | Labpu210S01798_LABPU | Faial719S21851_FAIAL | Morol36040S00658_MOROL | Sclbi1920S01196_SCLBI |
| MtERN2 | Vigsu108137S07511_VIGSU | Labpu448S03276_LABPU | Faial4604S17896_FAIAL | —— | ——— |
Conclusion
This comprehensive study reports the sequencing, assembly, and annotation of five genomes of underutilized plants in Africa, along with details of their key evolutionary features. The draft genomes of these species will serve as an important complementary resource for non-model food crops, especially the leguminous plants, and will be valuable for both agroforestry and evolutionary research. Improving these underutilized plants using genomics-assisted tools and methods could help to bring food security to millions of people.
Availability of supporting data
The raw data from our genome project was deposited in the NCBI Sequence Read Archive database with Bioproject IDs PRJNA453822 and PRJNA474418. Assembly and annotation of the five genomes and other supporting data, including BUSCO results, are available in the GigaDB repository [85], and the data reported in this study are also available in the CNGB Nucleotide Sequence Archive (CNSA: https://db.cngb.org/cnsa; accession number CNP0000096). All genome annotations described here are also available at http://bioinformatics.psb.ugent.be/orcae/AOCC.
Additional files
Figure S1: K-mer (K = 17) analysis of five genomes.
Figure S2: Distribution of sequencing depths of the assembly data.
Figure S3: The GC content.
Figure S4: Comparison of GC content across closely related species.
Figure S5: Statistics of gene models in Vigna subterranea, Lablab purpureus, Faidherbia albida, Moringa oleifera and Sclerocarya birrea.
Figure S6: Expansion and contraction of gene families.
Table S1: Statistics of the raw and clean data of DNA sequencing.
Table S2: Summary statistics of the transcriptome data in four species.
Table S3: Estimation of genome size based on k-mer statistics in five species.
Table S4: BUSCO evaluation of the annotated protein-coding genes in five species.
Table S5: Analysis of gene families of different species.
Table S6: Enriched pathways of unique paralogs genes in families.
Table S7: Enriched GO terms (level 3) of unique paralogs genes in families.
Table S8: Enriched GO terms (level 3) of genes in families with expansion.
Table S9: Enriched pathways of genes in families with expansion.
Table S10: The copy numbers of protein biosynthesis-related genes in each species.
Table S11: The copy numbers of starch biosynthesis-related genes in each species.
Table S12: The copy numbers of fatty acid synthesis and storage-related genes in each species.
Table S13: The copy numbers of fatty acid degradation-related genes in each species.
Table S14: Numbers of transcription factors in the studied species.
Abbreviations
CTAB: Cetyl TrimethylAmmonium Bromide; PCR: Polymerase Chain Reaction; BLAST: Basic Local Alignment Search Tool; BUSCO: Benchmarking Universal Single-Copy Orthologues; GBSS: granule-bound starch synthase; GO: Gene Ontology; KEGG: Kyoto Encyclopedia of Genes and Genomes; COGs: the Clusters of Orthologous Groups; LTR: long terminal repeats; MITE: miniature inverted repeat transposable elements; MUSCLE: multiple sequence comparison by log-expectation; Mya: million years ago; NCBI: National Center for Biotechnology Information; RNS: root nodule symbiosis; RS: resistant starch; TF: transcription factor.
Competing interests
The authors declare that they have no competing interests.
Funding
This work was supported by funding from the Shenzhen Municipal Government of China (grants JCYJ20150831201643396 and JCYJ20150529150409546) and the Guangdong Provincial Key Laboratory of Genome Read and Write (grant 2017B030301011). This work is part of the 10KP project led by BGI-Shenzhen and China National GeneBank.
Author contributions
X.L., X.X., H.Y., J.W., P.S.H., R.J., A.V., Y.V.D.P., and Y.C. conceived the project and supervised the respective components: DNA extraction, sample logistics, and collection conducted by the African Orphan Crops Consortium of the World Agroforestry Centre and data generation and analyses conducted by BGI. Y.C. supervised the analyses. R.K. and S.M. collected and extracted the DNA and RNA. S.B. and F.Y. performed the genome assembly. M.L., X.Z.L., S.B.W., A.E.J.Y., and L.Z.L. performed the genome annotation, gene family analysis, and identification of genes related to root growth and RNS. Y.C., M.L, and X.Z.L. performed the phylogenetic analysis. Y.C., H.L., S.K.S., P.S.H., and A.V. wrote the manuscript. H.R.L. and S.F.P. sequenced the samples. S.M., W.K.H., A.M., P.S.H., J.W., and H.M.Y. revised the manuscript. All authors read, edited, and approved the final version of the manuscript.
ACKNOWLEDGEMENTS
Authors duly acknowledge Shu-Min Kao and Dr. Lieven Sterck for their help in technical issues.
References
Author notes
Equal contribution.
