


Abstract
Progress in the field of evolutionary forest ecology has been hampered by the huge challenge of phenotyping trees across their ranges in their natural environments, and the limitation in high-resolution environmental information.
The GenTree Platform contains phenotypic and environmental data from 4,959 trees from 12 ecologically and economically important European forest tree species: Abies alba Mill. (silver fir), Betula pendula Roth. (silver birch), Fagus sylvatica L. (European beech), Picea abies (L.) H. Karst (Norway spruce), Pinus cembra L. (Swiss stone pine), Pinus halepensis Mill. (Aleppo pine), Pinus nigra Arnold (European black pine), Pinus pinaster Aiton (maritime pine), Pinus sylvestris L. (Scots pine), Populus nigra L. (European black poplar), Taxus baccata L. (English yew), and Quercus petraea (Matt.) Liebl. (sessile oak). Phenotypic (height, diameter at breast height, crown size, bark thickness, biomass, straightness, forking, branch angle, fructification), regeneration, environmental in situ measurements (soil depth, vegetation cover, competition indices), and environmental modeling data extracted by using bilinear interpolation accounting for surrounding conditions of each tree (precipitation, temperature, insolation, drought indices) were obtained from trees in 194 sites covering the species’ geographic ranges and reflecting local environmental gradients.
The GenTree Platform is a new resource for investigating ecological and evolutionary processes in forest trees. The coherent phenotyping and environmental characterization across 12 species in their European ranges allow for a wide range of analyses from forest ecologists, conservationists, and macro-ecologists. Also, the data here presented can be linked to the GenTree Dendroecological collection, the GenTree Leaf Trait collection, and the GenTree Genomic collection presented elsewhere, which together build the largest evolutionary forest ecology data collection available.
Context
The impacts of climate change and land use change on forests are already severe, as observed, e.g., following the extreme summer drought of 2018 that triggered a massive increase in mortality in Central European forests [1]. Furthermore, changes are expected to be acute in the future, altering distribution ranges and ecosystem functioning, as well as the interactions among species [2]. Forecasts indicate that near-surface temperature will shift poleward at mean rates of 80–430 m yr−1 for temperate forests during the 21st century [3]. This translates into northward shifts of trees’ bioclimatic envelopes of 300–800 km within 1 century [3]. More importantly, the frequency and intensity of drought events, heat waves, forest fires, and pest outbreaks [4] are expected to increase.
In the light of these changes, species and forest ecosystem resilience will depend on the extent and structure of phenotypic plasticity, genetic variation, and adaptive potential, as well as dispersal ability. From the results of extensive networks of field experiments (provenance trials), it has long been shown that tree species are locally adapted at multiple spatial scales. In Europe, where most tree populations have established following post-glacial recolonization, such patterns of local adaptation must have developed rapidly and despite long generation time and extensive gene flow [5], a process enabled by high levels of within-population plasticity, genetic and epigenetic variation, and large population sizes [6]. Recent work has shown that genetic variation for stress response may be strongly structured along environmental gradients, such as water availability [7], temperature [8], or photoperiod [9]. However, the spatial patterns of current adaptation in particular phenotypic traits are only partly informative regarding the potential for future adaptation under a changing climate. To advance our understanding of the adaptive potential of trees, it is crucial to evaluate multiple traits in parallel to be able to model their putative response to new environmental conditions.
Recently, substantial effort has been made to identify specific genes and gene combinations that have undergone selection, by associating mutations at candidate loci with phenotypes related to stress events [10,11] or with environmental variables [12]. This latter example by Yeaman and co-workers [12] is one of the first association studies in forest tree species on a large genomic scale and the first to investigate convergent local adaptation in distantly related tree species. However, progress in this field has been hampered by limited genomic resources, the lack of small-scale, individual tree-level environmental information [13], and the huge challenge of phenotyping trees in their natural environments [14,15].
The GenTree Platform aims to address these challenges by providing individual-level, high-resolution phenotypic and environmental data for a set of up to 20 sampling sites for each of 12 ecologically and economically important forest tree species across Europe. For a subset of 7 species (B. pendula, F. sylvatica, P. abies, P. pinaster, P. sylvestris, P. nigra, and Q. petraea), the sampling of sites was carried out in pairs, i.e., contained 2 stands that were close enough to be connected by gene flow but situated in contrasting environments.
The sampling design described here was used for collecting phenotypic traits and ecological data. Also, tree ring and wood density measurements for the same trees were assessed [16], and datasets on leaf traits, including specific leaf area and isotopic content [17], as well as high-density single-nucleotide polymorphism data for each tree, were established, that will be published in GeneBank. All data and metadata information are gathered in the GnpIS repository [33], which makes updates possible [18].
We investigated the extent to which other datasets comparable to the data presented here exist by screening our 12 species in the TRY Plant Trait Data Base, the International Tree-Ring Data Bank, and the Biomass And Allometry Database for woody plants (BAAD). While this is a systematic approach, it leaves out a large number of tree species and therefore we cannot claim to have a comprehensive overview of the existing data. However, all 3 databases are large collections that include at least some of the tree measurements that we present. Even though these are tremendous resources, the major difference is that owing to their nature as collecting points of numerous independent datasets, there is no coherent sampling scheme in these collections as such, meaning that the number of trees per site, the method of tree selection, measured phenotypes, and provided environmental information vary greatly and therefore do not allow for coherent comparative analyses such as those of the GenTree Platform. For example, BAAD reports diameter at breast height (DBH) data for only 4 of the species presented here, namely, B. pendula with 3 populations, F. sylvatica with 2 populations, P. abies with 4 populations, and P. sylvestris with 10 populations. In the larger TRY database, all of our species are represented, but the variability of sampling schemes is much more heterogeneous concerning traits, number of populations per species, and metadata. For example, DBH measurements are being reported 232 times from a total of 12 B. pendula populations. Of these, almost all of the 170 measurements are from 1 population while from many other populations only 1 or up to 5 measurements are reported. Also, the measurements stem from 5 different original studies and thus have very different levels of additional information. We conclude that the core value of our reported data lies in the coherent sampling design, as well as the large number of sampled populations and individuals per species.
Methods
A machine readable summary of the GenTree data is provided in Table 1. All recorded parameters are listed in Table 2.
Machine readable data summary
| Measurements | Vegetation cover, rock cover, soil depth, competition index, regeneration, diameter at breast height, height, crown size, bark thickness, number of fruits, stem straightness, branch angle, forking index |
|---|---|
| Technology types | Bark gauges, calculations, caliper, clinometer, GPS device, increment corer, laser distance measurement, telescopic measuring pole |
| Factor Types | Tree species |
| Sample characteristic organism | Abies alba, Betula pendula, Fagus sylvatica, Picea abies, Pinus cembra, Pinus halepensis, Pinus nigra, Pinus pinaster, Pinus sylvestris, Populus nigra, Taxus baccata, Quercus petraea |
| Sample characteristic location | Europe |
Variables names, explanations, and specifications measured for all 4,959 trees and all 194 GenTree sites
| Variable name | Variable explanation | Specification |
|---|---|---|
| GenTree Platform metadata | ||
| m01.spec | Species abbreviations | Abies Alba (AA), Betula pendula (BP), Fagus sylvatica (FS), Picea abies (PA), Pinus cembra (PC), Pinus halepensis (PH), Pinus nigra (PN), Populus nigra (PO), Pinus pinaster (PP), Pinus sylvestris (PS), Quercus petraea (QP), Taxus baccata (TB) |
| m02.country | Country abbreviations | Isocode 6133–2; Austria (AT), Switzerland (CH), Germany (DE), Spain (ES), Finland (FI), France (FR), Great Britain (GB), Greece (GR), Italy (IT), Lithuania (LT), Norway (NO), Sweden (SE) |
| m03.site.num | Site numbers | Running numbers of sites per species 01–24 |
| m04.site.id | Complete site-ID per species | Merger of m01–m03 |
| m05.tree.num | Tree numbers | Running numbers within sites 01–25 |
| m06.tree.id | Complete tree ID | Merger of m01–m03, m05 |
| m07.trial.name | Site name | |
| m08.lat | Latitude | Decimal degrees, WGS84 |
| m09.lon | Longitude | Decimal degrees, WGS84 |
| GenTree Platform phenotypes | ||
| p01.height | Height | Tree height, m |
| p02.dbh | DBH | Diameter at breast height, cm |
| p03.bark | Bark thickness mean | Mean value of bark thickness, cm |
| p04.trunk | Trunk straightness/flexuosity | 5: Absolutely straight; 4: fairly straight (in 1 direction slightly crooked); 3: slight to moderate bend in different directions; 2: moderate or strong bends; 1: no straight stem |
| p05.branch | Branch angle | 1: <23° (steep); 2: 23–45°; 3: 45–67°; 4: 67–90° (plain); 5: >90° |
| p06.fork | Forking index | 1: Fork at the lower third of tree height; 2: fork at middle third; 3: fork at upper third; 4: no fork—multiplied by 10 and then divided by the number of stems |
| p07.canopy.1 | Canopy projection REP 1 | Crown diameter projection, m |
| p08.canopy.2 | Canopy projection REP 2 | Crown diameter projection, m |
| p09.crown.ellipse | Crown ellipse | Area of an ellipse (di/2)*(dj/2)*π, m2 |
| p10.crown.round | Crown size | As some only have 1 diameter, round areas with the mean diameter [(di+dj)/2]2*π, m2 |
| p11.regeneration | Natural regeneration | 1: Absent; 2: scattered; 3: groups; 4: abundant |
| p12.fruit.mean | Fruit/cone number | Number of fruits |
| p13.basal.area | ||
| GenTree Platform in situ environmental measurements | ||
| e01.plant.cover | Total plant cover | 1: None; 2: little (5–20%); 3: low (20–40%); 4: medium (40–60%); 5: high (60–80%); 6: very high (80–95%); 7: full cover (>95%) |
| e02.comp.index.a | Competition index A | CI assessed following Canham et al. [23], and multi-stems as the sum |
| e03.comp.index.b | Competition index B | CI assessed following Canham et al. [23], and multi-stems assessing the sum of basal areas and then the DBH |
| e04.comp.index.c | Competition index C | CI assessed following Lorimer [24], and multi-stems as the sum |
| e05.comp.index.d | Competition index D | CI assessed following Lorimer [24], multi-stems assessing the sum of basal areas and then the DBH |
| e06.status | Dominant, co-dominant | |
| e07.elevation | Elevation of the tree | Meters above sea level |
| e08.slope | Slope at the tree level | Slope in degrees |
| e09.aspect | Aspect at the tree level | 0–360° |
| e10.soil.depth | Mean soil depth | Mean of 3 measures (measurement to a maximum depth of 60 cm) |
| e11.stone.content | Mean stone content | Mean of 3 measures: 1: none; 2: little (5–20%); 3: low (20–40%); 4: medium (40–60%); 5: high (60–80%); 6: very high (80–95%); 7: full cover (>95%) |
| e12.rock.cover | Total rock cover | 1: None; 2: little (5–20%); 3: low (20–40%); 4: medium (40–60%); 5: high (60–80%); 6: very high (80–95%); 7: full cover (>95%) |
Sampling strategy
To optimize the sampling design for genome scans and association studies, we followed the recent theoretical work by Lotterhos and Whitlock [19,20], which indicates that a paired sampling design has more power to detect the genomic signatures of local adaptation. Using this framework, populations from across the natural range of a species are sampled in pairs, with the 2 sites in each pair situated geographically close enough to be genetically similar at neutral genes owing to a common evolutionary history and ongoing gene flow, but in distinct selective niches such that the local fitness optimum differs between the 2 sites. This sampling confers more power to detect evidence of selection in the genome through either association with environmental or phenotypic variables or the detection of outliers (e.g., for genetic differentiation, FST) [19, 20]. Trees are very amenable to a pairwise approach because they are known to be locally adapted, often at fine spatial scales [21,22] and irrespective of gene flow distances [6]. This strategy was followed for the aforementioned subset of 7 species for which genomic resources were available (i.e., full or draft genome).
Such local niche contrasts are neither easy to identify nor readily available when environments are homogenous. Therefore, a second principle of the sampling design was to cover a large part of each species’ natural geographic range (Fig. 1) and environmental space (Fig. 2) to capture selective niche variation. Finally, sites with a history of intensive management or any other intense and obvious anthropogenic or natural disturbances were avoided. This strategy was followed for all 12 species.
![Sampling sites (black dots) and distributions of the 12 selected tree species (dark green shading) for in situ phenotype measurements. Distribution maps are based on a comprehensive high-resolution tree occurrence dataset from the European Union [30].](https://oup.silverchair-cdn.com/oup/backfile/Content_public/Journal/gigascience/10/3/10.1093_gigascience_giab010/2/m_giab010fig1.jpeg?Expires=1750238174&Signature=nDAnYepOzC5ySZKf0FfZh5IOulQbyZStRbBMGA3elbEEoD~~5DiFcMGvsLCgV2XqwUSRoQ84-FNo1mvFjH9n3O0igruI0pS1S3s82fjHEfFz1ziyWe2Oz~60c2IUL5M0RXWj1Z00hlvXLSKVQvKgUoMH2JjvSahhObb-gVYrCdk8R19We-Ou440G9~HsQIRhqO4SXa56782CSyQqpEruF2fZlcdA-mhidi-213hdR6FFpQPy7r7MmmV9KSb9z0hTpzxj5ryFclY6j49nLhnCgWac243xrq~eDVJwxdZpESXZZ3CAIeoD5ej6jB-HxUa2Vm2NDCOE3fgg5DBMGHULUQ__&Key-Pair-Id=APKAIE5G5CRDK6RD3PGA)
Sampling sites (black dots) and distributions of the 12 selected tree species (dark green shading) for in situ phenotype measurements. Distribution maps are based on a comprehensive high-resolution tree occurrence dataset from the European Union [30].
![Climate-space diagrams for the 12 selected European tree species with annual mean temperature on the x-axis and annual total precipitation on the y-axis. Grey points represent species occurrences based on a comprehensive high-resolution tree occurrence dataset for Europe [30] and black dots indicate the GenTree sites.](https://oup.silverchair-cdn.com/oup/backfile/Content_public/Journal/gigascience/10/3/10.1093_gigascience_giab010/2/m_giab010fig2.jpeg?Expires=1750238174&Signature=VK0IavAXa95SPZdcnX0yHJy-gNCLIJ983LO8vIjM9HZkNr-zF4sSImuRdw9F3JljbsKJGmicXjb1PHFLJJ-JD~p-NOsctMz0N7KlpU9OFR8i2Y6kos92chQdfvowNIDIrf24isFd6Urt1wR3VyrGZijIF9Zvj1FRvhRqlKJc6bp3uY5~SmRz~2G~3fPRsq2nl3lH82Haii6GdH3tJ-9BYhKFa1e1~WbfX0ok2UjQJDTtfLJAd9Hdepg24BbyA3u50Vv2wxykf8W0HEEofFWWmRtPsc9W3zrkzEJ7iy9OHFoomqDZgSmgifqygdQeggO1M6icY8M15hMPwPrNRxT4Xg__&Key-Pair-Id=APKAIE5G5CRDK6RD3PGA)
Climate-space diagrams for the 12 selected European tree species with annual mean temperature on the x-axis and annual total precipitation on the y-axis. Grey points represent species occurrences based on a comprehensive high-resolution tree occurrence dataset for Europe [30] and black dots indicate the GenTree sites.
Selection of trees on sites
A minimum of 25 trees was sampled per site to capture the natural phenotypic and genetic variability. Trees had to be mature but not senescent, dominant or codominant, and had to show no signs of significant damage due to pests and diseases or generally low vigor. Sampled trees were ≥30 m apart and, where possible, were chosen along several parallel linear transects across each site, typically resulting in 2–4 transects per sampling site to keep the overall sampling area <3 ha.
Site and tree metadata
Sites were labeled by a 2-letter country code (ISO 3166–1 alpha-2) followed by a 2-letter species code and a 2-digit site number (Table 2). Individual tree labels added another 2-digit tree number. Every tree was permanently labeled so that future studies can resample subsets or the entire GenTree collection to gain time-series data of individual traits or to add new phenotypes to the analyses. Be aware that permission of the respective landowners must be obtained before sampling. Handheld GPS devices were used to record the position of each tree. The precision of GPS measurements in forests is notoriously challenging: regular commercial devices achieve an accuracy of ∼8–15 m with good satellite coverage. Given that trees were selected with a minimum distance of 30 m this accuracy was sufficient for the correct positioning of trees relative to each other. An overall population position was defined by taking the mean value across all the individual tree measurements. Coordinates were in decimal degrees with 4 decimal units to reflect the general measurement accuracy (∼11.1 m) and were stored in the WGS 84 reference system. GPS devices were also used to record the tree's elevation, either directly or through post hoc positioning in digital elevation models. The local aspect at the site of the tree was measured by a compass in 5° steps in the direction of the steepest slope.
The metadata for each site consists of an ID code (see above), sampling date, location (GPS coordinates, see above), and elevation in meters above sea level. Each stand was also characterized as being monospecific or mixed (in the latter case the most common co-occurring species was noted), stand structure was noted as single or multiple layered, and the age distribution as even or uneven (categorical variables).
Competition index at tree level
Competition indices (CIs) were calculated following Canham et al. [23] and Lorimer [24]. Specifically, the first index following Lorimer [24] was calculated as |$\,\,\mathrm{NCI}\,\, = \mathop \sum \nolimits_{i = 1}^5 \left(\mathrm{DB}{\mathrm{H}_j}/\mathrm{DB}{\mathrm{H}_i}\right)/\mathrm{dis}{\mathrm{t}_i}$| that follows the same notation as above, and where DBH is the DBH of the subject trees j and i.
Second, the distance-dependent competition index (NCI) following Canham et al. [23] was computed as |$\mathrm{NCI} = \mathop \sum \nolimits_{i = 1}^5 ({\mathrm{DB}{\mathrm{H}_i}}/{\mathrm{dis}{\mathrm{t}_i}})$|, where DBHi is the DBH of competitor tree i and disti is the distance between the subject tree and competitor tree i. This index assumes that the net effects of neighboring trees vary as a direct function of the size of the neighbors and as an inverse function of the distance. For this purpose, the distance to the 5 nearest neighbors of each target tree was measured and their respective DBH was measured.
Moreover, it was noted whether competitor trees were conspecific to the target tree or not. Each multi-stemmed tree was considered as a single competitor where each stem of >15 cm DBH was measured and added to the sum of means.
Environmental characteristics within subplots around each tree
Surrounding each target tree, slope, vegetation cover (without tree cover), and stone content were assessed in a 10 m × 10 m plot. The slope was assessed using a clinometer. Vegetation and rock cover were estimated in the classes <5%, 5–20%, 20–40%, 40–60%, 60–80%, 80–95%. Soil depth was estimated at 3 random points in the quadrat to a maximum of 60 cm with a pike and was averaged across these 3 values.
Regeneration
In the same 10 m × 10 m plots, natural regeneration of the target species was assessed according to the following 4 classes: absent (no recruit visible), scattered (few/scattered individuals), grouped (presence of scattered groups within the plot), and abundant (regularly spread all over the plot) and is indicated in the database with values from 1 to 4. As this method cannot resolve maternity, the results indicate realized fecundity at the stand level.
Growth traits
DBH
DBH in centimeters was measured at a stem height of 1.3 m either by using a caliper to measure 2 perpendicular diameters and subsequently taking the average of these 2 measurements or by measuring the circumference of the tree using a tape and computing the diameter from that value. Each measurement was performed to the nearest 0.1 cm. If a tree had >1 trunk, all of them were measured and the average was recorded.
Height
Height from the ground to the top of the crown in meters was measured using a hypsometer (Nikon forestry Pro Laser, Tokyo, Japan), a laser vertex (Haglof Vertex III, Langsele, Sweden), or a Laser Range Meter (Bosch GLM 50 C, Leinfelden-Echterdingen, Germany). For short trees, a telescopic measuring pole was used. Height was noted to the nearest 0.1 m. To forego errors introduced by measuring height on sloping ground, height measurements on slopes were conducted from the same elevation as the tree's base by approaching the tree sideways. Where this was not possible, a slope correction factor was used.
Crown size
The crown size in square meters was measured as the circular and ellipsoid plane area of the crown. For this, we measured 2 perpendicular crown diameters (canopy 1 and 2) with a measuring tape, with the first measurement being made along the longest axis of the crown, from 1 edge to the other, and by visually projecting the crown margin onto the ground to the nearest decimeter. For the ellipse area, we calculated |$({d_i}/2)*({d_j}/2)*\pi $| and for the circular area (|${d_i}$|+|${d_j}$|/2)²*|$\pi $|.
Bark thickness
For measuring bark thickness in millimeters, we used bark gauges (Haglof Barktax, Langsele, Sweden) or a tape after extracting the bark with a small caliper (if bark could be detached without tree damage) or increment borers (Haglof increment borer, Langsele, Sweden) in case of strong and thick bark. Five measurements were taken for each tree at breast height and the average was calculated. For tree species with a clear dichotomy of bark thickness (e.g., old P. nigra, T. baccata), we included ≥2 measurements from the thinner and thicker bark areas each.
Number of fruits
In conifers, cones were counted by providing the average of 3 rounds of counting, made by an observer on the ground using binoculars. Only mature (brown) and closed cones were counted, i.e., those containing seeds, and not immature (green) or open cones, whose seeds had already been dispersed (open cones often stay on the branch for several years after seeds are dispersed). In broadleaves, the number of fruits was counted for 30 seconds, repeating the procedure 3 times to then average the 3 counts.
In the case of species with very small fruits that are hard to see individually and in locations with a very limited view of the canopy, each tree was assigned to 1 of 5 categories, namely, 0 (no fruits), 1 (a few fruits in a small section of the crown), 2 (a few fruits in ≥2 sections of the crown), 3 (a lot of fruits in a small section of the crown), and 4 (a lot of fruits in ≥2 sections of the crown).
Straightness
Straightness of the stem was classified according to 5 levels: (1) No straight stem, (2) moderate or strong bends, (3) slight to moderate bend in different directions, (4) fairly straight (in 1 direction slightly crooked), (5) absolutely straight. This was performed on the lower 15 m of the tree beginning from the ground with the crown not taken into account. In the case of forked stems, only the trunk below the deepest forking point was evaluated.
Branch angle
Branch angle was classified at 2 successive whorls according to a 5-scale scheme in conifers with (1) <23°, (2) 23–45°, (3) 45–67°, (4) 67–90°, (5) >90°, and a 4-scale scheme in broadleaves omitting the >90° class. In black poplar, only the top 2 m of the crown were considered.
Forking index
The branching of a tree in 2 (fork) or more (ramiform) equally thick and long stems was assessed with a forking index. The index took into account 2 parameters. First a score for the relative position of the fork: (4) no forking, (3) forking in the upper third of the tree, (2) forking in the middle third of the tree, (1) forking in the lower third of the tree; and second the number of axes (stems). The score of the relative position was then multiplied by 10 and divided by the number of axes.
Modeled environmental data extracted for GenTree sites
Topography, soil, and climate data were compiled to characterize environmental conditions in each GenTree sampling site as follows.
Topography
We used the European digital elevation model to describe topographic conditions at 25 m spatial resolution with a vertical accuracy of approximately ±7 m (EU-DEM v. 1.1 from the Copernicus program [34]). We derived 14 variables (Table 3) based on biological hypotheses and their informative power at the local scale [25]. We calculated morphometric, hydrologic, and radiation grids for each GenTree site and visually inspected data integrity using SAGA 6.2 [26] (details in Table 3).
Environmental variable names, explanations, and specifications modeled for all 4,959 trees and 194 GenTree sites
| Variable | Specification | ||
|---|---|---|---|
| Name | Explanation | Unit | Resolution (m) |
| GenTree Platform modeled environmental parameters | |||
| Sample | Sample identification | None | None |
| Country | Country code | None | None |
| countryspecies | Country and species code | None | None |
| Species | Species code | None | None |
| Population | Population identification | None | None |
| latwgs84 | Latitude in WGS84 | Degree | 25 |
| lonwgs84 | Longitude in WGS84 | Degree | 25 |
| latetrs89 | Latitude in ETRS89 | Degree | 25 |
| lonetrs89 | Longitude in ETRS89 | Degree | 25 |
| t01alt | Altitude | m | 25 |
| t02slp | Slope | Degree | 25 |
| t03asp | Eastness | Degree | 25 |
| t04vcu | Profile curvature | Degree/m | 25 |
| t05hcu | Horizontal curvature | Degree/m | 25 |
| t06ddg | Downslope distance gradient | Degree | 25 |
| t07mpi | Morphometric protection index | None | 25 |
| t08tpi | Topographic position index | None | 25 |
| t09vrm | Vector ruggedness measure | None | 25 |
| t10twi | Topographic wetness index | None | 25 |
| t11svf | Sky-view factor | None | 25 |
| t12sdir | Potential direct solar radiation | kJ m−2 | 25 |
| t13sdif | Potential diffuse solar radiation | kJ m−2 | 25 |
| t14stot | Potential total solar radiation | kJ m−2 | 25 |
| awc15 | Available water capacity (0–30 cm) | % | 250 |
| awc140 | Available water capacity (60–200 cm) | % | 250 |
| bio01 | Yearly mean temperature | °C/10 | 1,000 |
| bio02 | Mean diurnal range | °C/10 | 1,000 |
| bio03 | Isothermality | °C/10 | 1,000 |
| bio04 | Temperature seasonality | °C/10 | 1,000 |
| bio05 | Max temperature of warmest month | °C/10 | 1,000 |
| bio06 | Min temperature of coldest month | °C/10 | 1,000 |
| bio07 | Temperature annual range | °C/10 | 1,000 |
| bio08 | Mean temperature of wettest quarter | °C/10 | 1,000 |
| bio09 | Mean temperature of driest quarter | °C/10 | 1,000 |
| bio10 | Mean temperature of warmest quarter | °C/10 | 1,000 |
| bio11 | Mean temperature of coldest quarter | °C/10 | 1,000 |
| bio12 | Yearly precipitation sum | kg m−2 | 1,000 |
| bio13 | Precipitation of wettest month | kg m−2 | 1,000 |
| bio14 | Precipitation of driest month | kg m−2 | 1,000 |
| bio15 | Precipitation seasonality | kg m−2 | 1,000 |
| bio16 | Precipitation of wettest quarter | kg m−2 | 1,000 |
| bio17 | Precipitation of driest quarter | kg m−2 | 1,000 |
| bio18 | Precipitation of warmest quarter | kg m−2 | 1,000 |
| bio19 | Precipitation of coldest quarter | kg m−2 | 1,000 |
| Gdd | Growing degree days | °C | 1,000 |
| Gsp | Accumulated precipitation | kg m−2 | 1,000 |
| Shc | Hydrothermic coefficient | (kg m−2/10)/°C | 1,000 |
| rh410 | Relative humidity | % | 1,000 |
| Fcf | Frost change frequency | Number of events | 1,000 |
| Nfd | Number of frost days | Number of days | 1,000 |
| prec01 | Precipitation sum in January | kg m−2 | 1,000 |
| prec02 | Precipitation sum in February | kg m−2 | 1,000 |
| prec03 | Precipitation sum in March | kg m−2 | 1,000 |
| prec04 | Precipitation sum in April | kg m−2 | 1,000 |
| prec05 | Precipitation sum in May | kg m−2 | 1,000 |
| prec06 | Precipitation sum in June | kg m−2 | 1,000 |
| prec07 | Precipitation sum in July | kg m−2 | 1,000 |
| prec08 | Precipitation sum in August | kg m−2 | 1,000 |
| prec09 | Precipitation sum in September | kg m−2 | 1,000 |
| prec10 | Precipitation sum in October | kg m−2 | 1,000 |
| prec11 | Precipitation sum in November | kg m−2 | 1,000 |
| prec12 | Precipitation sum in December | kg m−2 | 1,000 |
| tmean01 | Mean temperature in January | °C/10 | 1,000 |
| tmean02 | Mean temperature in February | °C/10 | 1,000 |
| tmean03 | Mean temperature in March | °C/10 | 1,000 |
| tmean04 | Mean temperature in April | °C/10 | 1,000 |
| tmean05 | Mean temperature in May | °C/10 | 1,000 |
| tmean06 | Mean temperature in June | °C/10 | 1,000 |
| tmean07 | Mean temperature in July | °C/10 | 1,000 |
| tmean08 | Mean temperature in August | °C/10 | 1,000 |
| tmean09 | Mean temperature in September | °C/10 | 1,000 |
| tmean10 | Mean temperature in October | °C/10 | 1,000 |
| tmean11 | Mean temperature in November | °C/10 | 1,000 |
| tmean12 | Mean temperature in December | °C/10 | 1,000 |
| tmin01 | Minimum temperature in January | °C/10 | 1,000 |
| tmin02 | Minimum temperature in February | °C/10 | 1,000 |
| tmin03 | Minimum temperature in March | °C/10 | 1,000 |
| tmin04 | Minimum temperature in April | °C/10 | 1,000 |
| tmin05 | Minimum temperature in May | °C/10 | 1,000 |
| tmin06 | Minimum temperature in June | °C/10 | 1,000 |
| tmin07 | Minimum temperature in July | °C/10 | 1,000 |
| tmin08 | Minimum temperature in August | °C/10 | 1,000 |
| tmin09 | Minimum temperature in September | °C/10 | 1,000 |
| tmin10 | Minimum temperature in October | °C/10 | 1,000 |
| tmin11 | Minimum temperature in November | °C/10 | 1,000 |
| tmin12 | Minimum temperature in December | °C/10 | 1,000 |
| tmax01 | Maximum temperature in January | °C/10 | 1,000 |
| tmax02 | Maximum temperature in February | °C/10 | 1,000 |
| tmax03 | Maximum temperature in March | °C/10 | 1,000 |
| tmax04 | Maximum temperature in April | °C/10 | 1,000 |
| tmax05 | Maximum temperature in May | °C/10 | 1,000 |
| tmax06 | Maximum temperature in June | °C/10 | 1,000 |
| tmax07 | Maximum temperature in July | °C/10 | 1,000 |
| tmax08 | Maximum temperature in August | °C/10 | 1,000 |
| tmax09 | Maximum temperature in September | °C/10 | 1,000 |
| tmax10 | Maximum temperature in October | °C/10 | 1,000 |
| tmax11 | Maximum temperature in November | °C/10 | 1,000 |
| tmax12 | Maximum temperature in December | °C/10 | 1,000 |
Soil
We collected available data on water capacity at 7 soil depths using SoilGrids250m [27]. We estimated Pearson correlation coefficients, r, between soil layers and then averaged the 4 first superficial (0, 5, 15, and 30 cm) and the 3 deeper (60, 100, and 200 cm) layers that were highly correlated, respectively.
Climate
We extracted climate data with a high spatial resolution (30 arcsec) using CHELSA v. 1.2 [28]. CHELSA is based on a quasi-mechanistic statistical downscaling global reanalysis and global circulation model that, in particular, reliably interpolates the amount of precipitation using an orographic rainfall and wind effect. The dataset consisted of 48 climatic, 19 bioclimatic, 4 drought- and 2 frost-related variables for the reference period 1979–2013 (Table 3 [35]). We extracted all modeled environmental values for each individually geo-referenced tree using the “extract” function of the R package raster [29]. The surrounding conditions (i.e., adjacent pixels) of each tree were incorporated by the bilinear interpolation method when extracting the data.
The local environmental contrasts varied among species and population pairs, most of which exhibited variability concerning elevation, temperature, precipitation, and water availability. Other local contrasts were based on radiation, soil water capacity, and topographic wetness index (among others). One special case is P. nigra, a heliophilous pioneer species found naturally in riverine areas. Given this specific habitat, local contrasts were largely bound to the distance of the individual trees from the riverbed and thus, e.g., to groundwater access or exposure to variation in the intensity and frequency of floods.
Data validation and quality control
The database has been checked for consistency at different stages by various researchers between 2018 and 2020. Raw data were submitted by all partners to the GnpIS multispecies integrative information system [36] using preformatted Microsoft Excel templates. Data files were harmonized, merged, and subsequently verified following several steps:
Missing data and dubious entries were checked manually by examining the original data files obtained from the partners and by cross-checking cases with field books.
Descriptive statistics were calculated and plotted for all variables including minima, maxima, means, and variances. Outliers were checked against original data records and corrected when necessary.
Covariables were plotted determining whether relationships were reasonable and following the most complete set of similar relationships (Fig. 3).
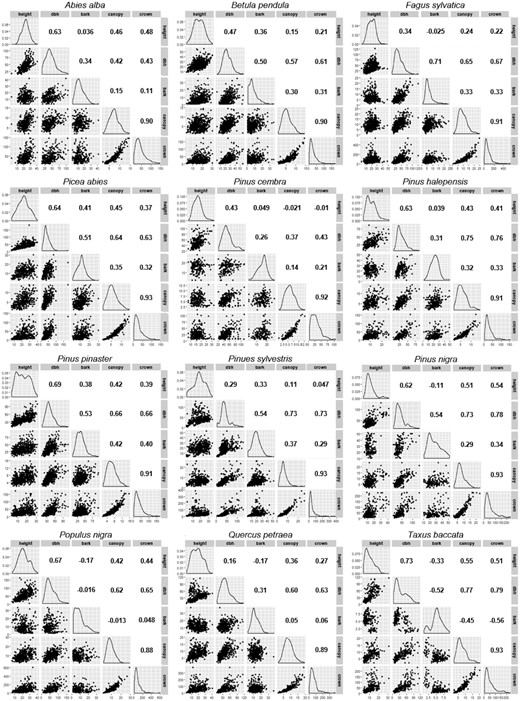
Scatterplots, distributions, and Pearson correlation coefficients, r, of GenTree phenotype measurements in the 12 selected European tree species.
Data Records
The data presented are structured in 4 independent csv files (GenTree_modelled_environmental_data.csv, GenTree_modelled_environmental_data_metadata.csv, GenTree_phenotypes_and_insitu_environmental_data.csv, and GenTree_phenotypes_and_insitu_environmental_data_metadata.csv) that can be merged using the site identifier (m04.site.id) or tree identifier (m06.tree.id). The same codes can be used to merge additional data, namely, from the GenTree Dendroecological Collection [16], the GenTree Leaf Trait Collection [17], and the GenTree Genomic Collection (T. Pyhäjärvi personal communication). The first file contains the modeled environmental data, the second its metadata, the third the individual phenotypic traits and the in situenvironmental data, and the fourth the metadata of the latter.
Data Availability
The data underlying this article are available in the GigaDB repository [31] under a CC0 license. Excel versions of the data are available from Figshare [32]. All the data are indexed in Table 3.
Abbreviations
BAAD: Biomass And Allometry Database; CHELSA: Climatologies at High Resolution for the Earth’s Land Surface Areas; CI: competition index; DBH: diameter at breast height; GPS: Global Positioning System; ISO: International Organization for Standardization.
Competing Interests
The authors declare that they have no competing interests.
Funding
This publication is part of the GenTree project, which was funded by the European Union's Horizon 2020 research and innovation program under grant agreement No. 676876 (GenTree). This work was also supported by the Swiss Secretariat for Education, Research and Innovation (SERI) under contract No. 6.0032.
Authors' Contributions
L.O., R.B., K.H., B.F., T.M., F.V., F.A.A., and S.C. coordinated sampling design. All authors contributed to the sampling design. L.O., R.B., K.H., B.F., T.M., F.V., F.A.A., and S.C. coordinated field sampling. All authors contributed to the field sampling. C.M. and M.B. compiled and assembled in situ measurements in the GnpIS database. B.D. extracted climatic and topographic data and derived environmental indices for all the sampling sites. R.B., L.O., B.Da., P.A., and C.M. curated data, checked quality, and prepared the datasets with metadata descriptions for sharing and potential reuse. L.O., K.H., B.Da., S.C., and B.F. wrote the manuscript. B.F. coordinated GenTree. All authors commented on an earlier version and approved the final version of the manuscript.
ACKNOWLEDGEMENTS
We thank Juri Nievergelt, Anne Verstege, Marina Fonti, Kevin Kleeb, Frederick Reinig, Enrica Zalloni, Claudio de Sassi, and Giacomo Poli for their field assistance. This work was performed using GnpIS, one of the facilities of the URGI platform (https://urgi.versailles.inra.fr/). We are also grateful to all the forest owners and national administrations for providing sampling permissions.
References
GnpIS:Genetic and Genomic Information System.
. Accessed 01.03.2021Copernicus: Europe's eyes on Earth.
Accessed 01.03.2021CHELSA: Climatologies at high resolution for the earth's land surface areas.
Accessed 01.03.2021GnpIS:Genetic and Genomic Information System.
. Accessed 01.03.2021