


ABSTRACT
Wastewater analysis offers objective and complementary information to illicit drug agencies by monitoring patterns of illicit drug consumption. In this study, wastewater samples from three different wastewater treatment plants in Sydney, Australia were collected in March 2016. Ten targeted drugs were analysed and temporal and geographical analyses were performed to obtain a better understanding of the type and amount of illicit drugs consumed in Sydney in comparison with similar studies conducted around Australia and in Europe. Among the targeted drugs, methamphetamine was consumed the most, followed by cocaine and 3,4-methylenedioxymethamphetamine (MDMA). Weekly patterns were observed where a peak during the weekend was present. The geographical analysis showed differences between the regions targeted. This observation may be related to socio-demographic aspects. The comparison of our study to other data sources from Australia showed a high consumption of methamphetamine in Sydney and Western Australia. The comparison between Sydney and different European cities revealed a difference in consumption, which is in line with traditional market indicators. The information obtained through wastewater analysis provides complementary information regarding illicit drug consumption, the size, and the evolution of the illicit drug market. This, ultimately, will assist authorities in making informed decisions.
Introduction
Illicit drug consumption is a global problem for authorities and policy makers. According to the world drug report 2017, about 250 million people, between the ages of 15 and 64 years, consumed at least one illicit drug in 2015 [1]. It is particularly problematic as regular illicit drug consumption can lead to dependence, disorders, or other diseases like acquired immunodeficiency syndrome (AIDS) [1]. Due to the extent of the drug problem and its harmful nature, monitoring the current situation of illicit drug use is necessary. The opportunity for more accurate estimation of drug consumption through the emergence of wastewater-based epidemiology (WBE) as a complementary approach to traditional monitoring methods exists.
Since the first implementation of WBE, many studies on wastewater analysis have been conducted for the identification of different types of drugs in different cities and countries, including Australia [2–5]. Researchers also analysed wastewater in music festivals [6] and prisons [7] to observe any possible differences in consumption patterns in a restricted population.
Scientists, as well as police agencies, recognized the power of information obtained by the analysis of illicit drug residues in wastewater, in particular for intelligence purposes [8]. In a forensic intelligence perspective, the combination of different information about drug consumption and drug trafficking can lead to a clearer and more accurate picture of the phenomenon [8–11]. Based on the combination of data from different sources, actionable hypotheses about the drug types present on the market and the ones de facto consumed can be established [8]. Thus, the combined analysis of data from different sources, including WBE, help authorities, like law enforcement agencies, politics, and treatment and harm reduction programs, to make informed decisions. Furthermore, preventive programs can be adjusted according to the observed changes in types and amounts of drugs consumed [8].
This study aimed at gaining an objective estimation of licit and illicit drug use in different areas of Sydney by using WBE to compare the local with the national and the international situation. The first objective was to evaluate geographical and temporal trends in Sydney’s drug consumption over a limited period of time (2 weeks). The second objective was to compare the results obtained in this study with data from other sources, including other WBE studies conducted in Australia [3]. The final objective was to identify possible international patterns by comparing the results of this project with the results of the European multi-city study [5].
Material and methods
Wastewater sample collection
Wastewater samples from three different wastewater treatment plants (WWTPs) in Sydney were collected and analysed over a period of 2 weeks in March 2016 (Table 1). A flow-proportional sampling method was used for collecting 17 samples from the inlet of WWTP-1 and two additional from the inlet of the remaining WWTPs (WWTP-2 and WWTP-3) using an autosampler (from 10 a.m. to 10 a.m. the following day). According to Ort et al. [12], the flow-proportional sampling method is the most recommended one for collecting a representative daily composite sample. It has a minimal sampling uncertainty of 5%–10% relative standard deviation. The samples were frozen once collected and stored for at least 1 day. In this study, 10 different parent drugs and metabolites, including two new psychoactive substances (NPS), were targeted. Two synthetic cathinones (mephedrone and methylone) were targeted as they accounted for 33.3% of all NPS seizures made in Australia in 2015–2016 [13]. These substances and their excretion rates are listed in Table 2.
Wastewater treatment plants (WWTPs) and their contributing population.
| WWTPs | Location | Contributing population (inhabitants based on census data) | Sampling days |
|---|---|---|---|
| WWWTP-1 | Urban | 1.5 million | 17 |
| WWWTP-2 | Urban | 280 000 | 1 |
| WWWTP-3 | Urban | 1.1 million | 1 |
| WWTPs | Location | Contributing population (inhabitants based on census data) | Sampling days |
|---|---|---|---|
| WWWTP-1 | Urban | 1.5 million | 17 |
| WWWTP-2 | Urban | 280 000 | 1 |
| WWWTP-3 | Urban | 1.1 million | 1 |
Drugs and metabolites analyzed in this study.
| Class | Illicit drug | Metabolite | Excretion rate/excretion factor | Reference |
|---|---|---|---|---|
| Cocainics | Cocaine | Benzoylecgonine (BE) | 30.58% (BE)/0.075 | [4, 16] |
| Opioids | Morphine | – | 48% (after heroin intake)/–; 74.6% (after morphine intake)/ – | [17] |
| Methadone | 2-Ethylidene-1,5-dimethyl-3,3-diphenylpyrrolidine (EDDP) | 19.7% (methadone)/ –; 25% (EDDP)/ – | [18] | |
| Amphetamine | Amphetamine | – | 29.12%/0.394 | [4, 14] |
| derivatives | Methamphetamine | – | 28.56%/0.39 | [4, 14] |
| 3,4-Methylenedixoymethamphetamine (MDMA) | – | 15.78%/0.225 | [4, 14] | |
| New psychoactive | Mephedrone | – | – | – |
| substances (NPS) | Methylone | – | – | – |
Chemicals and standards
Certified reference materials of all target compounds were purchased from Novachem (Collingwood, VIC, Australia). Hydrochloride salts of amphetamine, methamphetamine, 3,4-methylenedioxymethamphetamine (MDMA), mephedrone, methylone, cocaine, benzoylecgonine (BE), morphine, methadone, and 2-ethylidene-1,5-dimethyl-3,3-diphenylpyrrolidine (EDDP) were obtained as 1 mg/mL methanolic solutions. Hydrochloride salts of amphetamine-d5, methamphetamine-d5, MDMA-d3, mephedrone-d3, methylone-d3, cocaine-d3, BE-d3, morphine-d3, methadone-d3, and EDDP-d3 were obtained as 0.1 mg/mL methanolic solutions.
Liquid chromatography-mass spectrometry (LC-MS) grade methanol (MeOH) and formic acid were used for the instrumental analysis. Analytical grade hydrochloric acid (HCl, 36%) was used for the sample preparation. Milli-Q water (18.2 MΩ·cm) was obtained from a Satorius arium® Pro system (Goettingen, Germany). Evian water was purchased from Woolworths stores to have a standardized blank water for the experiments.
Sample preparation and instrumental analysis
Sample preparation and instrumental analysis were based on a slightly modified method developed by Been et al. [14, 15], including the two NPS. After collection, wastewater samples were filtered (0.7 µm glass microfibre filter, type GF/F) and acidified to pH = 2 using hydrochloric acid. Subsequently, the samples (150 mL) were spiked with deuterated standards of the target compounds and extracted using Oasis MCX (3 mL, 60 mg) solid phase extraction (SPE) cartridges. The SPE conditions are shown in Supplementary Table S1. Totally, 500 µL of the eluate were evaporated to dryness and reconstituted in 1 mL of H2O + 0.1% formic acid and methanol (VH2O + formic acid: Vmethanol = 90:10). The analyses of triplicates of each sample were carried out on a liquid chromatography (LC) system coupled to a triple quadrupole mass spectrometer (QqQ-MS). The details of the LC-MS/MS device are listed in the Supplementary Table S2. A Kinetex Core-Shell Biphenyl column (100 mm × 2.1 mm, 2.6 μm) was used for the separation of the analytes. A constant flow rate of 0.7 mL/min was applied, the autosampler was kept at 4 °C, and the column at 40 °C. Water with 0.1% formic acid (solvent A) and methanol with 0.1% formic acid (solvent B) formed the mobile phase. The QqQ-MS was operated in positive electrospray ionization (ESI+) mode with multiple reaction monitoring (MRM) involving two transitions per analyte. Details about the MRM parameters of each target substance and their deuterated standard can be found in Supplementary Table S3 and information about the ion source parameters are listed in Supplementary Table S4.
Method validation
The LC-MS/MS method was assessed for its limit of detection (LOD), limit of quantification (LOQ), linearity, bias/accuracy, and precision. The LOD (ng/mL) and LOQ (ng/mL) were calculated with a range of calibration standards (0.05–1 000 ng/mL). LOQ was determined by the lowest calibrant with a signal-to-noise ratio (SNR) greater than 10. LOD values were calculated by dividing the LOQ concentration by three. The linearity was determined by calculating the correlation coefficient (R2) of the individual substances. Accuracy and precision were determined by the extraction of low- and high-quality controls (QCs) in replicates (n = 5). Bias (%) was calculated to ensure that the low and high QCs did not exceed ±20% and ±15%, respectively. Precision was expressed as the coefficient of variation (CV, %) with ≤ 20% CV accepted. Mephedrone could not be quantified due to bias and precision values outside of the accepted tolerance. The results of the method validation can be found in Supplementary Table S5.
Calculations and assumptions
It was then normalized with the contributing population. Drug consumption per day and per 1 000 inhabitants was then estimated using the excretion rates presented in Table 2. The number of doses per 1 000 inhabitants was calculated considering the typical doses of methamphetamine, MDMA, and cocaine listed in the Illicit Drug Reporting System (IDRS) 2015 [19] and the Illicit Drug Data Report (IDDR) 2015–2016 [13]. The doses of methadone and morphine were not estimated as their presence in wastewater can be explained by different reasons, such as opioid substitution programs, pain treatments and heroin consumption (i.e. morphine being one of the major metabolites of heroin). The estimation of the dose per day per 1 000 inhabitants is thus problematic as different doses are required depending on the treatment.
Results and discussion
Geographical analysis
The geographical analysis was based on only one 24 h composite sample per WWTP (all collected on the same day in March 2016). This limited number of samples needs to be considered for the interpretation of the results. The comparison of the different locations only gives a first qualitative indication of the distribution of illicit drug consumption in the Sydney area. In the three locations investigated and among the 10 drugs and metabolites measured in this study, the amount of methamphetamine present in the wastewater was the highest, followed by BE (Figure 1). None of the NPS tested was detected in any of the three locations and EDDP, the metabolite of methadone was only found in WWTP-2 (Figure 1). The calculated doses per 1 000 inhabitants for methamphetamine, MDMA and cocaine showed similar results. Within these three substances, methamphetamine accounted for the highest doses consumed, followed by MDMA and cocaine. These observations confirmed the national Australian wastewater report’s findings which found that methamphetamine is the highest consumed illicit drug among the drug tested [4]. It is important to mention that cannabis was neither analysed in the national study nor in our study. Our results were also compared to the 2016 National Drug Strategy Household Survey (NDSHS) [20]. As with every household survey, outcomes should be interpreted carefully as these might be subject to selection and reporting biases. According to the survey, cocaine was, after cannabis, the most recently used illicit drug in the previous 12 months, with 2.5% of people aged 14 and older [20]. MDMA and methamphetamine came after with respectively 2.2% and 1.4% of people reported having used these illicit drugs during the last 12 months. The use of NPS was the least reported [20]. The survey of people who inject drugs (PWID), performed by Stafford and Breen [19], displayed that methamphetamine was recently used (in the last 6 months) by 72% of the PWID interviewed, whereas cocaine was only consumed by 13%. Hence, there are some differences between the results from the surveys and what is observed in this wastewater study. This difference can be explained by several factors. The surveys targeted two different populations. WBE gives detailed information about the amount used without distinguishing the typology of users whereas the survey focuses either on the general population (household survey) or on a specific subgroup of users (PWID). These two methods give different outcomes as different populations are targeted. Thus, methamphetamine consumers might be less represented in the NDSHS survey as it mainly targets households to obtain an estimation of the number of people that consume alcohol, tobacco and drugs in Australia. On the other hand, their consumption can be measured through wastewater analysis. Even though we measured the amount of methamphetamine present in Sydney wastewater, the comparison of these three data sources is interesting and gives complementary information about methamphetamine and cocaine consumption in Sydney and Australia in general. Furthermore, it is known that clandestine methamphetamine laboratories are present in Australia [13]. As there was no metabolite of methamphetamine analysed, it is possible that one part of the methamphetamine detected in the wastewater is due to direct discharge of the laboratories instead of consumption. However, it is highly unlikely that the direct discharge is the source of the high methamphetamine presence in Sydney wastewater. If this happens, it is likely to be limited to a few single occasions that would stand out of the usual levels measured in wastewater.
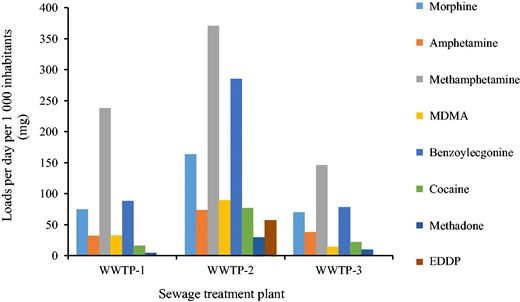
Loads per day per 1 000 inhabitants of the targeted drugs and metabolites detected in the samples collected from WWTP-1, WWTP-2, and WWTP-3. WWTPs: wastewater treatment plants; MDMA: 3,4-Methylenedioxymethamphetamine; EDDP: 2-Ethylene-1,5-dimethyl-3,3-diphenylpyrrolidine.
In terms of geographical differences between the WWTPs, the results should be interpreted very carefully as they originate from the analysis of only one sample per WWTP. They showed that WWTP-2 has the highest amount of the targeted drugs and their metabolites. WWTP-3 showed the lowest loads for all targeted compounds. The high consumption of amphetamine derivatives in the parts of Sydney served by WWTP-1 and WWTP-2 could be explained by the fact that the areas covered are very touristic and have a distinctive nightlife. The region covered by WWTP-3 is a calmer residential location. Nevertheless, the high presence of methamphetamine in all three locations compared to the other drugs may indicate that methamphetamine is used on a regular basis. The considerably high consumption of cocaine in the region served by WWTP-2 could also be explained by the touristic and expensive infrastructure of this region.
The loads of morphine and methadone did not show a substantial difference between the different areas in Sydney. Both substances are used for clinical purposes such as pain relief or replacement therapies for opioid dependence [18]. Their presence in wastewater can, therefore, have different reasons, which need to be further investigated including other data sources like medical records and information about heroin substitution treatment programmes. None of the targeted NPS were detected in the samples analysed. According to the National wastewater report of Australia [4], it is possible that mephedrone and methylone are mainly excreted as their metabolites. Kamata et al. [21] showed that the main metabolite of methylone is 4-hydroxy-3-methoxymethcathinone (HMMC). In rats, HMMC has an excretion rate of 26%, whereas the excretion rate of the unchanged methylone is only about 3%. Linhart et al. [22] identified six phase I metabolites of mephedrone, with normephedrone as its main metabolite. The sum of free and conjugated normephedrone accounts for 30% of the total metabolites excreted [22]. Thus, the absence of the two targeted NPS in all three locations could be due to the fact that the parent compounds instead of the metabolites were analyzed in this study. Along with the possibility that NPS are not widely consumed in Sydney, another explanation could be the fact that less quantity of NPS is necessary to obtain similar effects as the conventional illicit drugs, resulting in lower concentrations in wastewater. Thus, their detection becomes more difficult.
Temporal analysis
Figure 2 shows the results of the weekly pattern of the analysed drugs present in the wastewater collected in WWTP-1. Some measured values of methamphetamine exceeded the upper limit of the calibration curve and a re-analysis was not possible. Therefore, the values of the upper limit of quantification were used to indicate these days in the diagram. Methylone is not shown as the concentrations detected were below the LOQ for most of the analyzed days. The days when methylone and mephedrone were detected were weekdays. An increased detection of NPS during weekends and thus a more festive use of these substances could not be highlighted.
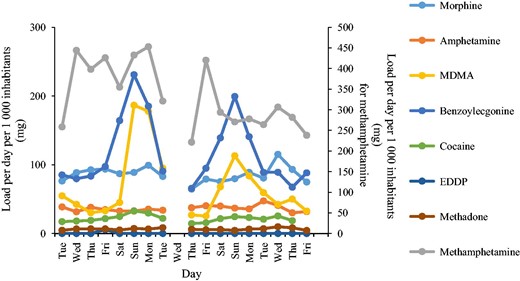
Loads per day per 1 000 inhabitants of all analysed drugs in samples collected during a 2-week period in WWTP-1. Due to the high loads of methamphetamine, it is represented using a secondary axis. WWTPs: wastewater treatment plants; MDMA: 3,4-Methylenedioxymethamphetamine; EDDP: 2-Ethylene-1,5-dimethyl-3,3-diphenylpyrrolidine.
In general, differences throughout the week were observed. For this given time period, some of the targeted illicit drugs seemed to be used for festive reasons like MDMA and cocaine, whereas others (e.g. morphine) were rather consumed constantly (Figure 2). The analysis also showed a high variation of methamphetamine during the first week of analysis. During the first week of the sampling period, a major yearly public event including many parties and daily festivals was held. Thus, this event could have had an impact on the amount of these drugs in wastewater. The results of the weekly analysis also demonstrated an increased consumption of MDMA and cocaine during the weekend. MDMA and cocaine are known to be used for recreational and festive purposes. Thus, an increase of these substances in the wastewater during weekends is plausible. This effect was already observed by several other studies [2, 23, 24]. Methamphetamine showed a constantly high load in the first week. In contrast to MDMA and methamphetamine, amphetamine loads were stable throughout the 2 weeks. This indicated a regular consumption of amphetamine. Besides, the amount of amphetamine present was considerably lower than MDMA and methamphetamine. It is known that amphetamine is a metabolite of methamphetamine. As the load of methamphetamine is less regular and about eight times higher than that of amphetamine, it can be assumed that only a small part of the amphetamine present in the wastewater is due to its excretion as a methamphetamine metabolite [4]. Methadone and its metabolite EDDP were regularly found but in small quantities. This indicated a regular excretion of methadone and morphine into wastewater, either due to their use as a painkiller or as a substitute for opioids in withdrawal therapy. The presence of morphine can also indicate a consumption of heroin. The number of opioid substitution treatment recipients per 100 injecting drug users may explain the low methadone amount in the Sydney wastewater. Indeed, this percentage is 69% in Australia compared to more than 90% in Europe [25].
National comparison
In this section, our results were compared nationally with studies from Lai et al. [3] and the Australian Criminal Intelligence Commission [4] with the aim of highlighting similarities or differences between the studies and also to identify possible specific Australian trends. Figure 3 compares the methamphetamine, MDMA, and cocaine consumption results obtained in WWTP-1, Sydney, with the ones obtained by Lai et al. [3] and the national average [4]. Methamphetamine consumption in the WWTP-1 area of Sydney was in good accordance with the national average consumption. Our results were similar to the methamphetamine consumption in cities in Victoria [3]. The cities analysed by Lai et al. [3] located in NSW showed a lower methamphetamine consumption compared to the present study. A possible reason for the observation difference could be the sampling period as Lai et al. [3] collected samples in April and May 2015 and we sampled in March 2016. It is also possible that the purity of methamphetamine on the market was higher in our study period. Another reason for the difference in the amount consumed could be that Lai et al. [3] selected different WWTPs than in our study. No detailed information concerning the WWTPs selected by Lai et al. [3] was available.
![Comparison of the consumption of methamphetamine (blue), 3,4-methylenedioxymethamphetamine (MDMA) (green), and cocaine (orange) between the different States in Australia [3] and WWTP-1. ACT: Australian Capital Territory; QLD: Queensland; NSW: New South Wales; NT: Northern Territory; VIC: Victoria; WA: Western Australia; WWTP-1: wastewater treatment plant 1; A: city 1, B: city 2; C: city 3; D: city 4; QLD-C, QLD-D and NT-A: rural cities.](https://oup.silverchair-cdn.com/oup/backfile/Content_public/Journal/fsr/4/2/10.1080_20961790.2018.1500082/1/m_fsr_4_2_141_f3_c.jpeg?Expires=1747921594&Signature=2FVpkB84AM9G1JnNzZFyo4Kakm5Nyk8~~oURJJIBTrkkCpdMKWDvOQaAemoz4Dyn-rlerGnbkexghp7yHxZKAO0LSpzqUte~qlEKoTnqSAhFyFwD-Fz4L9xckBMYZAmg03cy-BEZfO~LawxW0TrJKxzEu6ecVIkffima9fx~Mw3DKLtRKkk3S~TN7~i-bXXAnC0lwNfwFK96g2ojbmb6Cge9phoBggG7NhRtCV5prz~iOWF1IHexF0riXCv7bT9pFJyEvbak4l7KKq9NQWsr18uNh71JzcIONHHCu-uh-iOkX-tS8IqZzraI7ymMZOjD9Ema~PQU6GeuxlwncNPlYQ__&Key-Pair-Id=APKAIE5G5CRDK6RD3PGA)
Comparison of the consumption of methamphetamine (blue), 3,4-methylenedioxymethamphetamine (MDMA) (green), and cocaine (orange) between the different States in Australia [3] and WWTP-1. ACT: Australian Capital Territory; QLD: Queensland; NSW: New South Wales; NT: Northern Territory; VIC: Victoria; WA: Western Australia; WWTP-1: wastewater treatment plant 1; A: city 1, B: city 2; C: city 3; D: city 4; QLD-C, QLD-D and NT-A: rural cities.
The MDMA consumption in WWTP-1 was higher than the average Australian consumption (Figure 3). However, looking at the national wastewater report [4] in detail, it was observed that one WWTP in NSW was among the WWTP with the highest MDMA consumption (specific results of the national report are not listed here but can be found in the national wastewater report [4]). Based on the information of the national wastewater report, it cannot be determined whether the WWTP with the high consumption was the same one as the one analysed in our study. Besides, the concentrations recorded in WWTP-1 fell within the range of MDMA consumption for NSW listed in the national report [4]. Lai et al. [3] showed that the consumption of MDMA in the different states was close to the Australian average (Figure 3), but slightly below the authors’ results.
In regard to the cocaine consumption, it was observed that the urban cities analysed by Lai et al. [3] and the results in WWTP-1 were close to the national average taken from the report of the Australian national wastewater drug monitoring program [4] (Figure 3). New South Wales had the highest cocaine consumption, including the results of our study. The rural towns (QLD-C, QLD-D, and NT-A) analysed by Lai et al. [3] were significantly below the average. This observation was confirmed by the national wastewater report [4].
The national wastewater report also gave information about the consumption of NPS [4]. As mentioned in section “Temporal analysis”, NPS were rarely detected in our study. However, methylone was detected in more samples than mephedrone. Looking at the results of the national wastewater report [4], it was observed that in NSW, methylone was detected 16 times whereas mephedrone was only detected three times. Although limited, our results seemed to be in accordance with the results of the national report. No indications about the presence of methadone in the wastewater were neither stated in the report of the national wastewater drug monitoring program [4] nor in the study of Lai et al. [3].
The national comparison revealed several variations in the illicit drug consumption in Australia. Despite WBE is depicted as an objective indicator of illicit drug abuse in a given area, WBE is influenced by many known and unknown uncertainties, e.g. in-sewer stability of illicit drugs, substance purity and the limited pharmacological knowledge (e.g. excretion pathway of NPS). Thus, it is of major importance to combine wastewater results with other indicators like surveys, seizures, and arrest data. Multiple geographical and temporal wastewater measuring campaigns are also necessary to obtain a better understanding of the illicit drug abuse and to reduce some of the uncertainties.
International comparison
In this section, the loads of methamphetamine, MDMA and cocaine, based on BE, were compared internationally, in particular to the results of the multi-city study of the European Monitoring Centre for Drugs and Drug Addiction (EMCDDA) [5]. It aimed to highlight similarities and differences between Sydney and European cities. The comparison was based on the loads per day per 1 000 inhabitants, the amount of metabolite/parent compound excreted during the day. Figure 4 shows the estimates for the loads of the methamphetamine in European cities [5] and the results of the second week analyzed in Sydney.
![Comparison of methamphetamine loads between European cities [5] and WWTP-1.](https://oup.silverchair-cdn.com/oup/backfile/Content_public/Journal/fsr/4/2/10.1080_20961790.2018.1500082/1/m_fsr_4_2_141_f4_b.jpeg?Expires=1747921594&Signature=fFcNtyvT3mJ8MRW~m9KEOxRyyu~Guks8fczT5G1OM8D1C4BnOu3LduoupCsw~Vzu9Zu7gZSjp961mz9zbO4nHeUR-1uztGJ1cChWlOhv9ImbYCMU9VECX6W0bIrni8f769JFnN7nZrAGUu746PkiVn7C7uv2SBdfxUShRtI2n9XyQgm6hHeHV8xNlipaxO75vCyemAF-Hm-8jnKzyW1UmVYWHC6HehgyC-kg7l1f06xUGo~5ocgKP1WkHW62A--uxGcT109kQkgl7dyQgDAUHNgSG7X4MgHRjKTJgH0TCExjyHPHeE18p5Dt21WrFZr7g37j5lp1FdUePvCVQC~bmA__&Key-Pair-Id=APKAIE5G5CRDK6RD3PGA)
Comparison of methamphetamine loads between European cities [5] and WWTP-1.
Methamphetamine detected in wastewater in 2016 in Europe and Sydney
The comparison revealed that Sydney (Australia) was ranked third after Bratislava and Piestany (Slovakia) for methamphetamine. These three cities as well as Budweis (Czech Republic) showed significantly higher loads of methamphetamine compared to European cities located in the central and western part of Europe. According to the World Drug Report 2017 [1], North America, South-East Asia and Oceania remain the dominating methamphetamine markets. All of these regions, including Australia have their own illicit methamphetamine production sites [1, 13]. In Europe, methamphetamine is mainly seized in the Czech Republic, Latvia, Lithuania, and Slovakia and the main methamphetamine production country is the Czech Republic [26]. Thus, the location of the production countries and the ease of access to this substance can explain the high methamphetamine consumption in Sydney and cities in Eastern Europe [13]. Besides, the supply route might have an influence on the consumption as well. Neighbouring countries of Australia, such as countries situated in East and South-East Asia, have a large methamphetamine market and supply many countries, Australia included [1].
MDMA detected in wastewater in 2016 in Europe and Sydney
Figure 5 compares the loads of MDMA in different cities in Europe and Sydney. Similar to methamphetamine, the location of the laboratories producing MDMA seems to have an influence on the consumption patterns. According to the European Drug Report [26], the main production and exporting countries are the Netherlands and Belgium. It is known that Australia also has some MDMA clandestine laboratories [13].
![Comparison of 3,4-methylenedioxymethamphetamine (MDMA) loads between European cities [5] and WWTP-1.](https://oup.silverchair-cdn.com/oup/backfile/Content_public/Journal/fsr/4/2/10.1080_20961790.2018.1500082/1/m_fsr_4_2_141_f5_b.jpeg?Expires=1747921594&Signature=hq8iXTqxwVLerSbW10pJWRQI2cF4rH7IBwEGNk~bbkj2GBei8tA7WH8cfcx0UsvE390DKjdcHU8sMRdc-2LVK0bTq~7MpUga8MeJm1qx9AwhFaWBrsWSOXp4qkyUrtuNZ~6P5RBv66PihQukgdDALRSFXc6jkNaPnwuEKLamng0Cy60aLuKZIt3P3OMkkcMOKLSG3lXA-o8ihLCMgT0JB5r7xsoYl3C9XqQJLb7PyoHcDoxhFC4HJX2ojjjLWooYcB53~naKoCNuDbVrNEHKXDhfWLWbqqT5fLl~yaPzUAAY23kLiQA3w~bV11C7gZj4j6Cu4MRToqNBXzEAT32vYw__&Key-Pair-Id=APKAIE5G5CRDK6RD3PGA)
Comparison of 3,4-methylenedioxymethamphetamine (MDMA) loads between European cities [5] and WWTP-1.
Cocaine detected in wastewater in 2016 in Europe and Sydney
Figure 6 compares the loads of benzoylecognine, the main metabolite of cocaine. BE showed a completely different pattern compared with methamphetamine. Sydney had low loads of BE and was situated at the bottom of the ranking. Cocaine was highly consumed in Europe, especially in Western and Central European cities, such as London, Barcelona, and Zurich. According to the European Drug Report [26], cocaine is mostly seized in Western and Southern European countries. This is confirmed by the European wastewater data [5]. Looking at the production countries and supply routes, a link can be drawn. Cocaine is mainly produced in South America (Peru, Bolivia, and Colombia). The main trafficking routes are to Western and Central Europe via Central America [1]. The World Drug Report 2017 [1] indicates that West Africa is a transit country for cocaine trafficking. There are also cocaine trafficking routes to Australia via Chile, Brazil, the United States, the United Arab Emirates, and Asia. However, these trafficking routes are not the main supply routes [1]. There are multiple and shorter supply routes to Europe while these routes to Australia are longer and not diverse. Consequently, the differences observed in loads can be due to the geographical locations of these countries in relation to the producing countries.
![Comparison of benzoylecgonine loads between European cities [5] and WWTP-1.](https://oup.silverchair-cdn.com/oup/backfile/Content_public/Journal/fsr/4/2/10.1080_20961790.2018.1500082/1/m_fsr_4_2_141_f6_b.jpeg?Expires=1747921594&Signature=nEc6iUXMK3mkA0tBXIthqKgXVX9rYfo3o6BCRKxFuaaK3B99e8VxRJ97bh9SbiQuY3s7hwwbNIJxIqF7Dc2PoqC~M89UyFE1gFZWjD0kV8hl2LKRveHhEO9tmIfvLjYXVwY0lKr6xMJujwaHnUEEPx2aTkwItitlbd2m~c1VUa2KoYhBjbgnX9V2qTeA4kkptrIyVfjaBREm0gisa~ytUcCIHJMAg0NcCxY-cRlYP7p0Uz4YhGGYkwUfsZbgEDM0w5Nm3YY-pCfrfOW145ANRwbxk5mrUUh8eIeYwBGjmKVaDCScxwprE3J0Uhc0pUGq0eAL4GCaV9rVCJSKSQ3Nsw__&Key-Pair-Id=APKAIE5G5CRDK6RD3PGA)
Comparison of benzoylecgonine loads between European cities [5] and WWTP-1.
In summary, differences between several European cities and Sydney were highlighted, in particular regarding methamphetamine and cocaine’s consumption. Methamphetamine was mainly consumed in Eastern European cities and Sydney, whereas cocaine was mainly consumed in Western and Southern European cities. Cities with a high amount of methamphetamine present in the wastewater showed a minor amount of cocaine in the wastewater and vice versa. The supply route and production countries seem to play an important role in these specificities. The easy access to certain substances in specific regions could result in higher consumption of these substances, highlighted by their higher amount in wastewater. Furthermore, the limited availability of cocaine can also contribute to a higher consumption of methamphetamine that may be used as a replacement.
Conclusion
This study showed preliminary results of the illicit drug use in Sydney. Out of the drugs analysed, methamphetamine was the most present illicit drug in Sydney wastewater. The findings strengthened the knowledge obtained by surveys and seizures. The geographical analysis gave a first insight about possible hot spots of illicit drug use in Sydney. In the future, complementary geographical wastewater studies about the distribution of illicit drug abuse in Sydney should be performed. They can provide further information to obtain a clearer view of the current illicit drug phenomenon. The information obtained by this initial temporal analysis indicated an increase in the illicit drug use during the yearly public event held at the beginning of March. This observation can help to develop specific and targeted prevention campaigns. Furthermore, the national comparison revealed some similarities and differences.
However, like any method, WBE and our study have some limitations. This study analyzed a limited number of samples. Thus, the results obtained are first indications about geographical and temporal trends in illicit drug consumption in Sydney. In the future, further wastewater measuring campaigns should be performed. The number and period of these campaigns have to be chosen wisely. Furthermore, the metabolism of certain substances is not well known, so that finding the appropriate metabolite for the analysis and calculation of the consumption can be difficult. The authors experienced some analytical issues with the analysis of 11-nor-9-carboxy- -tetrahydrocannabinol (THCCOOH). The deuterated standard of THCCOOH was not detected using the chosen parameters. In general, the instrumental analysis of THCCOOH is difficult due to several reasons, such as its adsorption on solid particles in the wastewater or its presence in the form of THCCOOH-glucuronide in the wastewater. Many laboratories that participate annually in the European wastewater study [5] encountered analytical issues when analysing THCCOOH. Therefore, up until now, the results of the analysis of THCCOOH were never mentioned neither in the European wastewater study [5] nor in the Australian national report [4]. As we also experienced analytical issues, we decided to exclude the results of THC and its metabolites from this study.
Perhaps more than pure technical improvements, further development should focus on the triangulation of data, including wastewater data, drug checking, surveys, seizures, and arrest data, within forensic intelligence to obtain a more detailed understanding of the licit/illicit drug phenomenon [9, 27]. Drug checking data give information about the composition of illicit drugs. Several studies on cryptomarkets showed the benefit of combining different sources of information, like the physical, chemical, and the digital data [10, 11, 25, 28]. Morelato et al. [28] used triangulated data, including WBE data, to provide a more comprehensive understanding of drug trafficking and consumption. This, in turn, can better inform policy makers. This approach was employed by Been et al. [8], who evaluated the added value of wastewater data for law enforcement agencies in Switzerland. They assessed the usefulness of the combination of wastewater analysis and intelligence derived from police work (e.g. investigations and seizures). Combining seizure information with WBE can help monitor the illicit drug market’s evolution and dynamism as well as evaluate the efficiency of investigations [8]. Although difficult as the police target drug sellers rather than users, this approach can help assess the importance of specific criminal groups [8]. The information obtained through police investigations can also be of advantage for WBE. Seizures can reveal the rise of new substances on the drug market. This information can serve as a guide for the screening of new substances in wastewater to investigate their consumption in the general population. Information derived from investigations can allow strengthening WBE results as wastewater analysis is affected by many uncertainties [8].
In conclusion, the illicit drug market is complex and constantly evolving [13], multiplying the number of sources is essential to become proactive in the development of sound strategies to reduce the demand, supply, and harm of licit/illicit drugs. This study showed that the gathering of relevant information from a variety of sources is necessary to optimize the effectiveness of both public policy and operational actions. In this context, WBE is an important source of information that cannot be under-estimated.
Acknowledgments
The authors would like to thank Sydney Water, in particular Ian MacKenzie for the provision of Sydney’s wastewater samples. Special thanks to Danielle Golgini for assisting in the method validation.
Compliance with ethical standards
No ethical clearance was required for this research. The research complied with the Australian Code for the Responsible Conduct of Research.
Disclosure statement
No potential conflict of interest was reported by the author(s).
Funding
Marie Morelato would like to acknowledge the UTS Chancellor's Postdoctoral Research Fellowship. Frederic Been acknowledges the Swiss National Science Foundation [SNSF_P2LAP2_164892] and the Research Foundation – Flanders [FWO, project 12Y8518N] for his postdoctoral fellowship, as well as the INTERWASTE [grant number 734522] project funded by the European Commission [grant number Horizon 2020].
References
Author notes
Supplemental data for this article can be accessed here.
