


Abstract
Our microbiota presents peculiarities and characteristics that may be altered by multiple factors. The degree and consequences of these alterations depend on the nature, strength and duration of the perturbations as well as the structure and stability of each microbiota. The aim of this review is to sketch a very broad picture of the factors commonly influencing different body sites, and which have been associated with alterations in the human microbiota in terms of composition and function. To do so, first, a graphical representation of bacterial, fungal and archaeal genera reveals possible associations among genera affected by different factors. Then, the revision of sequence-based predictions provides associations with functions that become part of the active metabolism. Finally, examination of microbial metabolite contents and fluxes reveals whether metabolic alterations are a reflection of the differences observed at the level of population structure, and in the last step, link microorganisms to functions under perturbations that differ in nature and aetiology. The utilisation of complementary technologies and methods, with a special focus on metabolomics research, is thoroughly discussed to obtain a global picture of microbiota composition and microbiome function and to convey the urgent need for the standardisation of protocols.
INTRODUCTION
Possibly compared with any other ecosystem, our understanding of the microbiota has experienced an incomparable revolution during the 20th century (Blaser 2014). The ‘microbiota’ is the set of microorganisms that share our body space and may be commensal, symbionts or pathogens. The term ‘microbiome’ refers exclusively to the genomic content of the microbiota. In each of the different locations, such as the skin (Grice and Segre 2011), the mucosa (Moen et al. 2016), the gastrointestinal tract (Claesson et al. 2011; Falony et al. 2016), the respiratory tract (Biesbroek et al. 2014), the urinary tract (Whiteside et al. 2015), the vagina (Martin 2012), the mammary gland (Urbaniak et al. 2014) or the placenta (Aagaard et al. 2014), we can find microorganisms that form complex and distinct ecosystems adapted to the peculiarities of each niche (Ding and Schloss 2014; Li et al. 2014; Abreu and Taga 2016). Overall, rough estimates suggest that our body is occupied by bacteria belonging to at least 5000 genera (Table 1). Their total numbers are of the same order as the number of human cells in a ‘reference 70-kg human’ (Sender, Fuchs and Milo 2016).
Rough estimates of size and biodiversity across body sites in an adult body.
| Body site | Rough surface area1 | Rough number of genera1 |
|---|---|---|
| Gastrointestinal tract | 300–400 m2 | 1183–3180 |
| Oral cavity | 215 cm2 | 600 |
| Respiratory tract | 160 m2 | 314 |
| Skin | 1.8 m2 | 113 |
| Urinary tract | 350 cm2 | 20–500 |
| Vagina cavity | 90 cm2 | 282 |
| Body site | Rough surface area1 | Rough number of genera1 |
|---|---|---|
| Gastrointestinal tract | 300–400 m2 | 1183–3180 |
| Oral cavity | 215 cm2 | 600 |
| Respiratory tract | 160 m2 | 314 |
| Skin | 1.8 m2 | 113 |
| Urinary tract | 350 cm2 | 20–500 |
| Vagina cavity | 90 cm2 | 282 |
These are rough estimation based on bibliographic records. The number of genera may be underestimated because the quantification depends on sequence coverage and size of the population cohorts. Note that it has been estimated that only characterising our gut microbiota would require sampling of ∼41 000 individuals (Falony et al. 2016).
From birth a stable symbiotic relationship exists between the microbiota and our cells, whose role in our life and medical condition is, beyond doubt, indispensable and beneficial. Their associations are currently the object of ongoing investigation (Fujimura et al. 2010; Bull and Plummer 2014; Conlon and Bird 2014; May et al. 2016). This microbiota-health axis evolves over time and adapts to the distinct habitats characterising our body (Yatsunenko et al. 2012; Ding and Schloss 2014; Goodrich et al. 2016). Due to its vast metabolic capacity, the microbiota has been considered as an ‘organ’ of our body, presenting phenotypic changes with ontogeny from birth until death (Moya and Ferrer 2016). Its composition presents peculiarities and characteristics that can be altered due to the genetic background, diseases, diet and interaction with the environment (Bashan et al. 2016; Noecker et al. 2017). However, our microbiota is highly resilient, often recovering its natural original status, which is known as ‘eubiosis’ (Moya and Ferrer 2016). By contrast, on other occasions, a strong imbalance in the taxonomic composition of the microbiota can be induced, which is known as ‘dysbiosis’ (Shin, Whon and Bae 2015). Dysbiosis can occur over a few days (Pérez-Cobas et al. 2013b) or be acquired slowly during our lifetime.
Exploring dysbiosis by total community phenotyping
The majority of studies have analysed associations between local or external ‘perturbations’ and dysbiosis by reporting alterations in microbial taxa. In this respect, patients or individuals not subjected to perturbations are compared to healthy individuals or to individuals not subjected to the perturbation, respectively. In some cases, time-course changes are evaluated. Hereon, we use the term ‘perturbation’ to refer to many factors such as host feeding behaviour, therapies and diseases associated with alterations in our microbiota. Other synonymous terms used in this review are ‘factors’ or ‘covariates’. Traditionally, changes in the microbiota structure have been characterised using classical cultivation techniques, but today we know that the majority of this ecosystem is uncultivable (Browne et al. 2016). The utilisation of molecular tools based on the sequencing of the 16S rDNA genes generated from total DNA, especially the second-generation sequencing (so-called next generation sequencing) (Keller et al. 2014; Noecker et al. 2017), enables the identification and classification of the species without requiring pre-cultivation. For the purpose of this review, this technique is referred to as ‘phenotyping’. This approach was used to show that one third of our total body microbiota is common to most people, while two-thirds are specific to each individual (Li et al. 2014). By focusing on the gut microbiota, a recent study revealed that 14 out of 664 genera conforms the core microbiota (Falony et al. 2016). This analysis can also be used to estimate some of the health status indicators of the microbiota, its richness (quantity of microorganisms) and its biodiversity (quantity of species) (Knecht et al. 2014). Both parameters are commonly evaluated with the alpha biodiversity index, such as Shannon, which reflects the heterogeneity of a community on the basis of the number of species present, and Chao, which reflects the abundance and representation of each species. Due to the individual and temporary particularities of the microbiota, it is difficult to establish what defines a normal and healthy microbiota, but a consensus exists that the more species it harbours the better, with an equilibrium among species (Tuddenham and Sears 2015).
The previous studies cannot determine associations with microorganisms in active and potentially active state. This is because they also take into account dormant, dead and quiescent bacteria, as they are also present in any sample (Peris-Bondia et al. 2011; Gosalbes et al. 2012; Potgieter et al. 2015). Therefore, 16S rDNA analysis cannot determine which species are activated after the initiation of the perturbation. Active microbes will constitute the first barrier to change or defence when faced with a local or external perturbation. Their identities and abundances can be estimated by monitoring the 16S rRNA amplicons generated from cDNA or so-called RNA-seq (Bao et al. 2015). They can be also estimated by the analysis of 16S rDNA amplicons generated from DNA from viable cells, previously separated by flow cytometry from damaged or dead cells (Džunková, D’Auria and Moya 2015). This analysis differs from that of the total (inactive and active) species present in the microbiota, indicated by the amounts of the 16S rDNA genes generated from total DNA (Franzosa et al. 2014; Knecht et al. 2014). Also, the taxonomic binning of sequences from genes found to be expressed in the metatranscriptome (Pérez-Cobas et al. 2013b) and proteins found to be synthesised in the metaproteome (Ferrer et al. 2013; Serrano-Villar et al. 2016a) can also help to reveal the active community members because they are transcriptionally active when confronted with a given perturbation.
Exploring dysbiosis by metagenomics, transcriptomics and proteomics
Recent observations that different intestinal populations are metabolically redundant indicate that taxonomic diversity is hardly relevant for inferring functional traits (Moya and Ferrer 2016). That is, one cannot infer associations between perturbations and altered microbial functions from taxonomic data whenever they refer to dead, quiescent or active microbes, as multiple microbial groups are known to be functionally redundant or equivalent. For example, some authors have demonstrated that the microbial metabolism remains constant over time across individuals despite high variability in taxonomic composition (Consortium 2012). For this reason, the utilisation of complementary tools of massive data generation and analysis was developed to reveal associations between common perturbations and microbial functions in humans, by means of exploring links with altered gene content and expression, protein synthesis and metabolite production (Bikel et al. 2015; Abreu and Taga 2016; Aguilar-Pulido et al. 2016). The development of such techniques and tools is responsible for the so-called microbiome revolution coined by Blaser (2014).
Thus, we have begun to apply metagenomics and metatranscriptomic studies based on high-throughput DNA and cDNA sequencing, which despite being computationally expensive (Muir et al. 2016), enables us to quantify alterations in the content and expression level of microbial genes (Gosalbes et al. 2011, 2012; Greenblum, Turnbaugh and Borenstein 2012; Lepage et al. 2013; Lim et al. 2013; Li et al. 2014; Pérez-Cobas et al. 2014; Bashiardes, Zilberman-Schapira and Elinav 2016; Martínez et al. 2016). Here, metagenomics refers to the analysis of the genetic material (DNA) recovered directly from the microbiota, whereas metatranscriptomics refers to the analysis of the total content of gene transcripts (tRNA copies) in the microbiota. An example of results obtained through a metagenomic approach is the recent finding that only 1 out of 33 microbial genes in our gut is common to most people (Zhu et al. 2015), which would suggest high interindividual genomic variability. Additionally, although technically challenging when confronted with extremely complex ecosystems such as the human microbiota, metaproteomics tools have also been used to assess whether changes in population structure and gene expression are linked to changes in protein synthesis (Pérez-Cobas et al. 2013b; Serrano-Villar et al. 2016a,b). We use the term metaproteomics to refer to the analysis of microbial proteins that are actively synthesised by the microbiota. Similar to the differences between 16S rDNA and rRNA analysis, while metagenomics can provide associations between perturbations and altered total functions (from dormant, dead, quiescent and active bacteria) on the basis of sequence-based predictions from genes being sequenced and annotated, metatranscriptomic and metaproteomic tools provide associations with functions that become part of the active metabolism (Pérez-Cobas et al. 2013b).
Exploring dysbiosis through metabolomics
Over the last 10 years, we have increasingly begun to appreciate the significance of metabolite profiling (Mischke and Plösch 2016; Vernocchi, Del Chierico and Putignani 2016) and its potential to have a profound impact on medical practice (Beger et al. 2016). This technique offers the opportunity to measure metabolites that are the final result of the action of the microbiota, independently of its community composition, gene expression and protein synthesis, growth characteristics, gene mutations and protein structures (Goodacre 2007). The metabolites absorbed and/or produced by the action of the microbiota are the downstream products of gene and protein expression, whose quantification has been demonstrated to be the most reliable snapshot of changes in metabolic performance of the microbiota under any condition (Moya and Ferrer 2016). Metabolite profiling thus constitutes the next logical step beyond descriptive studies of community composition, gene composition (metagenomics), gene expression (metatranscriptomics) and protein expression (metaproteomics), as it may provide deeper insights into the associations between any perturbation and the ‘metabolic changes’ of the active fraction of the microbiota under any condition. Here, ‘metabolic changes’ denote alterations in the level of metabolites (reaction substrates or products) that are involved in each of the metabolic reactions, which together conforms the microbiota metabolism.
Aims and expected outcomes of the review
Overall, the review reflects a very broad picture of the factors that humans commonly face at any body site, which have been associated with alterations in the human microbiota in terms of composition and function. We would like to point out to the reader that the main emphasis of this review is to describe such information and technical advances in the field of metabolomics research. However, we are aware that in order to contextualise associations between perturbations and metabolic alterations in the microbiome, it is also essential to first fully understand what is happening at lower levels of the functional hierarchy. Only by achieving such holistic understanding, can one identify and assign the species to microorganisms, the microorganisms to genes and proteins, and those to functions (Table 2). Accordingly, we have organised the review and discussion in two major themes that commonly emerge in the study of the human microbiome. The first is the compilation of microbial groups whose altered abundance, indicated mostly by the amount of 16S rDNA genes generated from DNA, has been statistically associated with each of the perturbations reviewed herein. By analysing these associations, we will provide answers to questions such as: (i) how many microbial groups are commonly influenced among those estimated to inhabit our body? or (ii) are perturbations that substantially differ in nature and aetiology associated to similar or different alterations in our microbes? As we do not restrict this review in the narrow sense of community structure analysis, we secondly discuss associations at all levels of the functional hierarchy, from potentially active microbes (i.e. by monitoring the 16S rRNA amplicons generated from cDNA), gene level and expression (through extensive DNA and cDNA high-throughput next-generation sequencing) and protein synthesis (by metaproteomics) to functions (by meta-metabolomics). These analyses provide estimates for how many and which species become transcriptionally active when confronted with multiple perturbations, what the metabolic consequences of these are and whether the associations at the level of population structure have consequences, or not, at the functional level. Finally, the use of new technologies and methods, with a special focus on metabolomics research, is thoroughly discussed, together with the urgent need for the standardisation of protocols.
High-throughput approaches used to study variations in the human microbiota and microbiome function. Outcome, advantages, problems and gold standard methods are summarised.
| Microbial | Gold standard | ||||
|---|---|---|---|---|---|
| Metaomics | material | Outcome | Advantages | Problems | methods |
| Phenotyping | 16S rDNA and 16S rRNA amplicons generated from DNA or RNA/cDNA | Composition of total microbiota or microbiota with protein synthesis (potentially active) | 1. Fast and cheap sequencing | 1. Difficulties for phylogenetic assignations at the deepest level of the taxonomic hierarchy2. Difficulties in identifying low abundant and rare microbial groups3. Comparisons require amplification of same region | Logares et al. (2014); Takahashi et al. (2014); Jovel et al. (2016) |
| Metagenomics | DNA | Gene content profiling and presumptive function analysis | 1. No amplification bias2. Uncovering microbial diversity3. Finding new genes with high coverage and deep sequencing | 1. Requires high-depth coverage2. Assembly complicated if low coverage and high similarities3. No information of active genes4. Many unknown genes5. Bioinformatics analysis required6. Functions are inferred on the basis of sequence-based predictions | Džunková et al. (2014); Džunková, D’Auria and Moya (2015); Jovel et al. (2016) |
| Metatranscriptomics | mRNAcDNA | Gene expression profiling | 1. Reveal differences in gene expression from active microbiota | 1. Instability of mRNA2. Multiple purification steps to separate mRNA from tRNA (ratio 5:95)3. Lack of reference databases | Hampton-Marcell et al. (2013); Pérez-Cobas et al. (2013b); Reck et al. (2015); Bashiardes, Zilberman-Schapira and Elinav (2016); Moen et al. (2016) |
| Metaproteomics | Proteins | Protein expression profiling | 1. Reveal differences in proteins being synthesised from active microbiota | 1. Technologically challenging2. Bioinformatic analyses of protein mass or sequence is complex and time consuming3. Metagenome sequences needed4. Low coverage of protein landscape | Tanca et al. (2015) |
| Metametabolomics | Metabolites | Metabolite profiling | 1. Reveal differences in metabolite content and fluxes | 1. Lack of reference databases2. No unique protocol3. Many unknown metabolites in databases4. Strict identification of compounds laborious | Rojo et al. (2015a,b) |
Here, we review main associations described in the bibliography. What remains to be demonstrated is whether the observed associations are the cause or the consequence of a disease or a specific medical condition during exposure to each of environmental variables herein reviewed, which is out of the scope of the present revision. In this line, we would like to call the reader's attention to the fact that many of these associations may be false positives due to the nature of high-dimensional data, and they are not supported by experimental evidence. Also, we are aware that the only way to definitively evaluate the impact of diseases or other perturbation in the human microbiome is to study the microbiota in individuals prior to the disease or perturbation followed by the analyses of changes during and after the disease progresses or the perturbation ends. Similarly, the only way to definitively evaluate the effect of a possible therapeutic intervention to control a disease in our microbiota is to study an uninfected control (in the case of bacterial and viral infections) patient and to analyse the effects following the interventions. While these studies will likely be undertaken in the future and provide definitive data, the complexity inherent to these study designs has so far hampered their implementation in humans, and we feel that cross-sectional studies still provide valuable data to tackle the problem.
ASSOCIATIONS AT THE LEVEL OF THE TOTAL MICROBIOTA
To date, at least 105 diseases and disorders, substantially differing in nature and aetiology, have been associated with changes in our gastrointestinal, respiratory, oral, skin and urinary/vaginal microbiota, as revealed mostly by the amounts of the 16S rDNA genes generated from DNA. The extensive list of diseases and disorders is provided in Fig. 1. Changes in the composition of our total microbiota have also been associated with 22 other major covariates listed in Fig. 2. They include ageing, diet interventions (38 different ones), the administration of drugs (14), prebiotic and probiotic supplementations (15), surgeries and non-surgical treatments (9), pregnancy, the length of the gestational period, delivery mode, sex and sexual preference, discharge from an intensive care unit, postmenopause, exposure to dust and chemicals, circadian rhythm, smoking, geographical origin, heritability, hospitalisation time and hospital location and area of residence, to cite the most important. Finally, an association between antibiotic usage and changes in the composition of our microbiota has also been evidenced by examining 68 antibiotics used alone or in the form of antibiotic cocktails (Fig. 3). Full details of all factors associated with changes in our microbiota are given in Table S1 (Supporting Information).
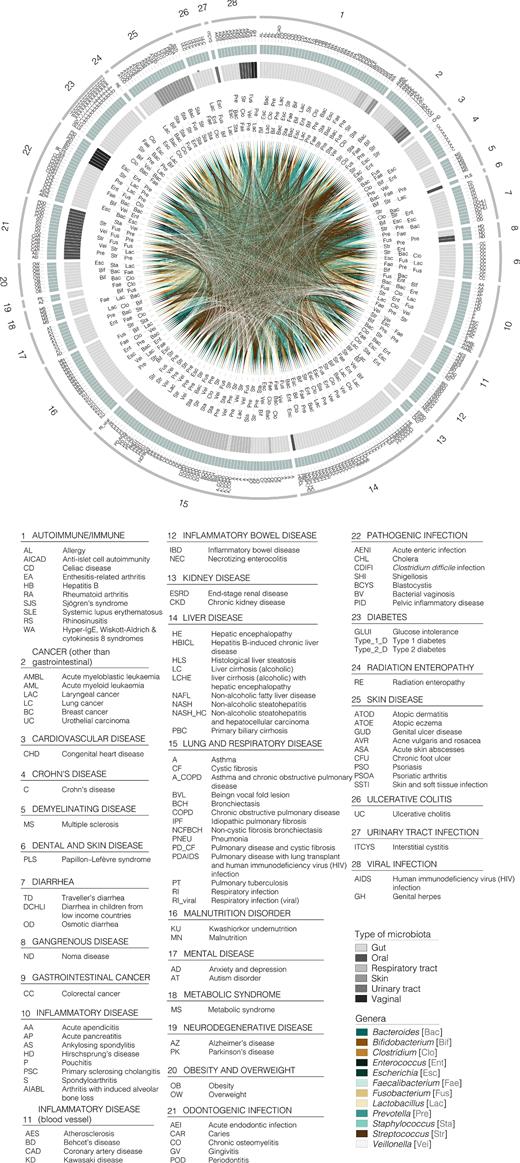
Graphic summary of diseases and disorders associated with alterations to the total microbiota composition at the genus level. Only the 12 most influenced bacterial genera are represented for the sake of clarity. Outer circle represents the reviewed disease categories (numbers from 1 to 28, see the legend), followed by a green circle of subcategories within main types of disorder, identifiable by a letter code included in the legend. Next circle shaded in grey represents the type of microbiota to which each genus belongs (see colour code in legend). Links among the different taxa associated with different disease types are depicted in the inner circle (see the legend for colour guide). A three letter code (see legend) next to each link has been included for the sake of clarity.

Graphic summary of local and external factors (other than diseases and antibiotic treatments) associated with alterations to the total microbiota, from which top 12 influenced bacterial genera were considered. Numbers in the outer circle (1 to 21) represent the different factors reviewed. The next green circle represents subcategories within each factor considered, identifiable by a letter code included in the legend. The following circle shaded in grey represents the type of microbiota to which the genera belong (see the legend for colour guide). Inner circle shows links among genera influenced by the diverse factors (see legend for colours). As in Fig. 1, a three letter code is included next to each link for the sake of clarity.
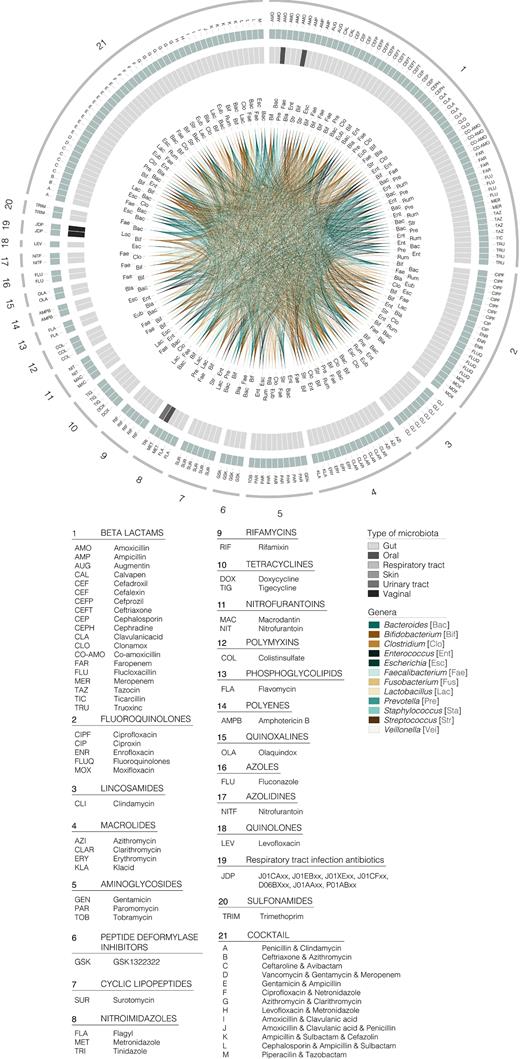
Graphic summary of antibiotics associated with alterations in the total microbiota, considering the top 12 most influenced bacterial genera. Numbers in the outer circle (1 to 21) represent the different factors reviewed. The next green circle represents subcategories within each factor considered, identifiable by a letter code included in the legend. The following circle shaded in grey represents the type of microbiota to which the genera belonged (see the legend for colour guide). Inner circle shows links among genera influenced by the diverse factors (see the legend for colours). As in Fig. 1, a three letter code is included next to link for clarity.
Note that in this review we considered associations between perturbations that differ greatly, and alterations in our microbiota from multiple human sites. We do not restrict the review to the gut microbiota, which is the most extensively studied, because multiple community types at several body sites are interconnected and/or enriched in similar types of microorganisms (Aagaard et al. 2014; Ding and Schloss 2014; Urbaniak et al. 2014). Therefore, associations at several body sites, each facing extremely variable perturbations and harbouring similar types of microorganisms (albeit with distinct taxonomic resemblance), may be of interest to assess perturbation risks holistically.
Associations with diseases and disorders
As shown in Fig. 1 from the disease–microbiota associations reported in the literature, 231 non-redundant genera belonging to 15 different phyla (Actinobacteria, Bacteroidetes, Firmicutes, Fusobacteria, Proteobacteria, Spirochaetes, Synergistetes, Tenericutes, Verrucomicrobia, candidate division TM7, RC1, Ascomycota, Basidiomycetes, Basidiomycota and Euryarchaeota) are significantly altered according to research examining alterations in the population structure of our microbiota. Firmicutes (92 diseases), Proteobacteria (69), Bacteroidetes (68), Actinobacteria (56) and Fusobacteria (29) are the five phyla most strongly influenced by the considered groups of diseases and disorders (Fig. 1). The genera Streptococcus, Staphylococcus, Enterococcus, Clostridium, Lactobacillus, Faecalibacterium and Veillonella (within Firmicutes), Prevotella and Bacteroides (Bacteroidetes), Bifidobacterium (Actinobacteria), Escherichia (Proteobacteria) and Fusobacterium (Fusobacteria) are the 12 most susceptible genera to modifications, as altered abundance of these genera is associated with at least 50% of the diseases or disorders herein examined (Fig. 1). Full details of similar or differential disease–genera associations are given in Fig. 1.
Associations with other local and external covariates
As shown in Fig. 2, from the covariates (other than diseases)–microbiota associations reported in the literature, strong associations have been found with 130 genera belonging to 13 different phyla, 11 from Bacteria (Actinobacteria, Bacteroidetes, Chloroflexi, Fibrobacteres, Firmicutes, Fusobacteria, Proteobacteria, Spirochaetes, Tenericutes, TM7 and Verrucomicrobia), 1 from Fungi (Ascomycota) and 1 from Archaea (Euryarchaeota). Overall, this suggests that diseases most likely associated with alterations in our microbiota (231 genera influenced) that are greater than those caused by other covariates (130 genera influenced). Streptococcus, Clostridium, Lactobacillus, Faecalibacterium, Enterococcus, Ruminococcus, and Blautia (within Firmicutes phylum), Prevotella and Bacteroides (Bacteroidetes), Bifidobacterium (Actinobacteria), Escherichia (Proteobacteria) and Akkermansia (Verrucomicrobia), were also found to be the 12 genera most influenced by the factors considered, as they are associated with at least 50% of the covariates (Fig. 2). Full details of similar or differential covariates–genera associations are given in Fig. 2.
Associations with antibiotic usage
Special consideration should be given to the effect of antibiotics. A recent study undertaking in-depth sequencing of the gut microbiomes of 1135 participants found that the use of antibiotics was significantly associated with microbiota composition alterations (Zhernakova et al. 2016). The only drugs significantly associated with the abundance of specific genera in phenotype-matched case–control analyses were β-lactam antibiotics (Falony et al. 2016). Both studies reported that the abundance of two species from the genus Bifidobacterium (Actinobacteria phylum), out of a total of 1649 detected genera, was strongly associated with the use of β-lactam antibiotics. However, many antibiotics other than β-lactam have been shown to influence the gut microbiota composition (Ferrer et al. 2016). Figure 3 summarises a list of major 42 microbial genera whose abundance is altered after treatment with 68 antibiotic therapies. As shown in Fig. 3, from the antibiotic–microbiota associations reported in the literature, the most influenced phyla are Actinobacteria, Bacteroidetes, Firmicutes and Proteobacteria as they are associated with at least 50% of the antibiotic treatments. The genera Clostridium, Enterococcus, Lactobacillus, Ruminococcus, Faecalibacterium, Streptococcus, Eubacterium and Blautia (within Firmicutes phylum), Prevotella and Bacteroides (Bacteroidetes), Bifidobacterium (Actinobacteria) and Escherichia (Proteobacteria) were also found to be the 12 most influenced by the antibiotic groups considered, being associated with at least 50% of the reviewed therapies (Fig. 3). Full details of similar or differential antibiotic–genera associations are given in Fig. 3.
Depicting the existence of easily influenced microbial groups
The data presented in Figs 1–3 reveal multiple associations between perturbations and microbial imbalances. Their comparative analysis has further revealed that many bacterial taxa associated with perturbations differing in nature and clinical consequences. Indeed, a total of 258 non-redundant genera belonging to 112 distinct families and 18 different phyla have been found to be associated with any of the factors included in this review. Figure 4 summarises the top 10 genera comprising our microbiota that are most commonly associated with any factor herein reviewed. They are associated with at least 50% of the factors reviewed. These genera included Lactobacillus, Clostridium, Blautia, Faecalibacterium, Streptococcus and Enterococcus (Firmicutes phylum), Bacteroides and Prevotella (Bacteroidetes), Bifidobacterium (Actinobacteria) and Escherichia (Proteobacteria). Bacteria belonging to these genera might therefore be the most susceptible to alterations, as their abundances were found to be commonly altered independently of the nature, strength and duration of any perturbation commonly faced by humans. This is particularly noteworthy because many of these bacteria are known to be beneficial for human health, such as the bacteria of the genera Faecalibacterium, Bifidobacterium and Blautia, to cite but a few. They are known to be strongly involved in short-chain fatty acid production and the amelioration of inflammation. Faecalibacterium is depleted during inflammatory conditions (Sokol et al. 2008) and plays an important role in inducing regulatory T cells (Sarrabayrouse et al. 2014) and decreasing intestinal permeability (Laval et al. 2015). Bifidobacteria are powerful bacteria that can protect the gut, boost the immune system and control inflammatory responses (Fujimura et al. 2010; O’Callaghan and van Sinderen 2016). Blautia abundance increases following faecal microbiota transplantation from healthy donors to individuals with recurrent Clostridium difficile infections who represent a subgroup of individuals with an extreme impairment of gut bacterial composition (Seekatz et al. 2014).
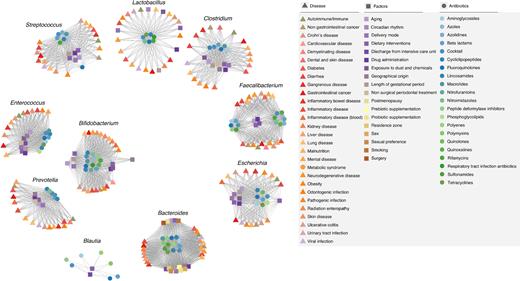
Network summary of all the interactions of the main conditions influencing our microbes reviewed herein: Diseases (triangle), other local and external factors (square), and antibiotics (circle). Only the top 10 most influenced genera were included. Node colours illustrate subcategories within each group of influence considered (see the legend for colour code), and links show similar patterns of action of conditions and condition types.
ASSOCIATIONS AT THE LEVEL OF THE ACTIVE MICROBIOTA
The above data reveal that about 258 non-redundant genera, or around 6% of the 5000 genera that are roughly estimated to conform our microbiota (Ding and Schloss 2014), belonging to 18 phyla and 112 families, are associated with most local or external perturbations commonly faced by humans. Then we revised which of these bacteria, if any, become transcriptionally activated in response to such perturbations, in order to identify associations between an active set of microorganisms and perturbations. We also reviewed associations with active bacteria undetectably altered at the level of total bacterial composition. To do so, we reviewed studies reporting RNA-Seq, DNA-Seq of viable cells (Džunková, D’Auria and Moya 2015) and taxonomy of genes being expressed or proteins being synthesised (for extensive references, see Table S1).
Before describing which microbial groups react most to perturbations, first it is important to know the most active members of the microbiota in healthy individuals not subjected to any apparent perturbation. Recent investigations revealed that many bacteria are transcriptionally active in our gut under healthy conditions (Vázquez-Castellanos et al. 2015; Serrano-Villar et al. 2016a) and that the Bacteroidetes phylum (particularly Bacteroidaceae) is primarily a dormant, dead and quiescent actor in gut function in healthy individuals, while the Firmicutes phylum (particularly Lachnospiraceae) is a more dominant part of the metabolically active microbiome (Gosalbes et al. 2011; Martínez et al. 2016). Note that this information is mostly unknown for other body sites. Using this information as baseline, it is possible to identify major active microbial actors known to affect the total microbiota when confronted with perturbations. However, a careful revision of the bibliographic records reveals that only a limited numbers of perturbations have been investigated in the context of their association with active microorganisms. They include diseases such as pervasive developmental disorders otherwise unspecified and autism (De Angelis et al. 2013), inflammatory bowel disease (Gosalbes et al. 2011; Martínez et al. 2016; Rehman et al. 2016), Clostridium difficile infection (Džunková, D’Auria and Moya 2015; Džunková et al. 2016), Crohn's disease and irritable bowel syndrome (Duboc et al. 2012, 2013; Durbán et al. 2013; Rehman et al. 2016; Valles-Colomer et al. 2016), non-alcoholic fatty liver disease (Michail et al. 2015), HIV infection (Mutlu et al. 2014; Vázquez-Castellanos et al. 2015), cystic fibrosis (Lim et al. 2013), asthma (Pérez-Losada et al. 2015), periodontal disease and dental caries (Wang 2015; May et al. 2016). Factors other than diseases (four in total) included antibiotic therapy (Pérez-Cobas et al. 2013a,b; Knecht et al. 2014), xenobiotic exposure (Maurice, Haiser and Turnbaugh 2013; Ursell and Knight 2013) and dietary interventions such as plant-based diets (Ni, Li and Panagiotou 2015; Tap et al. 2015) and vitamin B12 supplementation (Kang et al. 2015).
The examination of the above bibliographic records revealed an association between the 16 perturbations mentioned above and a number of microbial groups. Associations were mostly found at the family level, as major differences in the level of sequence coverage and length and sequence binning within the different studies preclude the acquisition of homogeneous information at the genus level in many cases. For example, in most cases, the expressed genes and proteins can be taxonomically distributed at the family level as the gene sequence coverage and peptide information commonly obtained by metatranscripto-mics and metaproteomics does not allow deeper taxonomic characterisation (Pérez-Cobas et al. 2013b; Serrano-Villar et al. 2016a). We observed from the perturbation–active microbiota associations reported in the literature that the most activated phyla (eight in total) are the bacterial Actinobacteria, Bacteroidetes, Firmicutes, Proteobacteria, Fusobacteria and Verrucomicrobia, the archaeal Euryarchaeota and fungal Basidiomycota. Within those phyla, the most active microorganisms are those belonging to the following 29 families: Bifidobacteriaceae, Coriobacteriaceae, Eggerthellaceae and Propionibacteriaceae (within the Actinobacteria phylum); Bacteroidaceae, Odoribacteraceae, Porphyromonadaceae, Prevotellaceae and Rikenellaceae (within Bacteroidetes); Acidaminococcaceae, Lachnospiraceae, Clostridiaceae, Enterococcaceae, Eubacteriaceae, Ruminococcaceae, Carnobacteriaceae, Lactobacillaceae, Staphylococcaceae, Streptococcaceae and Veillonellaceae (within the Firmicutes); Enterobacteriaceae, Moraxellaceae, Neisseriaceae, Pseudomonadaceae, Burkholderiaceae and Shewanellaceae (within Proteobacteria), Fusobacteriaceae (Fusobacteria phylum), Akkermansiaceae (within Verrucomicrobia); and Methanobacteriaceae (within Euryarchaeota).
Interestingly, all 8 active phyla, and 28 out 29 active families when confronted to perturbations were also found associated with perturbations at the level of total microbiota (Figs 1–3 and Table S1). This set of microbial groups may be among those reacting to perturbations both at the level of total and active microbiota. Only bacteria belonging to one family (Rikenellaceae) were found to be associated with perturbations when examining the active microbiota, which reinforces the hypothesis that the analysis of total populations (from 16S rDNA genes generated from DNA) masks the identification of components of the microbiota that are active players against perturbations. This observation agrees with previous studies revealing that bacteria affiliated with Shewanella, Streptococcus, Clostridium, Enterococcus, Eggerthella, Enhydrobacter, Halomonas, Ralstonia, Propionibacterium, Staphylococcus and Granulicatella are associated to treatments with β-lactam antibiotics and fluoroquinolones at the level of RNA but not DNA (Knecht et al. 2014).
We are aware that the number of factors (16 in total) investigated as associated with alterations in the active microbiota is significantly lower 128 (105 diseases and 23 other covariates) reported to influence our total microbial populations. This limited information does not allow us to make a real estimation of the percentage of bacteria reacting to perturbation. The low availability of studies may be partially due to the fact that the technologies needed to transcriptionally quantify active members are more technically challenging and time consuming compared to the sequencing of 16S rDNA genes, although gold standard methods are already available, as will be discussed later. We anticipate that future efforts in studying our microbiota using RNA-Seq, DNA-Seq of viable cells, and taxonomy-based metatranscriptomics and metaproteomics, will shed light on the real active players in our microbiota under perturbations for which the total population structure is known.
ASSOCIATIONS AT THE LEVEL OF SEQUENCE-BASED PREDICTED FUNCTIONS
Genes and proteins can be even more relevant than taxonomic composition in understanding the associations between perturbations and alterations in presumptive microbiome function (Moya and Ferrer 2016). Below, we review the sequence-based metabolic alterations associated with multiple perturbations as revealed by extensive high-throughput next-generation metasequence datasets of DNA (gene content) and cDNA (gene expression), and metaproteomics (protein synthesis). Actually this information is limited to 14 types of perturbations.
Briefly, genes involved in various pathogenic processes, cell wall component biosynthesis, various transport systems, bacterial translocation, amino acid metabolism and energy processes, and short-chain fatty acid metabolism have been found altered in HIV-infected individuals (Vázquez-Castellanos et al. 2015) as well as in patients with colorectal cancer (Zeller et al. 2014; Vogtmann et al. 2016), non-alcoholic fatty liver disease (Michail et al. 2015), type 1 diabetes (Consortium 2012), inflammatory bowel disease (Morgan et al. 2012), Crohn's disease (Erickson et al. 2012; Quince et al. 2015), oral diseases, such as dental caries (May et al. 2016) and periodontitis (Wang 2015), and dietary interventions including exclusive enteral nutrition (Ni, Li and Panagiotou 2015; Quince et al. 2015). Systemic lupus erythaematosus is also associated with an overrepresentation of genes implicated in oxidative phosphorylation (Hevia et al. 2014), but this has also been observed in lean individuals compared to those who are obese (Papathanasopoulos and Camilleri 2010; Greenblum, Turnbaugh and Borenstein 2012; Cox and Blaser 2013; Ferrer et al. 2013; Subramanian et al. 2014) and also as a response to intestinal colonisation in healthy individuals (El Aidy et al. 2013). Furthermore, as a consequence of Clostridium difficile infection, it was found that phosphotransferase system transport and the metabolism and regulation of carbohydrates and sugar alcohols were overrepresented functions, while aromatic amino acid family biosynthesis was significantly underrepresented (Pérez-Cobas et al. 2014). Genes encoding fibre-degrading enzymes have been found to be altered in patients with colorectal cancer; accordingly, it has been suggested that the degradation of host glycans might be related to the aetiology of colorectal cancer (Zeller et al. 2014). However, such functional consequences have also been observed in patients receiving antibiotic therapy (Pérez-Cobas et al. 2013a,b), patients with non-alcoholic fatty liver disease (Michail et al. 2015), patients with inflammatory bowel disease (Morgan et al. 2012; Rooks et al. 2014), patients with systemic lupus erythaematosus (SLE; Hevia et al. 2014), patients with Crohn's disease with exclusive enteral nutrition (Quince et al. 2015) and patients with oral diseases such as dental caries (May et al. 2016), which are characterised by quite distinct aetiologies. This suggests that multiple factors drastically associated with changes in the microbial community and the species responsible for the degradation of dietary components.
The above reported data suggest, as for microbial groups (Figs 1–3), that a number of core functions are most sensitive to change due to perturbations. However, specific associations were also reported. For example, based on metagenomic datasets, nitrogen metabolism (ko00910), the citrate cycle (ko00020), geraniol degradation (ko00281) and lipoic acid metabolism (ko00785) were only found to be significantly enriched in patients with colorectal cancer (Vogtmann et al. 2016). The manifestation of periodontitis, a common inflammatory disease, was associated with the upregulation of isoprenoid biosynthesis and ciliary and flagellar motility (Wang 2015). Vitamin B12 supplementation altered the transcriptome of the skin microbiota promoting the expression of vitamin B12 biosynthesis genes and the production of porphyrins, which have been shown to induce inflammation in acne (Kang et al. 2015). Finally, patients with Crohn's disease with exclusive enteral nutrition have been associated with a decrease in genes involved in biotin and thiamine biosynthesis and an increase in genes involved in spermidine/putrescine biosynthesis, or the shikimate pathway (Quince et al. 2015).
ASSOCIATIONS AT THE LEVEL OF MICROBE ACTIVITY
The next logical step in the functional hierarchy after analysing population structure, gene content and expression, and protein synthesis is to monitor microbial activity. The effects of perturbations may be reflected in decreased bacterial activity or in the complete destruction of bacterial cells. This can be observed as a loss of membrane integrity or membrane polarity, or in a decrease in nucleic acid content (Maurice, Haiser and Turnbaugh 2013). At the same time, bacteria that are resistant to a given perturbation may substitute the susceptible ones. By the end of the perturbation, the bacterial species composition may have changed; however, their essential functions can be performed by the community surviving members (Pérez-Cobas et al. 2013b).
There are recent reports of associations between a few covariates and the activity level of our microbiota. For example, a recent study showed that antibiotic intervention modifies the gut microbiota in such a way that a different set of bacterial enzymes becomes active once therapy has ended (Hernández et al. 2013). This new set of enzymes favours the rapid and non-equilibrated assimilation of carbohydrates, which may have negative health consequences such as inducing obesity and type 2 diabetes. Similar alterations have been associated with obesity. Indeed, proteomic analyses associated the expressed glycoside hydrolases from lean individuals with Prevotella species of the Bacteroidetes phylum, whereas over 90% of those from obese individuals belonged to Firmicutes, especially Ruminococcus (Ferrer et al. 2013). In a subsequent study, the analysis of glucosidase activity using model sugar substrates and protein extracts from gut bacteria revealed that those obtained from obese (and that associated with the Firmicutes phylum) are at least 10-fold more active than those from lean individuals (Hernández et al. 2013). These observations link different gut microbial glycoside hydrolases with distinct metabolic functions in processing dietary carbohydrates to host physiology and human health biomarkers, such as obesity and insulin resistance.
Associations have been reported between activities other that dietary carbohydrates degradation and local and external factors. For example, dietary interventions with phytochemicals have been associated with improved gut bacteria-mediated conversion of ellagic acid to urolithin A. This activity is advantageous to both host and microbiota, i.e. the urolithin A-mediated inhibition of pro-oxidant enzymes reduces tissue inflammation, mitigates the non-specific killing of gut bacteria and abrogates the iron-binding property of ellagic acid, thus providing a competitive edge to the microbiota in acquiring the limiting nutrient iron and allowing them to thrive in the gut (Saha et al. 2016). Finally, by measuring the activity of a specific set of gut bacteria, it was shown that bacteria of the family Succinivibrionaceae are able to actively transport molecules that help resolve inflammation and immune recovery during HIV infection (Serrano-Villar et al. 2016a).
ASSOCIATIONS AT THE LEVEL OF METABOLITE CONTENTS AND FLUXES
Even though presumptive sequence-based functional associations have been made with multiple perturbations, experimental validation is required to confirm the metabolic consequences of differential abundances of microbes, genes and proteins. This is of practical importance, as many microbial groups, genes and proteins associated with perturbations differ in their nature and clinical consequences (see previous sections). This can be partially avoided through the direct examination of metabolites that are the final downstream products of microbes (Goodacre 2007). They are considered as a final output within the functional hierarchy. The fact that 40% of metabolites in the human body, some of which play a crucial role in health (Vernocchi, Del Chierico and Putignani 2016), are produced by our microbiota and that such metabolites provide the most reliable snapshot of changes in metabolic activity demonstrates the importance of metabolomics research in the context of human health (Moya and Ferrer 2016). Metabolites can be used not only to measure the metabolic activity of the microbiota, but also as a measure of health status, as metabolites produced by the microbiota are neurotransmitters controlling the bidirectional gut–brain axis (Matsumoto et al. 2013), helping to maintain and repair the large intestine (Kibe et al. 2014), and playing a crucial role in controlling intestinal inflammation (Louis, Hold and Flint 2014) and cancer cell proliferation (Bindels et al. 2012). However, they can also influence human disease. Thus, a recent example has demonstrated that the host sugars released by the action of microbiota facilitate the expansion of enteric pathogens (Ng et al. 2013). Metabolites produced by bacteria have been also associated with higher levels of pathogenicity of Clostridium difficile (Bender et al. 2015; Shen 2015) and with various diseases, including carcinogenesis in different regions of the intestinal tract and associated organs (Kibe et al. 2014), and atherosclerosis (Tang and Hazen 2014). Therefore, metabolites are essential molecular agents that need to be investigated due to their ecological, clinical and medical relevance (Vernocchi, Del Chierico and Putignani 2016).
Major alterations in the community structure associated with major changes in metabolite fluxes
Regardless of the technical challenges and advances in metabolomics that will be discussed later, associations have been reported between the content of microbial metabolites and at least 37 diseases and disorders and environmental variables. In this case, we restricted the revision to faecal metabolites, as very little information is available for microbial metabolites from other body sites. The complete list of metabolites associated with different diseases, disorders and other local and external factors is detailed in Table S1. Metabolites that have been differentially found as demonstrated by metabolomic fingerprinting included amino acids (alanine, cysteine, glutamate, glycine, histidine, leucine, isoleucine, phenylalanine, proline, serine, threonine, tryptophan, tyrosine, valine), short-chain fatty acids (acetic acid, valeric acid, butyric acid, etc.), long linear and branched saturated and unsaturated fatty acids, N-acyl amino acids and polyamides (including arachidoyl glycine, N-stearoyl proline, N-oleoyl (iso)leucine, N-stearoyl tyrosine and N-palmitoyl threonine, etc.), hydrocarbons, xenobiotics, lipids (including gluco-, glycero- and glycerophospho-lipids, ceramides and sphingolipids, etc.), primary and secondary bile acids, cholesterol derivatives, metabolites implicated in porphyrin and iron metabolism (ferroxamine, protoporphyrin IX, mesoporphyrin IX, etc.), cell membrane components (N-acetylmuramic, N-acetylneuraminic acids, N-acetylglucos-amine, etc.), vitamins, polyols and sugars, trimethylamine-N-oxide, carnitine, ribose-1,5-bisphosphate, thiamine, choline, acetylputrescine, inosine, pseudouridine, hypoxanthine, creatinine, N-acetylhistamine, glyoxylic acid, succinic acid, homoserine lactone and phytochemicals (glucosinolates, polyphenol, aglycones, etc.), to cite some. The biological relevance and health implications of each of these metabolites fall outside the scope of this review and can be checked in the references provided in Table S1.
One of the first questions to answer is whether major or minor alterations in community structure are associated with major or minor metabolic alterations. From Fig. 1, we observe that diseases and factors that directly or indirectly affect the gastrointestinal tract, the colonic space and the oral cavity are associated with a major number of microbial alterations, e.g. HIV (65 genera affected), Crohn's disease (60), colorectal cancer (59) and periodontitis (49). The heat map and clustering analysis shown in Fig. 5 reveal that such alterations are also translated at the metabolic level. Thus, when compared to healthy controls, diseases such as inflammatory bowel diseases (including ulcerative colitis, Crohn's disease and C. difficile infection), colorectal cancer and HIV are associated with major metabolic consequences. For example, an association with colorectal cancer was found for 78 faecal metabolites (Monleón et al. 2009; Ou et al. 2013; Weir et al. 2013; Goedert et al. 2014; Bjerrum et al. 2015; Wang et al. 2015; Sinha et al. 2016), 36 are associated with gastrointestinal disease cryptosporidiosis (Ng et al. 2012), 23 are associated with Crohn's disease (Jansson et al. 2009; Bjerrum et al. 2015), 25 associated with C. difficile infection (Rojo et al. 2015b) and 14 associated with HIV (Serrano-Villar et al. 2016a,b). This contrasts to diseases or factors which have no such direct influence on the gastrointestinal tract such as cancers, besides gastrointestinal cancer (Fig. 5). However, there are disorders that do not directly affect the gastrointestinal tract, which are also associated with major metabolic changes (Fig. 5), suggesting that multiorganismal factors other than alterations in the body site where the microbiota develop, are responsible for the final metabolic output. For example, about 38 metabolites associated to pervasive developmental disorder (De Angelis et al. 2013), 24 to liver cirrhosis (Cao et al. 2011; Huang et al. 2013), 14 to SLE (Rojo et al. 2015b) and 12 to type 2 diabetes mellitus (Zhu et al. 2014) (Fig. 5). Of particular relevance are the effects of dietary interventions in the metabolic alterations when examining faecal metabolomes. As shown in Fig. 5, major differences are evident. For example, about 350 metabolites were found to be discriminating metabolites associated with multiple dietary interventions (Chow et al. 2014; Roager et al. 2014), and 15 were associated with arsenic exposure (Lu et al. 2014). Interestingly, intervention with a single probiotic has been shown to be associated with alterations in less than a dozen metabolites (Roager et al. 2014) to 212 (Shi et al. 2015), reinforcing the idea that the introduction of a single bacterium can cause major changes in the metabolism of the gut microbiota (Marcobal et al. 2013). This suggests that different interventions do have diverse consequences on our microbes’ metabolic activity.
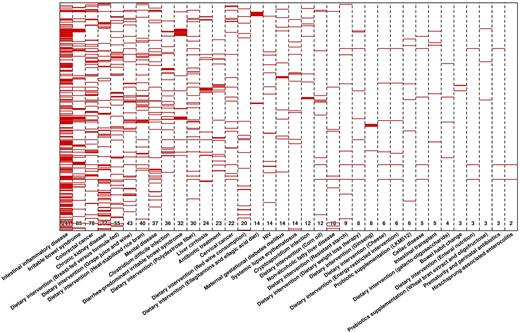
Heap map displaying the metabolite biomarkers found to discriminate healthy controls and patients characterised by multiple perturbations, including diseases and environmental pressures such as dietary interventions, exposure to metals and antibiotic treatment. A total of 621 non-redundant metabolites have been found as biomarkers in all metabolomics (target and fingerprint) studies published to date. The number of discriminating metabolites is specified below for each of the diseases, disorders and external factors, which are ordered from low to high effect on the metabolome. Full list of metabolites is given in Table S1. Heat map was constructed in R (http://www.r-project.org) using the ‘heatmap.2’ function within the ‘gplots’ package.
In order to reveal whether the observed metabolic alterations may be a reflection of the differences observed at the level of population structure (Figs 1–3), a correlation test was performed. To do so, the number of affected genera and metabolites per each perturbation were compared, including only studies reporting data for both circumstances. We found a positive correlation between both variables (r2 = 0.534; p value = 0.00017), reinforcing the idea that major alterations in the community structure imply major metabolic changes (by meaning of metabolite content and abundance).
A second question is to what extent each factor is associated with different metabolic consequences. The heat map and clustering analysis shown in Fig. 5 reveal that many of the metabolites whose abundance level was altered are associated with multiple perturbations. For example, short-chain fatty acids (Fig. 6) have been associated with multiple intestinal inflammatory diseases, including Hirschsprung-associated enterocolitis (Demehri et al. 2016), irritable bowel syndrome (Marchesi et al. 2007; Le Gall et al. 2011; Ponnusamy et al. 2011; Duboc et al. 2012; Dior et al. 2016), ulcerative colitis (Le Gall et al. 2011; Bjerrum et al. 2015) and Crohn's disease (Bjerrum et al. 2015). Its altered content also associated with autoimmune disease (Rojo et al. 2015b), celiac disease (Sellitto et al. 2012), chronic kidney disease (Poesen et al. 2016), colorectal cancer (Monleón et al. 2009; Ou et al. 2013; Weir et al. 2013; Goedert et al. 2014; Bjerrum et al. 2015; Wang et al. 2015; Sinha et al. 2016), non-alcoholic fatty liver disease (Michail et al. 2015) and mental diseases (autism and pervasive developmental disorder) (De Angelis et al. 2013). They have also been associated with multiple dietary interventions such as breast and formula feeding (Chow et al. 2014), dietary weight loss therapy (Damms-Machado et al. 2015), energy-restricted intervention with low or high dairy intake (Zheng et al. 2016), enteral nutrition (Gerasimidis et al. 2014; Berntson, Agback and Dicksved 2016) and cheese (Zheng et al. 2015), grape juice and wine (Jacobs et al. 2008), polydextrose fiber (Lamichhane et al. 2014), and resistant starch and corn oil (Zheng et al. 2013) consumptions. Also, they associated with prebiotics supplementation with wheat bran extract and oligofructose (Windey et al. 2014), probiotic supplementation (Matsumoto et al. 2014; Abdulkadir et al. 2016), and finally prematurity and perinatal antibiotics treatment (Arboleya et al. 2015). Similarly, differential metabolic signatures for bile acids and amino acids were associated with the different factors listed in Fig. 6. These examples again reveal that similar types of metabolites are associated with diseases or factors differing in nature and aetiology, as also suggested when examining associations with microbial genera (active and/or inactive) (Figs 1–3), as well as genes and proteins.
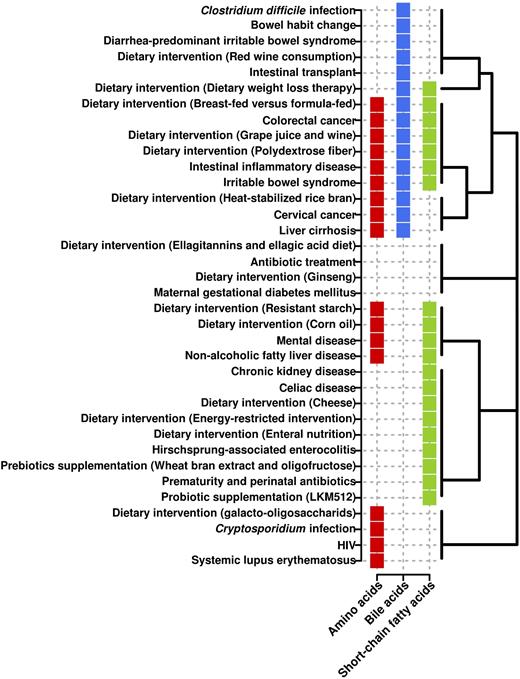
Associations of three key metabolisms altered as a consequence of multiple factors. The analysis is based on the differential abundance level of metabolites involved in each metabolism (detected by metabolomics profiling; for details, see Table S1). Clustering is based on the Binary Method distance (presence or absence).
Correlation between metabolically active bacteria and metabolomics data
It is becoming increasingly important to find correlations between active bacteria and metabolites, making it possible to determine which bacteria are able to actively participate in the metabolism of these molecules. This requires integrating taxonomic data, mostly from the set of active microbes, and metabolomics data (Lepage et al. 2013). A careful examination of the data reported reveals interactions between at least 33 bacterial groups and 52 major metabolites, including amino acids, sugars, amino sugars, bile acids, cholesterol derivatives, xenobiotics, volatile organic compounds, fatty acids derivatives, eicosanoids, lipids, indoles, peptides, nucleotides, glucosinolates and other organic molecules (Fig. 7). Differences at the level of sequence coverage and length within the different studies make it possible to establish the taxonomic affiliations of the bacteria, mostly at the phylum and family level, and in some cases at the genus level. As shown in Fig. 7, most associations occur within members of the phyla Firmicutes (∼59% of the metabolites) and to a lesser extent within Bacteroidetes (∼16%), Proteobacteria (∼9%), Actinobacteria (∼6%) and Cyanobacteria (∼3%). At the family level, the major contributors are members of Clostridiaceae, Lachnospiraceae, Acidaminococcaceae, Rickenellaceae, Ruminococcaceae and to a lower extent Acidaminococcaceae, Lachnospiraceae, Prevotellaceae, Bacteroidaceae, Enterobacteriaceae, Erysipelotrichaceae, Oscillospiraceae, Porphyromonadaceae, Sutterellaceae and Veillonellaceae. These comprise bacterial groups well known to inhabit the gut ecosystem.
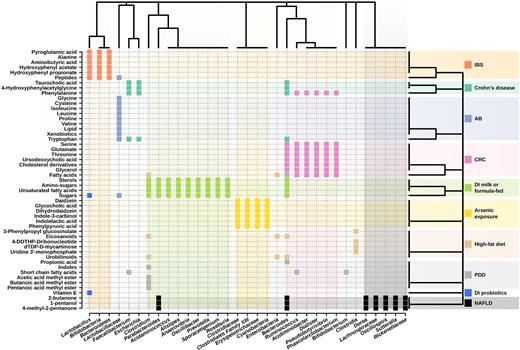
Clustering of the metabolic biomarkers and gut microbiota members interlinked in the context of multiple diseases and interventions. The analysis is based on their type and abundance (detected by metabolomic profiling, and 16S rRNA and 16S rDNA sequencing), applying the Binary Method distance (presence or absence). IBS: irritable bowel syndrome; AB: antibiotic treatment during C. difficile infection; CRC: colorectal cancer; DI: dietary intervention; PDD: pervasive developmental disorder; NAFLD: non-alcoholic fatty liver disease.
Further examination of the data presented in Fig. 7 demonstrates that the same metabolites are associated with different bacterial groups depending on perturbations such as diseases. For example, while Acidiminobacter, Bacteroides, Dialister, Phascolarctobacterium, Pseudobutyrivibrio and Ruminococcus members are associated with the presence of the amino acid phenylalanine in patients with colorectal cancer compared with healthy controls (Monleón et al. 2009; Ou et al. 2013; Weir et al. 2013; Goedert et al. 2014; Bjerrum et al. 2015; Wang et al. 2015; Sinha et al. 2016), members of Bacteroides, Escherichia and Faecalibacterium are associated with their differential production in patients with Crohn's disease (Bjerrum et al. 2015). Also, bacteria from the genera Bacteroides, Escherichia and Faecalibacterium are associated with altered abundance of the amino acid tryptophan in patients with Crohn's disease (Jansson et al. 2009; Bjerrum et al. 2015), whereas those belonging to the family Lactobacillaceae were observed in patients receiving antibiotic treatment in C. difficile-infected patients (Rojo et al. 2015b). Other examples can be seen in Fig. 7.
Also, an association has been found between the level of different metabolites and the same bacterial groups in the context of multiple diseases. For example, Faecalibacterium is associated with 4-hydroxyphenylacetylglycine, the amino acids phenylalanine and tryptophan, and the bile acid taurocholic acid in patients with Crohn's disease (Rojo et al. 2015b), as well as with short-chain fatty acids in individuals with pervasive developmental disorder (De Angelis et al. 2013). This suggests that the association between bacteria and metabolites may be factor (i.e. disease) dependent. This could be due to the fact that each perturbation may drastically and differentially changes the microbial community (Figs 1–3), and the species responsible for the absorption, production or transformation of metabolites.
Additionally, a number of specific associations have been identified. For example, a positive correlation between the level of Clostridium species and the amount of methyl esters (butanoic acid methyl ester, acetic acid methyl ester and pentanoic acid methyl ester) and indoles, between Faecalibacterium, Ruminococcus and Bifidobacterium genera and total short-chain fatty acids, and between Bacteroides genus and total free amino acids and propionic acid are found in children with pervasive developmental disorder not otherwise specified and autism in comparison to healthy children (De Angelis et al. 2013). An association of Oscillospira, Dorea, Rickenellaceae, Parabacteroides, Bacteroides fragilis, Sutterella and Lachnospiraceae with volatile organic compounds such as 4-methyl-2-pentanone, 1-pentanol, 1-butanol and 2-butanone are characteristic of patients with paediatric non-alcoholic fatty liver disease and obesity (Del Chierico et al. 2017). An association between Faecalibacterium, Bacteroides and Escherichia genera abundances and levels of 4-hydroxyphenylacetylglycine, the amino acids tryptophan and phenylalanine and the bile acid taurocholic acid has been suggested in patient with Crohn's disease (Jansson et al. 2009). Correlation analyses of the microbiome and metabolome data reveal strong associations between Bacteroides, Dialister, Ruminococcus, Pseudobutyrivibrio, Phascolarctobacterium and Acidiminobacter spp., and metabolites that included free fatty acids, glycerol, cholesterol derivatives, amino acids phenylalanine, glutamate, serine and threonine, and the bile acid ursodeoxycholic acid in patients with colorectal cancer (Weir et al. 2013). Also, Bacteroidetes, Bifidobacteria and Lactobacillus have been associated with the level of alanine, pyroglutamic acid, peptides, hydroxyphenyl acetate, hydroxyphenyl propionate and aminobutyric acid in the context of patients with irritable bowel syndrome (Ponnusamy et al. 2011).
The analysis of dietary interventions with milk or formula would suggest an association between the presence of bacteria of the genera Oscillibacter, Sporacetigenium, Clostridium, Prevotella, Anaerovibrio, Roseburia, Acidaminococcus, Bacteroides, Parabacteroides and Alistipes and the concentration of sugars, aminosugars, fatty acids, especially unsaturated fatty acids and sterols (Poroyko et al. 2011). Dietary intervention with the probiotic Lactobacillus acidophilus NCFM has demonstrated that its presence is strongly correlated with the abundance level of oligosaccharides (penta- and tetrasaccharides), vitamin E and intestinal bile acids (Roager et al. 2014). Finally, correlation is reported between Tenericutes (Erysipelotrichaceae family), Firmicutes (i.e. Clostridiaceae family and Clostridiales Family XIII Incertae Sedis) and Cyanobacteria and indolelactic acid, daidz-ein, phenylpyruvic acid, indole-3-carbinol, glycocholic acid, and dihydrodaidzein during arsenic exposure (Lu et al. 2014).
Extensive descriptions of microbes–metabolite associations in the context of multiple perturbations are shown in detail in Fig. 7.
TECHNICAL CHALLENGES AND ADVANCES IN THE FIELD OF METABOLOMICS
The information presented above reflects a broad picture of the factors reported to alter the human microbiota in terms of composition and function. We were able to suggest microbial groups (dead, quiescent or active) and functions (predicted and confirmed experimentally) most likely susceptible to alterations when our microbiota is faced with local or external perturbations humans commonly face. By comparing associations between alterations in microbial taxa and metabolite content in the context of perturbations that differ in nature and aetiology, we confirmed that major alterations in the community structure are associated with major metabolic changes, as well as suggested associations between active bacteria and metabolites. A careful examination of metabolomics research also reveals that bacteria from a genus may produce different metabolic outputs under different perturbations, and that similar metabolic contributions are associated with different bacterial groups depending on the perturbation. This information, and that provided above, demonstrates the importance of the metaomics tools, particularly, metabolomics research, in the context of exploring the associations between perturbations and our microbiota and microbiome.
Omics techniques confront a number of technical challenges that are more evident in the case of metabolomics research (Smirnov et al. 2016); the main ones are summarised in Table 2. While metagenomics and metatranscriptomics standard methods exist and the data can be directly compared, those for metaproteomics and, more importantly, metametabolomics research are far from being developed. Indeed, well-established methods and commercially available kits are available to isolate DNA and cDNA from our microbiota (for recent examples, see Hampton-Marcell et al. 2013; Pérez-Cobas et al. 2013b; Reck et al. 2015; Bashiardes, Zilberman-Schapira and Elinav 2016; Moen et al. 2016). The analysis of microbiota composition is therefore not limited by technical difficulties (Jovel et al. 2016), but is rather problematic in terms of sequence coverage and length, which precludes the acquisition of homogeneous information at the deepest taxonomic levels (genera and species). This will require the development of advanced computational methods to identify low-abundance and rare microbial components using 16S ribosomal RNA gene sequences and shotgun sequence datasets (Keller et al. 2014).
In the case of metaproteomic studies of the microbiota, recently a gold standard method was suggested (Tanca et al. 2015). It involves a pretreatment step to enrich for microbial cells that can be then disrupted using standard protocols to recover the proteins, which can then be analysed by mass spectrometry (MS). Authors have demonstrated that this sample processing step is critical in allowing a proper representation of microbial proteins and for extracting proteins involved in some important microbial functional categories, including cell-surface enzymes, membrane-associated proteins, extracellular proteins and flagella.
However, we are unable to suggest any particular method as the gold standard for metametabolomics analyses, and the direct comparison of metabolite abundances across different studies is actually difficult to achieve. To exemplify this, imagine our gastrointestinal tract and how variable its contents can be. Indeed, our gastrointestinal tract not only contains trillions of microbial and epithelial cells but also receives a continuous influx of nutrient molecules during food intake, and those released by epithelial cells on the inner surface of the mucosa and by its microbial inhabitants (Fig. 8). Therefore, relevant technical issues exist related to sample pretreatment methods if one wants to investigate metabolites directly associated with the action of potentially active microbes rather than to the diet or to the host, which are also important components. Such problems are not anticipated to occur when using other omics tools. In addition, the analytical methods, MS and nuclear magnetic resonance (NMR) tools and data processing are also important issues for consideration. Below, we provide technical challenges, problems and methods for metabolomics research.
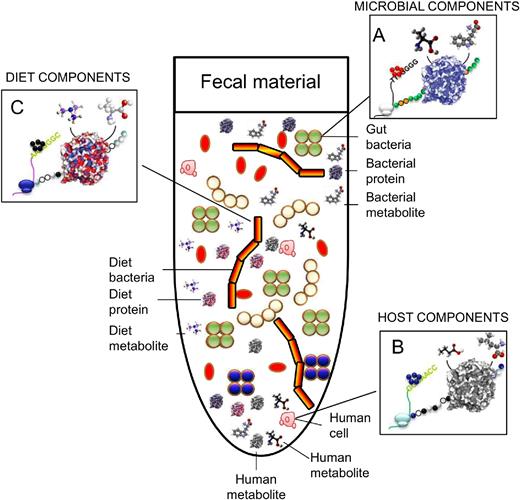
Schematic representation of the complexity of the faecal fluids at the biological and chemical levels. Colour codes are used to distinguish microbial (i.e. bacterial) (A), human cells (B) and dietary (C) components.
The metabolomics experiment: some considerations
From an analytical chemistry point of view, the art of metabolomics mainly requires two types of tools: NMR and MS. Deda et al. (2015) recently published a comprehensive and relevant review of NMR methods for faecal analysis, including practices for processing faecal samples for global metabolic profiling. The different methods used for faeces processing prior to metabolite analysis are summarised and illustrated using selected examples to highlight the effects of sample preparation on the metabolic profile. Vernocchi, Del Chierico and Putignani (2016) recently revised gas chromatography (GC)-MS and liquid chromatography (LC)-MS methods for faeces analysis. However, they did not include the increased amount of data showing the superior capabilities of the separation techniques coupled with MS in terms of sensitivity and metabolite coverage and the most selective methods devoted to prepare metabolomes, including the pre-enrichment of bacterial cells, nor the biological relevance of the identified metabolites in a broad ecological and medical sense when combining with other omic datasets.
In metabolomics, the two main approaches below can be distinguished: (i) targeted and (ii) non-targeted analysis. The former corresponds with the heritage of classical analytical chemistry, for which the objective was to identify a target compound (analyte) and its subsequent quantification. Under the new paradigm, this approach has become more flexible, and the measurement of several compounds present in a specific pathway or the determinations of several reaction products could also be considered as the target, for which absolute quantification is no longer implicit. Specific metabolites that are linked to health status, such as the immunomodulatory derivatives tryptophan/kynurenine, short-chain and branched-chain fatty acids that enhance gut barrier function and impact systemic metabolism and immunity, bile acids (primary, secondary, conjugated and sulphated bile acids) and polyamines, have been identified and quantified in faeces primarily using a target metabolomics approach. A complete list of metabolites commonly quantified by target approaches is provided in Table S1. Their quantification has laid the foundation for studying associations with diet interventions (Kibe et al. 2014, Chen et al. 2015, De Leoz et al. 2015; Sheflin et al. 2015), antibiotic treatments (Ng et al. 2013), surgical and dietary weight loss (Damms-Machado et al. 2015), and diseases such as inflammatory bowel disease (Duboc et al. 2013), diarrhoea-predominant irritable bowel syndrome (Duboc et al. 2012), cirrhosis (Kakiyama et al. 2013), ulcerative colitis (Machiels et al. 2014), colon cancer (Ou et al. 2013) and HIV infection (Vujkovic-Cvijin et al. 2013).
On the other hand, the non-targeted methodology (also known as global profiling or fingerprinting) addresses biological questions without any previous hypotheses and therefore is ideal for opening up new research avenues. Note that, of all of the literature records reviewed herein, approximately 62% of the articles are devoted to fingerprinting alone (55%) or in combination with a target analysis (Couch et al. 2013; Weir et al. 2013; Weingarden et al. 2014; Ordiz et al. 2015; Sheflin et al. 2015). One of the most promising opportunities offered by this approach is related to the possibility to analyse the impact of human health disorders and diseases on the intestinal microbiota as a whole, as reviewed above (Vernocchi, Del Chierico and Putignani 2016). Such disorders and diseases include cirrhosis (Cao et al. 2011; Huang et al. 2013), autism and pervasive developmental disorder (De Angelis et al. 2013), colorectal cancer (Weir et al. 2013; Goedert et al. 2014), Crohn's disease (Jansson et al. 2009), irritable bowel syndrome (Le Gall et al. 2011; Ponnusamy et al. 2011), SLE autoimmune disease (Rojo et al. 2015b), obesity (Rojo et al. 2015b), alcoholic fatty liver disease (Shi et al. 2015), type 2 diabetes mellitus (Zhu et al. 2014) and Clostridium difficile infection (Rojo et al. 2015b), to cite some. This approach has also been used to investigate the effects of diet (Poroyko et al. 2011; Chow et al. 2014; Jiménez-Girón et al. 2015; Sheflin et al. 2015; Wei et al. 2015), intestinal transplants (Girlanda et al. 2012), treatment with antibiotic (Pérez-Cobas et al. 2013b), exposure to metals (Lu et al. 2014) and supplementation with probiotics (Matsumoto et al. 2014; Roager et al. 2014), to cite some.
It is important to describe several points in which one can cause biases, the most important being the collection, transport and conservation of the sample, the method used to extract the metabolites and the methods to process and analyse the metabolites. In this context, the general metabolomics fingerprinting workflow has recently been discussed in detail by Godzien et al. (2013) and mainly encompasses five steps: (i) experimental design, (ii) sample treatment, (iii) analytical platform and data acquisition, (iv) data treatment and (v) biological interpretation and validation. Following the logical path of the fingerprinting workflow, we focus on some of its critical points in the following sections. Note that approximately 10% of the metabolomics studies related to human microbiota are focused on method development and optimisation (see Table S1), which certainly reflects the importance of this step for both target analysis (De Leoz et al. 2013; Xu et al. 2015; García-Villalba, Espín and Tomás-Barberán 2016) and global profiling (Jacobs et al. 2008; De Preter et al. 2009; Gao et al. 2009; Gao, Pujos-Guillot and Sébédio 2010; Ng et al. 2012; Phua et al. 2013; Lamichhane et al. 2015; Vanden Bussche et al. 2015; Su et al. 2016).
Collection, transport and conservation
It is important to know that the microbiota is a dynamic ecosystem influenced by manipulation and storage conditions, and that storage under strict anaerobic conditions is recommended to ensure the viability and representation of microbes and microbial products (Cardona et al. 2012). Hardly any studies have addressed the evaluation and development of techniques and conditions to evaluate and preserve the metabolome obtained from our body, including faecal material, in order to ensure its viability after long incubation times. However, immediate freezing of the microbiota samples at −80°C is highly recommended, although lower temperatures (4°C or −20°C) are also acceptable. In this way, one can prevent changes in the microbial metabolism until metabolite extraction (Gorzelak et al. 2015). Following these recommendations, the same sample can be frozen and unfrozen up to four cycles without significant changes in the microbiota composition, and thus no expected changes in metabolite profiles.
Quality controls
Unlike metagenomics, metatranscriptomics and metaproteomics, it is crucial to standardise the analytical variability in metabolomic experiments by using quality control (QC) samples (Rojo et al. 2015a,b). These QC samples should be as similar as possible to the samples under investigation and for that reason they are commonly prepared by pooling equal volumes of all of the samples in the experiment. Approximately 31% of the bibliographic records (Table S1) report QCs, among which 18% use a pool of samples as the QC sample. Nevertheless, the main purpose of QCs is their use in data processing, as will be discussed later.
Faecal sample treatment: direct metabolite extraction vs pretreatment
Faeces constitute the most common sample, as sample collection is non-invasive and traditional for microbiological diagnosis. The disadvantage is that they do not totally represent the microbiota attached to the intestinal epithelium and the bacteria from the uppermost intestinal sections may be totally degraded. The use of other types of samples from the gastrointestinal tract, such as biopsied tissues (Moreno-Navarrete et al. 2016), and from other body sites is acceptable, although the representation of the total microbiota and thus the microbial metabolome is not guarantee using existing methods. Other matrices that can be used in metabolomics research, such as urine (Rodrigues et al. 2016) or plasma (Fan et al. 2016), are listed in Supplementary Table S1.
As described above, faecal material is a complex matrix (Fig. 8) and, therefore, the outcomes of metabolomic studies are easily influenced by factors that may not be directly related to microbial activity. In this context, we asked ourselves whether there is any standard protocol to extract faecal metabolites, and more importantly, metabolites from bacteria in faeces representing the gut microbiota. To answer this question, two main approaches can be used regarding sample preparation and processing, which are described below.
The first corresponds to direct extraction of metabolites from the whole faecal sample, reviewed in detail by Deda et al. (2015). They offer a comprehensive revision studying different aspects and methodologies to deal with total faeces, paying attention to their storage and their preparation for NMR, LC-MS and GC-MS, mainly focusing on the former. Briefly, faecal material is resuspended in an appropriate solvent and directly subjected to metabolite extractions (for a full list of examples see Table S1). Following this approach, it is also interesting to point out that a study has recently been published devoted to optimising the extraction procedure in order to achieve maximum stability during sample extraction (Gratton et al. 2016). With this approach, a number of differentially abundant metabolites have been identified (Table S1); however, specific associations between a perturbation and metabolite contents have rarely been found when examining metabolites extracted from total faeces in large cohorts. It was believed most likely due to large interindividual variation due to age, body mass index (BMI), disease duration, dietary intake, lifestyle-related factors or medical history, to cite a few. However, such interindividual variation was recently proven to be caused by the heterogeneity of the metabolic profiles of whole stool samples, which contain a complex mixture of metabolites originating from the diet, the host and intestinal bacteria, which masks the real contribution of the gut microbiota to the metabolism in the gastrointestinal tract (Rojo et al. 2015a,b). Clearly, metabolites that are not directly absorbed or produced by the action of intestinal microbiota (e.g. imagine food intake and how variable this can be) seem to produce a bias in the metabolic profile.
Thus, a recent series of investigations (Pérez-Cobas et al. 2013b; Rojo et al. 2015a,b; Serrano-Villar et al. 2016a,b) showed that the analysis of metabolites accumulated inside gut microbial cells, previously separated from stool samples, rather than those from total faecal material, is more effective to find how a perturbation induces gut microbiota alterations. This pre-enrichment step was also found critical to allow for the proper representation of microbial proteins (Tanca et al. 2015). Metabolites that are directly produced or adsorbed (from environmental inputs or the host) by gut microbes are better indicators of changes in gut bacterial activity. Note that the analysis of metabolite levels inside gut bacterial cells may have a different interpretation to those found in plasma and, to some extent, in faecal fluids. However, this approach may provide information that can be directly linked to complementary microbial data, i.e. 16S rRNA gene profiles of active bacteria, which is difficult to achieve otherwise if the analysis incudes non-microbial metabolites (from the environment or host) commonly considered when working with whole faecal material. This approach has shown that several disorders and diseases, including obesity, autoimmune diseases such as SLE and infection diseases such as diarrhoea caused by C. difficile or other pathogens heterogeneously impact on the intestinal community architecture, while driving stable metabolome responses in the intestinal microbiota (Rojo et al. 2015a,b; Serrano-Villar et al. 2016b).
The protocol described above is based on prokaryotic cell separation using a preprocessing step which includes different centrifugation phases, followed by intracellular metabolite extraction using a two-step method optimised for both polar and hydrophobic metabolites. This bacterial enrichment separation protocol is also reported as efficient to eliminate eukaryotic cell contamination in the metabolome (Rojo et al. 2015a). Briefly, microbial cells are separated from the faecal matrix by mixing 0.4 g of faecal sample with 1.2 mL of phosphate-buffered saline (PBS) (1:3 w/v faeces to PBS ratio). Following resuspension (by 1 min of vigorous mixing), the samples are then centrifuged at 1000 g at 4°C for 1 min to remove faecal debris. The supernatant (1.2 mL) is transferred and centrifuged at 13 000 g at 4°C for 5 min to pellet the cells. This protocol is repeated three times. The cell counts in the bacterial pellets are then analysed by standard protocols (Bargiela et al. 2015), so the same amount of bacterial cells are further used in each extraction experiment. A total of 108 gut bacterial cells per sample are adequate for cold methanol (−80°C) extractions, in which 1.2 mL are added. The samples are then vortex-mixed (for 10 s) and sonicated for 30 s at 15 W in an ice cooler (−20°C). This protocol is repeated twice with a 5-min storage period at −20°C between each cycle. The final pellet is removed following centrifugation at 12 000 g for 10 min at 4°C. After the methanol extracts are obtained, the remaining cell pellets are resuspended in 1.2 mL of cold (4°C) H2O and subjected to three cycles of sonication for 20 s at 15 W in ice water. The samples are incubated on ice for 2 min between cycles. The final pellet is removed following centrifugation at 12 000 g for 10 min at 4°C. Finally, the H2O and methanol extracts are obtained, and a mixture is prepared by combining equal amounts (1 mL) of each extract.
This approach was used to show that several diseases are closely associated with specific metabolite profiles, which differ to that of healthy individuals (Rojo et al. 2015a,b; Serrano-Villar et al. 2016b). Interestingly, in healthy subjects for whom BMI is the only variable, BMI becomes a driving factor in determining microbial metabolic activity (Rojo et al. 2015b). By contrast, the absence of high body weight and lean subgroups in patients demonstrates that the presence of a disease seems to bear a greater pressure than BMI on bacterial metabolism. This novel result has not been highlighted before on examining whole faecal metabolomes for which discriminating metabolites could not be found within healthy controls.
It should be mentioned that a recent study (Vandeputte et al. 2016) found faeces consistency to be strongly associated with differences in gut microbiota richness and composition. Examination for metabolites in total faeces with different consistencies may be a problem due to differences in water content and solid material. In the literature under revision, several studies tackle this problem by lyophilising the samples, thus partially solving the issue related to different consistency and water content in the faecal material (Jacobs et al. 2008; Duboc et al. 2012, 2013; Phua et al. 2013; Weir et al. 2013; Sheflin et al. 2015; Vanden Bussche et al. 2015; Abdulkadir et al. 2016; Dior et al. 2016; Sinha et al. 2016). However, for biodiversity studies, that strategy may be problematic due to contamination and, if the aim of the research is to analyse only the bacterial metabolome, lyophilisation is not an option as it breaks some prokaryotic cells, thus releasing intracellular material than can be eliminated during the pre-enrichment steps described above. In that sense, the turning point is to standardise the number of bacteria previously separated from faeces prior to their metabolome extraction in order to be able to perform further comparative analysis independently of faeces consistency.
Another crucial point for further consideration is the extraction with solvent(s). Of the reviewed papers (Table S1), around 47% of the authors use a single solvent, the preferential option being PBS and methanol, about 20% employ a mixed solvent, the most popular being methanol/water and 15% prefer a methodology in which several solvents are used sequentially. By contrast, only 11% choose solid phase extraction (SPE). From the reported data, we cannot suggest any particular one as a gold standard for gut microbiota metabolomics; nevertheless, we point out two facts: (i) it is always better to extract using several solvents rather than a mixture due to the wider metabolic polarity coverage obtained and (ii) in target analysis the solvent selection is crucial and it should be optimised based on the analyte, e.g. short-chain fatty acids are extracted with water (Machiels et al. 2014; Windey et al. 2014) or acetonitrile (Ou et al. 2013), while bile acids with ethanol/PBS (Damms-Machado et al. 2015), SPE (Duboc et al. 2012, 2013; Dior et al. 2016), methanol combined with SPE (Kakiyama et al. 2013) or acetonitrile (Ou et al. 2013). In the words of Jules Griffin (Heather et al. 2013), different extraction procedures routinely have a greater effect on the metabolome than most genetic modifications do. This can be seen from the results of two studies comparing the effect of colorectal cancer on the faecal metabolome. Thus, Goedert et al. (2014), who used methanol, reported peptides, amino acids, heme-related metabolites, cofactors, vitamins, xenobiotics and lipids as discriminating metabolites in patients with colorectal cancer compared to healthy controls, whereas Weir et al. (2013), who used a mixture of isopropanol, acetonitrile and water, detected mostly fatty acids, amino acids, sugar alcohols, vitamins and steroids. Note that in this case, the utilisation of distinct analytic platforms, LC-MS and GC-MS, and GC-MS alone, respectively, may also be responsible for the observed differences (Table S1). By contrast, when the effect of liver cirrhosis was evaluated in two different cohorts using the same extraction solvent (methanol) and the same analytical platform (LC-MS), similar metabolites (i.e. lipids, bile acids and heme-related metabolites; Table S1) were found to discriminate liver cirrhosis patients from healthy controls (Cao et al. 2011; Huang et al. 2013). This demonstrates that the solvent used for metabolite extraction is a crucial point for consideration in any metabolomics project.
Analytical platform
The majority of the reviewed investigations are based on NMR (22%) or one separation technique coupled to MS (62%), whereas 16% of them use two (Table S1). These data should be considered taking into account also the aim of the study and, particularly, whether it is a fingerprinting approach. If the goal of fingerprinting is to produce the highest possible coverage, it is highly recommendable to use a multiplatform approach in order to avoid a potential bias in metabolite coverage. Of the reviewed literature focusing on fingerprinting, 70% use a single technique (Table S1). Among the platforms, the most common is LC-MS plus GC-MS (Kakiyama et al. 2013; Ou et al. 2013; Chow et al. 2014; Goedert et al. 2014; Damms-Machado et al. 2015; Sinha et al. 2016), followed by LC-MS plus CE-MS (Rojo et al. 2015a,b; Serrano-Villar et al. 2016a,b) and by LC-MS plus matrix-assisted laser desorption/ionisation Fourier transform ion cyclotron resonance-MS (De Leoz et al. 2013, 2015; Underwood et al. 2015).
A crucial point to be considered regarding the analytical platforms is the most suitable type of compound. For example, GC-MS is suited to volatile thermally stable compounds, whereas CE-MS is ideal for small ionisable molecules. The capabilities of LC-MS are greater in relation to the nature of the stationary phase of the column (e.g. a C18 column is ideal for non-polar compounds whereas a HILIC column can be devoted to polar analytes). An extensive review of the different types of HILIC stationary phases is provided by Rojo, Barbas and Rupérez (2012).
Focusing on the state of the art under revision, with respect to a fingerprinting approach, LC-MS is mainly used for different kinds of bile acids and lipids; CE-MS for amino acids, amines and carboxylic acids; and GC-MS and NMR for short-chain fatty acids and amino acids. Details of the type of compounds per analytical platform are presented in Fig. 9. The review by Xie et al. (2013) discusses the different analytical options to measure some key compounds of the gut ecosystem such as bile acids, short-chain fatty acids and choline metabolites.
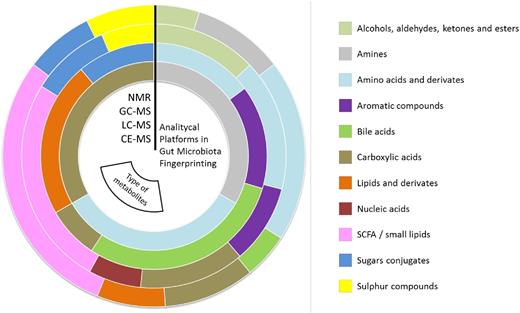
Percentage of each type of metabolite found to be biologically relevant in gut microbiota fingerprinting per analytical platform, represented as concentric circles (NMR, GC-MS, LC-MS and CE-MS respectively sorted from the outside to the inside). For full details, see Table S1.
Data treatment and validation
The result of the measurement of each sample is a profile with thousands of signals representing the broader possible set of metabolites. The profiles are then overlaid and a matrix is built. For all the individuals, all the signals are identified by their mass, retention time and the corresponding abundance. This is called a ‘metabolic feature’.
In metabolomics, it is quite normal to deal with a matrix with thousands of signals, although many of them are background noise. An experimental-based methodology has recently been proposed by Godzien et al. (2014) suggesting a double filter in order to keep the variables that are simultaneously present in (i) at least 50% of the samples of each group and (ii,a) present in at least 80% of the QCs that has a coefficient of variation below 30%, or (ii,b) present in <20% of the QCs. The idea behind this filtering criteria is to keep the group of variables with a reproducible signal across the whole profile (i and ii,a) and those present in only one group and, therefore, their reproducibility cannot be assessed with the QCs (i and ii,b). Notice that an intragroup presence of 50% is a flexible cut-off, which should be adapted to each experimental design (e.g. if the samples are technical replicates it should be increased). Another potential use of the QCs is their role when a large set of samples is analysed, and therefore normalisation procedures must be done in order to compare the signals recorded from all the samples. Here, QCs are crucial as a constant measurement inserted in between blocks of samples across the whole analytical run. An example of their use in this respect has been proposed by Dunn et al. (2011) and is called locally estimated scatterplot smoothing.
A missing value is the situation that occurs when no data are stored for a metabolite (variable) in a sample (observation). The metabolomics data are reported to comprise around 10%–40% of the missing values (Godzien et al. 2014). The origin of missing values can be caused by (i) a real absence of the value, (ii) the variable is present in the sample but it was missed in the data reprocessing or (iii) the variable is present in the sample below the limit of detection. Regarding missing values in data processing, the literature under evaluation reports (i) their replacement by mean (when <1/3 are missing) or by half of the minimum value of the variable (when between 1/3 and 2/3 are missing), maintaining zeros in the rest of the cases (Rojo et al. 2015a,b; Serrano-Villar et al. 2016a,b), (ii) consider them as zero under the limit of detection (Couch et al. 2013; Chow et al. 2014), (iii) input with the lower limit of detection for a given metabolite (Ahmed et al. 2016), (iv) substitute by half of the minimum of the intensity detected for the corresponding variable (Peng et al. 2015) or (v) using a zero-fill program to find the missing peak pairs from the raw MS data and fill in the missing values (Xu et al. 2015; Su et al. 2016). Taking into account the importance of this step for subsequent statistical tests, we favour the more thorough methodologies such as the recent study by Armitage et al. (2015), explaining that missing values affect the normality and homogeneity data variance and k-nearest neighbour imputation, or that by Huan and Li (2015), reporting a robust method for completing the missing values by a zero-fill program that finds the peak pair and inputs the calculated intensity ratio.
Statistical analysis to select potential markers can be done either by multivariate or univariate analysis, which is not specific of these types of experiments and falls outside the scope of this review. There are comprehensive reviews elsewhere (Steuer et al. 2007; Korman et al. 2012). The easiest and the most common way to identify a metabolic feature is to link its accurate mass with a certain structure using a public or inhouse database. For a review about public databases in MS Metabolomics, see the article by Vinaixa et al. (2015). In this respect, it is useful to mention that there are four levels of confidence in metabolite annotation (Salek et al. 2013): level 1, truly confirmed identifications; level 2, putatively annotated compounds; level 3, putatively characterised classed; and level 4, unknown compounds.
Once the potential markers have been selected, their quality can be measured by their sensitivity and specificity, which can be easily evaluated by receiver operator characteristic (ROC) curves as discussed by Xia et al. (2013), who suggest using ROC curves to select the ideal sample size by a retrospective procedure in which sensitivity, specificity and confidence interval are previously fixed. That opens a door to ‘samples saving’ or, in other words, to a more sensible use of the resources in clinics and research. With respect to validation, first it should be pointed out that this term mainly encompasses four different aspects: (i) analytical chemistry parameters (e.g. accuracy, precision, linearity, limit of detection, limit of quantification, etc.); (ii) mathematical model suitability (e.g. cross-validation, permutation test, etc.); (iii) confirmation of the identity/biological role of the metabolites (e.g. MS/MS analysis, multi-omics experiment, etc.); and (iv) biomarkers discovery, which requires confirmed identifications, ROC curves and to corroborate the same finding in a second cohort that ideally avoid any kind of interindividual variability which would require hundreds of samples. In this respect, in the literature under revision, what is usually considered as validation is (i) to test the mathematical model suitability or (ii) to confirm the biologically interesting compounds, which is manly done by MS/MS analysis, standard speaking or multiple reaction monitoring analysis (details in Table S1).
CONCLUSIONS AND FUTURE OUTLOOK
The densest and most complex bacterial community in the human body inhabits the large intestine and forms an ecosystem with interdependence and mutualism among the species that constitute it. This community is known as the gut microbiota and it is essential for homeostasis and health of the host. The gut microbiota performs functions of nutrition, metabolism (the result of biochemical activity) and protection (preventing the invasion of infectious agents or the overgrowth of resident species with pathogenic potential). It has also trophic functions for the proliferation and differentiation of the intestinal epithelium, and plays a role in the development and modulation of the immune system. However, our skin, respiratory system, oral cavity and vaginal/urinary cavity are also populated by a microbial community that is as diverse and important as that of the gastrointestinal tract. In total, our body is occupied by at least 5000 bacterial genera, which together comprise the adult microbiota. They are continuously exposed to factors that influence them dynamically, and their alteration can be seen as an indicator of human health status. Observations show that our microbiota experiences different compositional shifts due to the changes elicited by multiple factors, and efforts have been invested in their understanding. However, although there is no doubt that certain diseases, factors and covariates are linked to changes in the microbiota, it is unclear whether such changes are a cause or consequence. It still remains unclear how many multiple factors influence the composition, diversity, dynamics and metabolic performance of the microbiota with respect to its impact on host health, nor which microorganisms are active contributors under a given perturbation, and whether different covariates or diseases differentially or similarly impact our microbial ecosystems. Our lack of understanding of this issue lies in the fact that we still lack the definition of a ‘healthy microbiota’.
When faced with any disturbance, the microbiota can remain unaltered (showing resistance), return to the initial state after the disruptive effect disappears (displaying resilience) or even change in composition but not in function when this effect disappears (functional redundancy). Finally, disruptive, and in some occasions irreversible, effects both in composition and function can occurs (dysbiosis). These four concepts and their consequences highlight the importance of performing holistic studies in which all components of the microbiota, including microbes, genes, proteins and metabolic products, are examined in the context of systemic variables that are descriptive of diseases and disorders, or other health status. Understanding the associations using combined approaches of metagenomics, metatranscriptomics, metaproteomics and metametabolomics is one of the main challenges towards a system-level understanding of the human microbiome (Bikel et al. 2015; Aguilar-Pulido et al. 2016; Mondot and Lepage 2016).
For this reason, in this article, we critically review the factors linked to changes in the composition of our multiple microbial ecosystems (dead, quiescent and active microbes) and in their molecular agents (genes, proteins and metabolites). The results of a multivariate analysis based on multi-omics data associated multiple factors to changes in gut microbiota community composition, gene composition (metagenome), gene expression (metatranscriptome), protein expression (metaproteome) and metabolite production (meta-metabolome). Although many specific changes were found, a number of microbial groups (Figs 1–4) and functions have been reviewed and identified as being the most susceptible to alterations, as their abundances were consistently altered independently of the type, strength and duration of the perturbations. The revision of the published metabolomics data demonstrates that major alterations in the community structure imply major metabolic changes, so metabolites accumulated by gut microbes are the best indicators of functional changes in the microbiota. Metabolomics research also suggests that the association between bacteria and metabolites may be factor (i.e. disease) dependent, so that a bacterium can differ metabolically under different circumstances. These novel outcomes demonstrate the importance of metabolomics research in the context of human health, together with the fact that metabolites used or produced by our microbiota represent the most reliable snapshot of changes in the metabolic activity of our microbiota, some of which play a crucial role in health.
The information provided in this review stresses the fact that, particularly in metabolomics, standardisation of methods is required, ranging from sample storage and processing to metabolite extraction and analysis. This is also the case for other –omics such as genomics, to compare different datasets and to identify metabolite biomarkers in large cohorts of individuals affected by different perturbations. This, together with future efforts to analyse the active fraction of the microbiota in terms of active genes (metatranscriptomes) and proteins (metaproteomes) will help to identify strong associations between the active fraction of the gut microbiota that changes with different diseases, disorders, interventions or any external factors and the microbiome metabolic output (exemplified by the meta-metabolome). This will help researchers to clearly identify which metabolic and bacterial changes are partially random consequences of a given perturbation, and which are potential causes, as well as their associations.
SUPPLEMENTARY DATA
Supplementary data are available at FEMSRE online.
Acknowledgments
We would like to thank Fabiola Baraclough for her excellent support in english grammar and usage, typographical and proofreading revision.
FUNDING
This work was supported by the Spanish Ministry of Economy, Industry and Competitiveness (CTQ2014-55279-R and BIO2014-54494-R) to which C.B., D.R. and M.F. would like to acknowledge funding. This study was supported also by funds from Leading National Research Center in Bialystok. This work was supported by grants to A.M. from the Spanish Ministry of Economy, Industry and Competitiveness (projects SAF 2012-31187, SAF2013-49788-EXP, SAF2015-65878-R), Carlos III Institute of Health (projects PIE14/00045 and AC15/00022), Generalitat Valenciana (project PrometeoII/2014/065) and co-financed by FEDER.
Conflict of interest. None declared.
REFERENCES
