


Staphylococcus aureus is an important human pathogen that causes life-threatening infections, and is resistant to the majority of our antibiotic arsenal. This resistance is complicated by the observation that most antibacterial agents target actively growing cells, thus, proving ineffective against slow growing populations, such as cells within a biofilm or in stationary phase. Recently, our group generated updated genome annotation files for S. aureus that not only include protein-coding genes but also regulatory and small RNAs. As such, these annotation files were used to perform a transcriptomic analysis in order to understand the metabolic and physiological changes that occur during transition from active growth to stationary phase; with a focus on sRNAs. We observed ∼24% of protein-coding and 34% of sRNA genes displaying changes in expression by ≥3-fold. Collectively, this study adds to our understanding of S. aureus adaptation to nutrient-limiting conditions, and sheds new light onto the contribution of sRNAs to this process.
BACKGROUND AND INTRODUCTION
Staphylococcus aureus is an important human pathogen that is able to cause disease in a variety of sites within the human host. The ability to foster devastating and recurring infections results from its ability to produce large amounts of virulence determinants that enable disease causation and immune evasion. In addition, the treatment of S. aureus infections has proven increasingly difficult, due to its ability to resist killing by the majority of our antibiotic arsenal. This is compounded by the fact that most antibacterial agents only target actively growing cells, thus, proving ineffective against slow growing and non-dividing populations, such as cells within a biofilm or in stationary phase (reviewed in Stewart and Costerton 2001; Donlan and Costerton 2002; Hall-Stoodley, Costerton and Stoodley 2004; Bridier et al. 2011; Stewart 2015). Indeed, only a limited number of studies have demonstrated activity of therapeutics against stationary phase cultures (Mascio, Alder and Silverman 2007; Belley et al. 2009; Podos et al. 2012). Thus, a better understanding of the metabolic and physiological changes that occur during transition from active growth to stationary phase would be of significant utility in the development of antibiotics effective against slow-growing and non-dividing bacteria.
Although an increased knowledge of transcriptional regulation has been generated by high-throughput transcriptomic methods, and in particular RNA-sequencing, the majority of studies have been performed during exponential growth. Indeed, to date only a handful of studies have investigated global transcriptional changes after a culture enters stationary phase, with the majority of them focused on virulence determinant expression, rather than on wholesale changes within the cell. Additionally, it has become apparent that adaptation to various environmental conditions and stimuli, e.g. higher culture densities and/or low-nutrient availability, is not solely driven by classical proteinaceous regulators, but also by small, regulatory RNAs (sRNAs) (Repoila, Majdalani and Gottesman 2003; Landt et al. 2010). Consequently, our group has exerted significant efforts to establish a comprehensive overview of sRNAs in S. aureus and other organisms, facilitating a better understanding of how these important elements influence adaptation to changing environmental conditions (Carroll et al. 2016; Weiss et al. 2016)
As such, in the present study, we perform RNA-sequencing on stationary phase S. aureus cultures and identify wholesale transcriptomic changes that occur, not only for protein-coding genes but also, for the first time, sRNAs.
METHODS
To describe alterations in the S. aureus (USA300-Houston; Highlander et al. 2007) transcriptome during different growth phases, we compared two RNA-sequencing datasets from cells grown for 3 (exponential phase) and 16 h (stationary phase). RNA-sequencing and data analysis was performed according to Carroll, Weiss and Shaw 2016. Briefly, cells were synchronized in TSB (shaking, 37°C) as described previously (Kolar et al. 2011) before being grown for 3 or 16 h. Cultures were then harvested and RNA isolated using an RNeasy kit (Qiagen, Hilden, Germany), with DNA removed using a TURBO DNA-free kit (Ambion/Thermo Fisher Scientific, Waltham, MA). RNA quantity and quality was assessed using an Agilent 2100 Bioanalyzer system and a RNA 6000 Nano kit (Agilent, Santa Clara, CA), before three independent biological replicates were mixed in an equimolar ratio. rRNA was removed with a Ribo-Zero bacterial rRNA removal kit (Epicentre, Madison, WI) and MICROBExpress bacterial mRNA enrichment kit (Agilent, Santa Clara, CA). Removal of rRNA was confirmed on an Agilent 2100 Bioanalyzer system using a RNA 6000 Nano kit, followed by cDNA generation (Total RNA-seq kit v2, Ion Torrent/Thermo Fisher Scientific, Waltham, MA). Library quality and concentration was assessed using an Agilent Bioanalyzer 2100 system and a High Sensitivity DNA kit (Agilent, Santa Clara, CA), before being bound to Ion Sphere Particles (ISPs). These were amplified and enriched using an Ion PGM Template OT2 200 kit and an Ion OneTouch 2 system (Ion Torrent/Thermo Fisher Scientific, Waltham, MA). Template-positive ISPs were subjected to sequence analysis using an Ion Torrent Personal Genome Machine (PGM), with data analyzed using CLC Genomics Workbench (CLC-Bio, Aarhus, Denmark) with the standard RNA-seq analysis settings. Expression values were calculated as RPKM (reads per kilobase material per million reads) and subjected to quantile normalization, with a threshold of 10 RPKM applied as the lower cutoff (McClure et al. 2013). All sequences generated were aligned to our publicly available S. aureus annotation files (https://dx.doi.org/10.6084/m9.figshare.2061132.v1) (Carroll et al. 2016). All data were deposited in GEO under accession number GSE77242 (http://www.ncbi.nlm.nih.gov/geo/query/acc.cgi?acc=GSE77242). Gene clusters and pathways displaying altered expression (±10-fold) during stationary phase were assessed using the Database for Annotation, Visualization and Integrated Discovery (David) (Huang da, Sherman and Lempicki 2009).
RESULTS
We identified ∼24% (640) of protein-coding genes with ≥ ±3-fold change in expression during stationary phase (Table S1, Supporting Information), and ∼6% (159) with ≥ ±10-fold alterations (Figs 1A and 2A). For both subgroups, the number of up- and downregulated genes was relatively similar (≥ ±3 = 296 versus 344; ≥ ±10 = 80 versus 79, respectively). Importantly, several of the identified changes have previously been described, including protein A (spa), which displays a 14-fold decrease in expression (described by Gao and Stewart 2004) and α-toxin (hla), which is 13-fold upregulated in our experiment (shown by Xiong et al. 2006; Yarwood et al. 2002). In addition, we observed 15 genes that showed alterations in transcription ≥100-fold, with six upregulated and nine downregulated (Fig. 1A). The strongest decrease (2841-fold) was found for SAUSA300_1997, a SirA-like protein. SirA is involved in iron-uptake, and acts by recognizing and binding staphyloferrin B (Heinrichs et al. 1999; Grigg et al. 2010). Additionally, the downstream gene (SAUSA300_1998), which, from our bioinformatic analysis (not shown), appears to be transcribed as part of the same operon, displays a complete absence of expression during stationary phase. Interestingly, SAUSA300_1998 encodes a sulfur-transporter domain, and therefore could act in concert with SAUSA300_1997 to import sulfur or sulfur-bound proteins. Furthermore, the SAUSA300_0173-SAUSA300_0177 operon showed >100-fold decreased expression. This operon may encode an ABC transporter for nitrate and/or sulfonate based on the ATPase of the system, with SAUSA300_0174, showing similarity to the NrtD/SsuB and TauB family of ABC-type nitrate/sulfonate transporters. Notably, most of the discussed genes/operons displaying large-scale changes in expression after entry into stationary growth are import/export system, highlighting changing requirements for uptake and secretion based on the nutritional status of the cell.
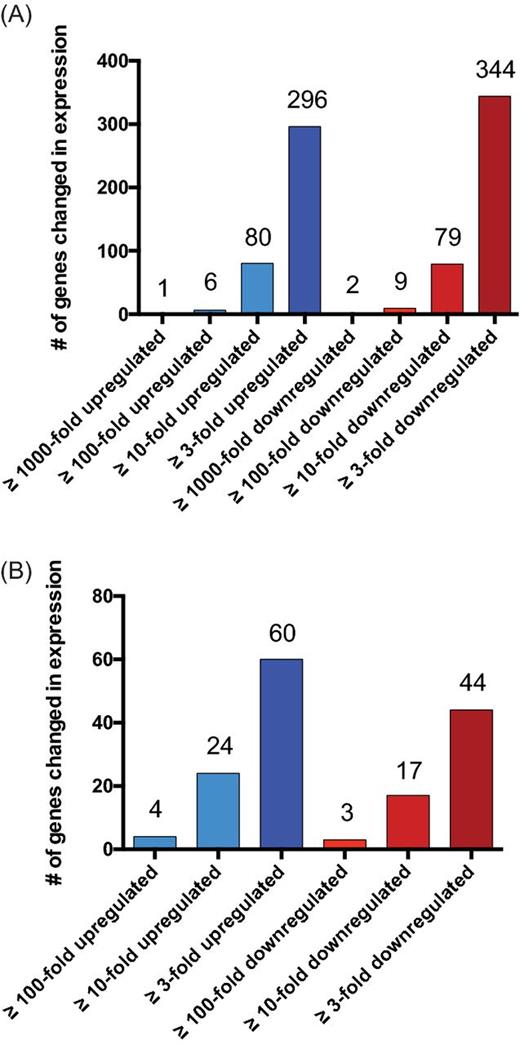
Changes in the S. aureus transcriptome during stationary growth. Shown is an overview of transcriptional changes for (A) protein-coding and (B) sRNA transcripts when comparing stationary and exponential growth.
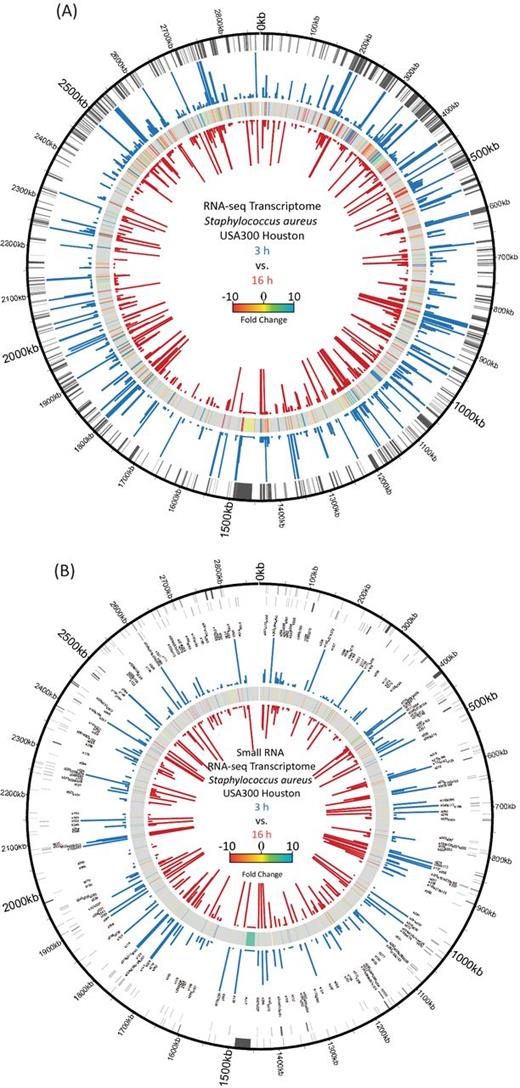
Genomic maps depicting transcriptomic changes during exponential and stationary phase growth of S. aureus. (A) For protein-coding genes, the chromosomal location (outer circle) as well as expression values for exponential (blue bars) and stationary phase (red bars) cultures are displayed. In between expression values, transcriptional fold changes are shown. For increased accessibility, the figure contains only genes that showed a ≥ ±3-fold alteration in expression. (B) sRNA annotations are shown in sense (outer circle) and antisense (second circle) directions, along with the corresponding gene names. The RPKMs for exponential (blue bars) and stationary (red bars) cultures, as well comparative fold changes (in between), are shown. For both transcriptome figures, the cutoff for expression strength displayed is 1000 RPKM, with genes higher than this displayed as 1000 in order to make lowly expressed genes more visible.
Beyond these changes, our dataset also shows shifts in metabolic processes. To explore these further, we used the DAVID tool and observed a variety of processes to be dependent on growth phase and nutrient availability (Table S3, Supporting Information) (Huang da, Sherman and Lempicki 2009). Downregulated pathways included, amongst others, fructose and mannose metabolism and glycolysis, showing alterations in energy generation after high-density growth and resulting carbon deprivation. Concomitantly, to increase the availability of glucose, genes encoding proteins involved in gluconeogenesis were strongly induced, including pckA (SAUSA300_1731, +153-fold), encoding a phosphoenolpyruvate carboxykinase, the glyceraldehyde-3P-dehydrogenase gene gapB (SAUSA300_1633, +48-fold) and fbp (SAUSA300_2455, +11-fold), which encodes Fructose-1,6-bisphosphatase (Table S1, Supporting Information).
Most of the additional transcripts that showed strongly increased abundance belong to pathways involved in purine or purine–precursor synthesis and binding (Table S3, Supporting Information). This increase in transcriptional activity toward these pathways highlights depletion of nucleic acid components later in growth, and an attempt to overcome such limitation by the synthesis of nucleic acid building blocks. Additionally, we identified a variety of upregulated genes that are involved in the degradation of amino acids, including hutI and hutU (imidazolonepropionase (+30.5-fold) and urocanate hydratase (+45-fold)), which degrade histidine, highlighting the need to employ alternative carbon (and nitrogen) sources during glucose-deprived conditions (Table S1, Supporting Information) (Zhang and Rainey 2007).
In addition to protein-encoding transcripts, we also observed wholesale changes in non-coding transcript abundance (Figs 1B and 2B). Here, we found 34.3% of sRNAs (104 of 303 [Carroll et al. 2016]) demonstrating differential expression (≥ ±3-fold) during stationary growth (Table S2, Supporting Information). Of the 60 sRNAs with higher expression during stationary phase, rsaOG (SAUSA300s046) was one of the most affected sRNAs with a 102-fold increase (Marchais et al. 2009, 2010). Interestingly, this sRNA was previously shown by our group to be strongly upregulated during growth in human serum, suggesting a similar role during high-density growth to that in more pathophysiological relevant media (Carroll et al. 2016). Another sRNA, Teg124 (SAUSA300s099), was found to be the second most strongly upregulated sRNA (55.5-fold) during stationary growth (Beaume et al. 2010). Interestingly, this transcript is located on a pathogenicity island and therefore has been suggested to have a role in S. aureus virulence (Felden et al. 2011).
In addition to this, we observed 44 sRNAs that were expressed to a lower extent during stationary phase (Fig. 1B; Table S2, Supporting Information). The strongest downregulated (−141-fold) was Sau-6569 (SAUSA300s171), which has previously been identified, but has no known role to date (Abu-Qatouseh et al. 2010). Another sRNA whose expression is almost completely abolished (−120.7-fold) is Teg125. According to the TargetRNA2 algorithm (Kery et al. 2014), this sRNA may interact with the femA mRNA, 8 nt upstream of its translational start site. FemA is a protein that is important for the development of methicillin resistance in S. aureus (Berger-Bachi et al. 1989) and is widely conserved across clinical isolates (Kobayashi et al. 1994). Although the FemA protein is present at higher levels during exponential growth (Johnson, Kruger and Labischinski 1995), we do not see any significant changes in transcript level when comparing exponential and stationary phases. Therefore, the higher FemA protein levels during exponential phase could be caused by differences in translational efficiency of the femA transcript, possibly resulting from interaction with a sRNA partner.
Although a number of sRNAs display at least a 10-fold change in expression, it is important to note that the influence of those with smaller changes could also have meaningful biological significance. For example, sRNAs can regulate mRNA targets via targeted binding, resulting in the degradation of both molecules. Therefore, an equimolar ratio of sRNA and mRNA target represents an equilibrium that will shift as sRNA expression increases and mRNA stability decreases. Conversely, a decrease in sRNA expression below the equilibrium will proportionally increase the abundance of the mRNA target. Thus, a subtle change in the expression of a given sRNA may have a large-scale impact on its target specifically, and cellular physiology in general (reviewed in Levine and Hwa 2008; Beisel and Storz 2010).
CONCLUDING REMARKS
Collectively, our dataset highlights the global changes that occur within cells upon entry into stationary phase. In addition to alterations in protein-coding transcripts, including various metabolic pathways and transport systems, we observed major changes in sRNA expression. With respect to these latter elements, our findings are noteworthy because, for the vast majority of sRNAs, no cellular function has been experimentally determined. Therefore, we suggest that by connecting sRNA expression to environmental stimuli, such as high-density growth, we can generate new insights into possible functions of these understudied transcripts. This is particularly significant when one considers that these elements outnumber proteinacious regulators by ∼2:1 (Ibarra et al. 2013; Carroll et al. 2016). Therefore, our work presents not only an important study of cellular changes during stationary growth, but also serves as a first step towards integrating sRNAs into existing regulatory networks.
SUPPLEMENTARY DATA
FUNDING
This study was supported in part by grant AI080626 (LNS) from the National Institute of Allergy and Infectious Diseases.
Conflict of interest. None declared.
REFERENCES
