


Abstract
The aim of the study was to evaluate intracellular interferon-γ (IFN-γ), and interleukin-4 (IL-4) levels in pre- and post-treatment periods of brucellosis patients and to determine the relationship between these parameters and patients' clinical findings. Twenty-five patients diagnosed as brucellosis and 11 aged-matched healthy volunteers were included in the study. CD3+CD4+ T lymphocytes levels were significantly lower in patients with brucellosis as compared to the control group. CD3+CD8+ T lymphocytes and CD3+IFN-γ+ levels were increased in brucellosis patients compared with the control group. CD4+IFN-γ+ and CD4+IL-4+ levels were no different between patients and healthy individuals. CD3+IL-4+ levels decreased in patients compared with healthy controls. Pre-treatment CD3+IFN-γ+ levels dramatically increased in patients responsive to management compared with the unresponsive ones. In responsive cases, CD3+IFN-γ+ levels decreased statistically after the treatment while in unresponsive cases no meaningful change was observed with respect to treatment. Adding IFN-γ to the treatment for improving the depleted levels of IFN-γ can be beneficial in patients with brucellosis who shows a tendency to chronicity or patients who do not respond to the treatment.
1 Introduction
Brucellosis is one of the most important zoonosis that affects human welfare and livestock health worldwide. The disease is caused by bacteria of the genus Brucellae comprised of different species that vary in their affinity and virulence to several hosts [1,2]. Brucella is a facultative, intracellular pathogen that can reside within phagocytic cells of the host and is apparently resistant to the normal mechanisms of bacterial killing [3].
The response against Brucellae spp. involves the whole gamut of the immune system, from innate to adaptive immunity. In addition to the macrophage, which plays a major role in Brucella infections, other cells of the innate immune response are recruited and influenced by the interactions between bacteria and host [4–6]. The cellular immune response is a critical part of the defense of the host against intracellular bacterial infections [7,8]. Critical aspects in this response include secretion of IL-12 and IFN-γ involving antigen presenting cells APCs and Th1 cells [4–6]. IFN-γ reduces bacterial multiplication inside infected autologous macrophages [5,8,9]. Th1 cells, which produce interferon (IFN-γ), IL-2 and tumor necrosis factor (TNF)-β, evoke cell-mediated immunity and phagocyte-dependent inflammation.
Th2 cytokine, IL-4, evokes strong antibody responses and eosinophil accumulation; but inhibits several functions of phagocytic cells. Both environmental and genetic factors act in concert to determine the Th1 or Th2 polarization [8,10–12]. Both CD4+ and CD8+ T cell populations contribute to the immune response to B. abortus producing IFN-γ and IL-2. B. abortus can induce differentiation of Th0 into Th1-type cell [13].
Although there is substantial information about the role of cytokines and T cells in murine brucellosis, knowledge of cellular immune responses in humans is scarce. In order to characterize the cytokine profile of Th-cell-mediated effector responses, different methodological approaches have been attempted such as cloning RT-PCR, in situ hybridization, immunocytochemistry, ELIspot and intracellular staining by flow cytometry methods. Intracellular staining by flow cytometry methods used to detect polarized Th1 or Th2 responses is relatively simple and highly sensitive. It allows detection of cytokine synthesis at single cell level. In the present study, we evaluated the intracellular interferon-γ (IFN-γ), and interleukin-4 (IL-4) levels and their alterations with treatment in patients with brucellosis.
2 Materials and methods
2.1 Patients
Consent for this study was approved by the Local Ethics Committee. The study included 25 patients with acute brucellosis (16 males and nine females; between 18 and 77 years of age). Brucellosis diagnosis was based on clinical, serologic, bacteriologic, and epidemiologic data. The diagnostic criteria were; isolation of a Brucella species from blood culture (Bactec 9050, Becton Dickinson diagnostic Instrument System, Sparks, USA) or a single Brucella titer of ≥1/160 (by standard tube agglutination (STA) or Coombs test) confirmed by a 2-merkaptoethanol test (2-ME) titer of ≥1/160 in association with compatible clinical findings. The presence of a 2-ME test titre ≥1/160 was suggestive of an ongoing infection.
The control group included 11 healthy volunteers, seven males and four females, ages ranging between 17 and 90. The cases in the control group were STA negative, showed erythrocyte sedimentation rate (ESR) within normal limits and did not have any complaints. Exclusion criteria for the healthy control subjects included acute/chronic diseases, smoking, medication, pregnancy and any abnormalities in renal and liver function tests. All patients and healthy individuals were informed about the study, and signed consent forms.
2.1.1 Treatment
A combined treatment of doxycycline or tetracycline with one of the antimicrobial agents (rifampin, streptomycin) was started for all patients and continued for 45 days and during this period the patients were monitored. The patients were invited for monitoring after the treatment period. Responders were identified as; improvement of clinical findings with 2-ME tests being ≤1/80 after the treatment. Non-responders identified as; ongoing complaints such as fever, myalgia and other constitutional symptoms with 2-ME test being ≥1/160 at after the treatment.
Blood samples were obtained before and immediately after the end of 6 weeks' treatment period from all patients and healthy individuals (control group). Two milliliter venous blood samples were taken into heparinized tubes. Intracellular IFN-γ and IL-4 levels within CD4+ and CD3+ cells were established in these blood samples.
2.1.2 Flow cytometry analysis
Triple-color intracellular staining flow cytometric analysis was performed on a FACScan flow cytometer (Becton Dickinson, San Jose, CA) using CD3 PerCP, CD4 FITC, PE, CD8 PE, isotype control, IFN-γ FITC, and IL-4 PE monoclonal antibodies manufactured by Becton Dickinson. Results were analyzed using CellQuest software (Becton Dickinson). Following calibration, 10,000 cells were analyzed from each tube, and analysis gates were set on CD3 PerCP positive lymphocytes according to both forward and side scatter profiles.
Alternative protocol-activation and intracellular staining of whole blood were performed as instructed by manufacturers protocols (BD Biosciences: Pharmingen: Protocol). The venous blood was diluted with RPMI 1640 medium (1:1, v/v) and mixed well. The cells were incubated for 5 h in 5% CO2 at 37 °C as a protein transport inhibitor in the presence of Brefeldin A (1.0 µg ml−1, Sigma), cell activator with Phorbol 12-Myristate 13 Acetate (PMA) (Sigma) and calcium ionophore (Sigma). Then, 2 ml of PharMLyse™ was added (BD Biosciences) and incubated for 10 min at room temperature in the dark. The tubes were centrifuged (5 min, 500g). Having discarded the supernatants, the cells were washed with staining buffer (Dulbecco's PBS, 3% heat-inactivated FCS, 0.09% (w/v) sodium azide, pH: 7.4–7.6). The cells (106) were incubated in 50 µl of Staining Buffer with a pre-titrated optimal concentration (≤0.5 µg) of a fluorochrome-conjugated monoclonal antibody specific for cell surface antigens (CD3 PerCP, CD4 PE, FITC, CD8 PE) (30 min, 4 °C). Then, the cells were then washed with staining buffer and centrifuged (250g), and supernatants discarded. In order to permeabilize the cells, they were re-suspended in 100 µl (250 µl for staining in tubes) of Cytofix/Cytoperm™ (BD Biosciences Pharmingen) solution for 10–20 min at 4 °C. Wash and centrifuge steps were repeated, and supernatants were removed. The cells were then incubated with 50 µl of Perm/Wash™ solution (100 µl for staining in tubes) containing a pre-determined optimal concentration of a fluorochrome-conjugated anti-cytokine antibody (IFN-γ FITC and IL-4 PE) at 4 °C for 30 min in the dark. The cells were washed twice with 1×Perm/Wash™ solution (1 ml wash−1 for staining in tubes) and re-suspended in staining buffer prior to flow cytometric analysis.
Statistical analyses were made with SPSS 11.0 for Windows. Wilcoxon's Signed Rank test was used for evaluations within groups and Mann–Whitney U tests were used for comparisons between groups. Correlations between parameters were evaluated with Spearman correlation analysis. p < 0.05 values were accepted as statistically significant.
3 Results
The mean ages were 36.40 ± 18.23 years and 37.09 ± 19.31 years in the patients and healthy individuals, respectively. The most common complaints of the patients were fever and sweating (Table 1).
Complaints of the patients with brucellosis
| Complaints | n | % |
| Fever | 21 | 84 |
| Sweating | 18 | 72 |
| Arthralgia | 16 | 64 |
| Headache | 13 | 52 |
| Malaise | 16 | 64 |
| Lack of appetite (anorexia) | 12 | 48 |
| Back pain | 4 | 16 |
| Weight loss | 11 | 44 |
| Complaints | n | % |
| Fever | 21 | 84 |
| Sweating | 18 | 72 |
| Arthralgia | 16 | 64 |
| Headache | 13 | 52 |
| Malaise | 16 | 64 |
| Lack of appetite (anorexia) | 12 | 48 |
| Back pain | 4 | 16 |
| Weight loss | 11 | 44 |
Brucella species were isolated from the blood cultures in 15 cases (60%). All the Brucella species were identified as Brucella melitensis. No response was observed to the treatment in six of the cases. Data taken by flow cytometric analysis of the groups before and after treatment are presented in Table 2.
Pre-treatment and post-treatment intracellular cytokines and T cell counts in the cases (n= 25) and comparison with the control group (n= 11)
SD, standard deviation.
Versus control (p < 0.0001).
Versus control (p < 0.005).
Versus control and post-treatment (p < 0.01).
Versus control (p < 0.05).
Pre-treatment and post-treatment intracellular cytokines and T cell counts in the cases (n= 25) and comparison with the control group (n= 11)
SD, standard deviation.
Versus control (p < 0.0001).
Versus control (p < 0.005).
Versus control and post-treatment (p < 0.01).
Versus control (p < 0.05).
CD3+CD4+ T lymphocytes levels remarkably decreased (p < 0.0001), but CD3+CD8+ T lymphocytes levels increased in patients in comparison with the control groups (p < 0.005). CD3+IFN-γ+ levels elevated in patients compared with the control groups (p < 0.01), on the contrary, CD3+IL-4+ levels decreased in patients (p < 0.05). CD4+IFN-γ+ levels did not differ between patients and healthy individuals. CD4+IL-4+ levels were not significantly higher in healthy individuals compared to the patients before treatment.
Intracellular cytokines levels and T cell counts were measured in the patients who responded to the treatment for 45 day and these results were compared with the patients who had no response to the treatment. Pre-treatment CD3+IFN-γ+ levels were higher in responsive patients than the unresponsive group (p < 0.05). Pre-treatment CD4+IFN-γ+ levels were also higher in patients responsive to the treatment than the patients unresponsive to the treatment but statistically significant differences were not observed between them (Table 3, Figs. 1 and 2). In responsive cases, while CD3+IFN-γ+ levels decreased significantly, no significant change was observed in CD3+IL-4+ and CD4+IL-4+ levels. In unresponsive cases, no significant changes were observed in pre- and post-treatment CD3+IFN-γ+ levels (Table 3). CD3+IL-4+ (pre-treatment period), CD4+IL-4+ (pre- and post-treatment periods) levels in the patients with positive blood culture were lower than the levels of the patients with negative blood culture. Patients received three different regimens: six of them received doxycycline + streptomycin, 16 of them doxycycline + rifampin, and three of them received doxycycline + streptomycin + rifampin; there were no significant differences in the levels of intracellular cytokines according to these regimens.
Pre-treatment and post-treatment intracellular cytokines and T cell counts responder in the cases (n= 19) and comparison with the non-responder (n= 6)
SD, standard deviation; responder, in-patient with response to treatment; non-responder, in-patient with no response to treatment.
Versus responder post-treatment and non-responder pre-treatment (p < 0.05).
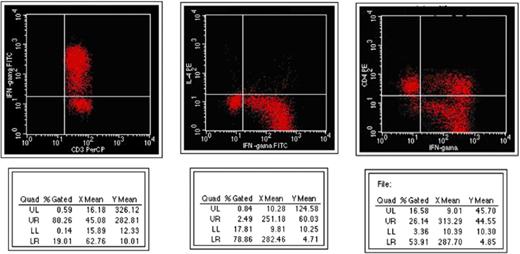
Appearance of intracellular cytokines before management in responsive patients in flow cytometry.
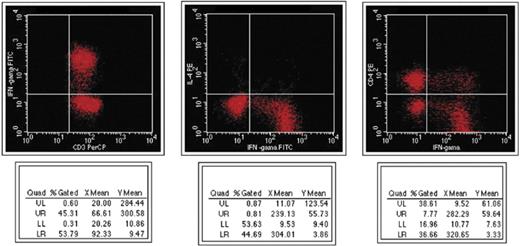
Appearance of intracellular cytokines before management in non-responsive patients in flow cytometry.
4 Discussion
Even if intracellular cytokine mRNA level is high, its active extracellular levels can be found to be low [14,15]. In this report, in order to evaluate the changes in production of cytokines, we assessed the intracellular cytokine levels in the disease.
Determining the complex cytokine profile during an infectious disease is important in the understanding of the pathogenesis, prognosis and treatment of disease [16]. Facultative intracellular bacteria, including Listeria monocytogenes, Mycobacterium tuberculosis, Mycobacterium leprae, Brucella abortus and Salmonella spp., survive within normal resident macrophages and other non-professional phagocytes. Th1-dominated immune responses predominantly produce a phagocyte-dependent inflammation. Th2 cells evoke strong antibody responses, including IgE.
The passive transfer of immune cells in BALB/c mice has shown that the protection against Brucella abortus is mediated by CD4+ T cells, and more recently, it has also been demonstrated that CD8+ T cells play a role in the resistance to Brucella infection [18]. In this study, CD3+CD4+ T lymphocytes levels in patients were decreased but CD3+CD8+ T lymphocytes levels were increased.
Moreno-Lafont et al. [19] demonstrated that peripheral blood mononuclear cells from chronically ill patients with brucellosis proliferated in response to a sonicated bacterial suspension rich in internal antigens, whereas cells from patients with acute brucellosis did not. Patients with untreated acute brucellosis have a diminished proliferative and IFN-γ response to the polyclonal mitogens PHA [20,21]. However, Giambartolomei et al. [22] found that this response was specific to cytoplasmic protein (CP). In this study, it was shown that IFN-γ levels in patients with brucellosis were enhanced to PMA, despite some contradictory results in the literature [20,21]. The Th1-like immune response showed an increase of CD3+IFN-γ+ levels with reduced CD3+IL-4+ and CD4+IL-4+ levels. In a study, both CD3+CD4+ and CD3+CD8+ T cells produced IFN-γ in mice infected with Brucella abortus but CD3+CD8+ cells produced more IFN-γ than CD3+CD4+ cells [23]. In our study, CD3+IFN-γ+ levels increased in patients with brucellosis in comparison with the control group. However, CD4+IFN-γ+ levels were not significantly different between patients and healthy individuals. We suggest that elevated levels of CD3+IFN-γ+ resulted from the increased numbers of CD3+CD8+ T lymphocytes in patients with brucellosis.
Gamma interferon (IFN-γ) produced by CD4+ and CD8+ T lymphocytes plays an important role in recovery from infection by these organisms [17,24]. Giambartolomei et al. [22] demonstrated that patients with acute brucellosis display a Th1 type response with cell proliferation and production of IFN-γ and IL-2, whereas the patients with the chronic form of the disease (7 of 11 non-responder patients) do not. Likewise, in this study, pre-treatment CD3+IFN-γ+ levels were statistically higher in persons who responded to the treatment than in non-responders. However, pre-treatment CD4+IFN-γ+ levels showed higher levels in responders than non-responding patients were but not statistically significant. The low-level synthesis of IFN-γ in non-responders could be responsible for a reduced cellular immune response. It has been reported that serum levels of IFN-γ dropped as a result of treatment [25]. We observed that levels of intracellular CD3+IFN-γ+ significantly decreased at the end of the treatment in responder patients, whereas the levels of CD3+IL-4 and CD4+IL-4+ did not show any significant alteration.
During Brucella infection various cytokines such as IFN-γ, TNF-α, IL-2, IL-10, IL-12 control intracellular multiplication of Brucella in macrophages. IFN-γ is the most relevant for generating macrophages with strong activity for killing intracellular Brucella. Furthermore, cytokines such as IL-2, IL-10 and IL-12 influence the acquired cellular resistance and specifically contribute to the control of Brucella multiplication. These cytokines seem to act via the IFN-γ-dependent pathway [26]. The Th1/Th2 paradigm not only allows a better understanding of the fundamental mechanisms involved in the protection against infectious agents and in the pathogenesis of several immunopathological disorders, but also provides the basis for the development of novel therapeutic strategies.
5 Summary
In the present study, it was determined that the pre-treatment CD3+IFN-γ+ levels were higher in responsive patients than unresponsive group. In responsive cases, after standard treatment of 45 days, CD3+IFN-γ+ levels decreased significantly. In unresponsive cases, no significant changes were observed between pre- and post-treatment CD3+IFN-γ+ levels. The level of IFN-γ seems to be related to the patient's clinical status. This infers that addition of IFN-γ to the treatment for improving the depleted levels of IFN-γ can be beneficial in patients with brucellosis who show a tendency to chronicity or patients that do not respond to the treatment. Further studies should be performed on this subject.
References
