


Abstract
Aboriginal infants and children in rural communities in Northern Australia have high rates of nasopharyngeal carriage of nonencapsulated Haemophilus influenzae (NCHi), with positive swab rates of 76%. In this population, the acquisition of NCHi from soon after birth is associated with the onset of otitis media and with muco-purulent nasal discharge, while the long-term persistence of NCHi carriage is associated with the acquisition and turnover of large numbers of antigenically diverse strains. Mathematical models have been fitted to data on the acquisition and loss of encapsulated strains of H. influenzae and 43 different strains of NCHi in 10 children followed from early infancy for up to 2 years. Subject to plausible assumptions, the preferred model estimated the mean time to acquisition of a H. influenzae strain to be 7 days after first becoming exposed after birth. For an infant already carrying H. influenzae, each additional strain was acquired after a mean waiting period of 45 days. On average, 1.50 different strains of H. influenzae were detected in four colonies routinely typed from each positive swab, but it was estimated that another 2.55 strains were ‘hidden’ behind these more frequent strains. With an average of 4.05 strains per carrier, it was estimated that each strain was carried for an average of 137 days, although detected on only 37% of occasions. Thus we have developed mathematical models that provide estimates for duration of colonisation, time to colonisation, and number of colonising strains in a population in which H. influenzae is highly endemic, characterised by sequential and concurrent carriage of multiple strains in each infant.
1 Introduction
Overcrowding and poor hygiene are associated with high rates of bacterial cross-infection and with high rates of endemic bacterial carriage and disease in affected communities. High rates of nasopharyngeal carriage of Streptococcus pneumoniae (up to 90%) have been reported from overcrowded and socially disadvantaged populations seen, for example, in city slums in the 1930s [1], in New Guinea highlanders [2], and in Aboriginal Australians [3,4]. Such high rates of carriage are associated with high rates of invasive pneumococcal disease [2,5]. Similarly high rates of carriage of Haemophilus influenzae contribute to otitis media and bronchitis in children and to chronic bronchitis in later life [6]. Our own work has identified the importance of endemic respiratory infection with nonencapsulated H. influenzae (NCHi) and S. pneumoniae amongst Aboriginal children in Northern Australia [4,7]; both species contribute to the very high rates of muco-purulent nasal discharge, otitis media, and to diseases of the lower respiratory tract in Aboriginal children and adults.
It is already understood from earlier work [2,4,7,8] that the long-term persistence of endemic carriage of S. pneumoniae and NCHi in human populations is related to the sequential acquisition and carriage of large numbers of antigenically diverse strains which queue up to infect each child; for example, with 30 different serotypes of S. pneumoniae, each with a mean carriage time of 3 months, it is possible to explain a mean carriage rate of some 75% for the first 10 years of life. Detailed models have been developed [8] to explain the rates of acquisition and loss of pneumococcal serotypes in children in the New Guinea highlands.
The purpose of this paper is to present a quantitative mathematical model to explain the acquisition, carriage and loss of multiple strains of H. influenzae in Aboriginal children in Northern Australia. A better understanding of these dynamic aspects should facilitate improved strategies for treatment and prevention of the diseases associated with H. influenzae infection.
2 Methods
2.1 Subjects
Aboriginal infants from a remote community were followed as part of a longitudinal study of bacterial colonisation and otitis media as previously described [4]. Nasopharyngeal swabs collected every 2–6 weeks for up to 2 years from 10 infants were selected for further study. The work was approved by an Institutional Ethics Committee working to NHMRC guidelines.
2.2 Identification of strains of H. influenzae
As previously described [7,9], up to four colonies of H. influenzae were picked from the culture from each swab, and serotyped: H. influenzae types a or c to f (a,c–f), b (Hib), or nonencapsulated (NCHi). DNA was extracted from each NCHi colony separately, and amplified by PCR using primers specific for the ribosomal operons. Amplification products were sized by restriction enzyme digestion and gel separation (PCR-ribotyping) [10]. Earlier work demonstrated an almost perfect correspondence between strains identified by PCR-ribotyping and those identified by partial sequencing of the P2 (antigenic porin) gene [9]. Among the NCHi isolated from the 10 infants, 43 distinct PCR-ribotypes were identified. Thus, the 43 NCHi strains, Hib and a, c–f strains represented 45 distinct types for analysis.
2.3 Data for analysis
Observations were available on 170 nasopharyngeal swabs from 10 infants followed for up to 2 years. The data set comprised the code identifier for each child, the child's age in days at each examination, the presence or absence of each of 45 distinct strains in each of the 130 nasopharyngeal swabs that were positive for NCHi, 14 swabs positive for Hib, and 29 swabs positive for H. influenzae types a, c–f (concurrent carriage of encapsulated and nonencapsulated strains of H. influenzae was a common occurrence), and the age at those examinations which proved to be culture negative for H. influenzae.
2.4 Biological assumptions for modelling
Unless specified elsewhere, the assumptions made were:
- 1.
Infants were free of H. influenzae colonisation at birth [4] although protected from infection during the first few days of life following birth in hospital.
- 2.
Each strain is antigenically distinct, and can be potentially acquired by each child and carried until eliminated by a (strain-specific) mucosal immune response in the host.
- 3.
More than one strain can be carried at any one time, as shown in previous work [7]; as a consequence, some carried strains can be ‘hidden’ by other strains, present in larger numbers, during their period of carriage.
- 4.
The force of infection (j) determines the rate of acquisition of strain j, j=1, n, by susceptible children.
- 5.
The clearance rate from carriers is (vj) for each strain j, j=1, n.
2.5 Model specification
Models are most clearly conceptualised using compartmental diagrams, where each compartment corresponds to a state that can be reached by each individual. For example, Fig. 1 specifies that each child at birth is free of H. influenzae[4], and during a latent period, in that cleaner environment, the infant is protected from cross-infection. This latent period passes as a rate λ and the infant is then exposed, in the home community, to a force of infection with strain j at a rate θj, and so on. The probability of a child reaching any particular state at a particular age is a function of the parameters of the model, and the data. The biological problem is to specify a diagram (model) that is plausible, and the statistical problem is to estimate the parameters that maximise the probability (likelihood) of the observed data.

A model of multiple strain carriage. Each compartment of the model corresponds to a state that can be reached by each individual. Each infant is free of H. influenzae at birth and whilst in a cleaner environment (N0). The infant then passes to state N1 at a rate λ, with exposure to H. influenzae in the home community. Exposure to strain j is with a force of infection θj, and may be detected (state Cj) or may be hidden by other strains (state O2). Strain j may be acquired first, at a rate of θj 1, or acquired after carriage of another strain, at a rate of θj 2. Following identified carriage (state Cj), strain j may be cleared to state N2 at a rate vj 1, or it may become hidden (state O2) at a rate Ø2, then cleared at a rate vj 2, and so on. The false negative states are not shown in the diagram but the EPIMOD package allows for an error structure to be specified. N1, individuals not carrying any strain before carrying strain j; Cj, individuals detected as carrying strain j; N2, individuals not carrying any strain after carrying strain j; O1, individuals carrying any other strain before carrying strain j; O2, individuals carrying strain j when hidden by other strains; O3, individuals carrying any other strain after strain j has been cleared; λ, rate constant for process of becoming exposed after birth; θ, rate constant for force of infection over all strains except strain j; θj 1, rate constant for force of infection with strain j when no others are in place; θj 2, rate constant for force of infection with strain j as a second or later strain; va, rate constant for clearance of last strain, currently carried; vj 1, rate constant for clearance of strain j when it is identified; Øj 2, rate constant for clearance of strain j when it is hidden; Ø1, rate constant for strain j coming out of hiding behind other strains; Ø2, rate constant for strain j becoming hidden behind other strains; α rate of false negative swab for H. influenzae.
2.6 Model-fitting algorithm
We used the software package EPIMOD [11], running on a Unix platform, to estimate model parameters by maximum likelihood after solving the differential equations relevant to the model. This package has been used in other applications [4,12,13] and a more detailed description of applications will be available (Mathews, J.D., in preparation).
2.7 Measurement errors in the data
The phenomenon of ‘false negative’ swabs, not explicitly included in Fig. 1, also needs to be considered. Such ‘false negative’ results can arise if a swab is improperly taken. The EPIMOD package allows the error structure of models such as those of Fig. 1 to be specified, and for the overall proportion of ‘false negative’ cultures to be estimated. It is also possible to specify a separate rate of ‘false negatives’ for each of the positive culture states in the model.
2.8 A more theoretical modelling framework
It is evident that the model summarised in Fig. 1 has some eight parameters which are free to vary. This presents two important problems: firstly, it is difficult to obtain reliable estimates of parameters with a complex covariance structure, and secondly, it may be difficult to interpret the results in biological terms, even if it is possible to obtain robust parameter estimates. Accordingly, we examined biologically plausible models for the acquisition and loss of multiple strains, which incorporated fewer free parameters and which could be translated into the model represented in Fig. 1. In effect, we derived each of the parameters of Fig. 1 as a (different) function of the (fewer) parameters of a more theoretically based model such as in Fig. 2.
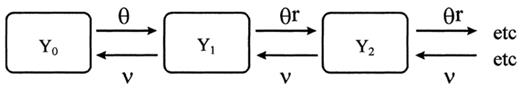
A model of simultaneous multiple strain carriage.
In this model, Y0, Y1, Y2. are the proportions of children carrying 0, 1, 2. strains at the same time. It allows estimates to be made of the force of infection for a child that is not yet carrying a bacterial strain (θ), the (reduced) force of infection after a child has been colonised (rθ), and the average clearance rate (v). The additional assumptions implicit in this model are that there was a slower rate of acquisition of strains once one strain was in place, and that strain clearance was serial.
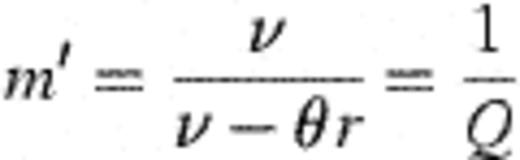
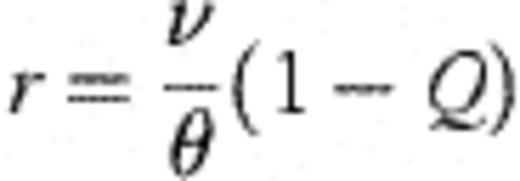
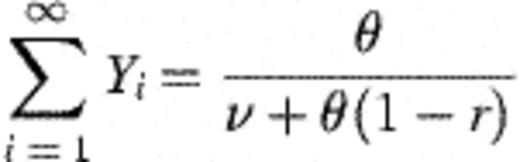
With plausible ancillary assumptions (for example, that θ is reasonably constant over time and age in the children studied) it is possible to derive the following equilibrium statistics for the system described by Fig. 2. (A necessary condition for equilibrium is that rθ<v.)
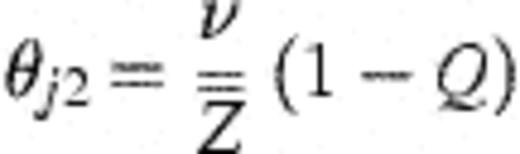
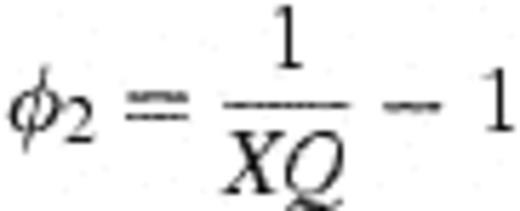
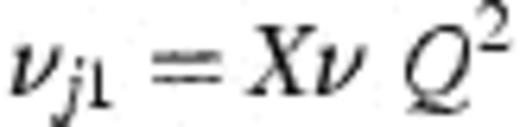
With these derivations, it is then possible to connect the modelling frameworks of Figs. 1 and 2 through the following transformations. Let  =number of strains observed in the study (45 — assumed fixed); X=mean number of different strains detected amongst four colonies of H. influenzae typed (assumed fixed at 1.50); θ0=rate of becoming exposed to infection; θ=aggregate force of infection over all strains; Ø1=1.
Then,θj 2=average force of infection for a single strain=θ/


This allows the model of Fig. 1 (nine free parameters including α) to be fitted with only four free parameters (v, θ, θ0, and Q), and an additional parameter (a) which estimates the rate of false negative cultures.
3 Results
The descriptive summary of the data (illustrated for infant 938 in Fig. 3) showed that some NCHi strains were detected only once in a single carrier (for example, type 48), while others were detected on multiple occasions in the same carrier over periods of many weeks (for example, type 25). Other types were detected intermittently; for example, type 3 was detected in infant 938 on dates up to 15 months apart, with different strains detected on intervening dates. 3 Temporal distribution of H. influenzae serotypes and NCHi PCR-ribotypes in one infant. a, H. influenzae type b; b, H. influenzae types a or c to f; c, no H. influenzae; d, number of clones of each type detected in the swab.
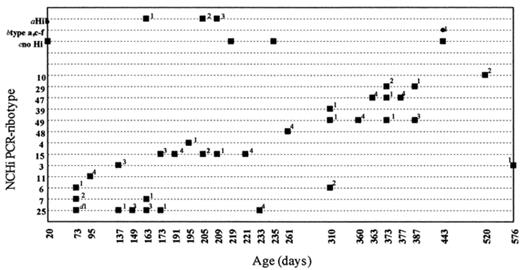
Temporal distribution of H. influenzae serotypes and NCHi PCR-ribotypes in one infant. a, H. influenzae type b; b, H. influenzae types a or c to f; c, no H. influenzae; d, number of clones of each type detected in the swab.
Such descriptive data cannot provide a quantitative analysis of the dynamics of acquisition and the duration of carriage because no allowance is made for the frequency of observation, nor for the phenomenon of ‘hidden carriage’, where a strain can be carried and not detected amongst the four colonies selected for typing from each swab. The generic model shown in Fig. 1 was developed in accordance with the assumption that there was a period of continuous carriage for each strain, albeit interrupted by periods when the carriage of that strain was obscured by the concurrent carriage of other strains, or by ‘false negative’ cultures. Additional assumptions, implicit in Fig. 2, were firstly that there was a slower rate of acquisition of strains once one strain was in place, and secondly that strain clearance was serial — with only one strain being cleared at a time.
3.1 Dynamic behaviour averaged over all strains
The model based on Figs. 1 and 2 was fitted to the aggregated data for all strains by replicating the entire data set once for each strain as the strain of interest (j). Thus, with 45 strains, and 170 observation times, the replicated data set comprised 7650 observations.
Table 1 shows the results of fitting the model of Fig. 1, incorporating the additional theoretical assumptions of Fig. 2. The estimated proportion of false negative cultures was 7.9% (that is, α=0.07899±0.0056, Table 1), which implies that when a child was actually a carrier of H. influenzae, the culture would be negative on 7.9% of swabbing occasions. Thus the true prevalence of H. influenzae would be approx. 82% rather than the apparent prevalence of 76%.
Estimates of model parameters
| Parameter | Value (day−1) | Standard error (day−1) |
| λ | 0.0862 | 0.0089 |
| θ | 0.1416 | 0.0124 |
| θr | 0.0222 | |
| ν | 0.0296 | 0.0046 |
| Q | 0.2471 | 0.0217 |
| α | 0.07899 | 0.0056 |
| Parameter | Value (day−1) | Standard error (day−1) |
| λ | 0.0862 | 0.0089 |
| θ | 0.1416 | 0.0124 |
| θr | 0.0222 | |
| ν | 0.0296 | 0.0046 |
| Q | 0.2471 | 0.0217 |
| α | 0.07899 | 0.0056 |
λ, rate at which infants become exposed to force of infection θ after birth; θ, force of infection (aggregated over all strains) once fully exposed but not yet a carrier; θr, the constrained force of infection=v(1−Q)=0.0222; v, rate of strain clearance — assuming that when multiple strains are carried, they are cleared serially rather than in parallel; Q, mean number of strains per carrier=1/Q=4.05 (95% confidence interval=3.44–4.91 strains per carrier); α, the proportion of swabs negative for H. influenzae that are interpreted as false negatives by the model.
Notes: (1)  =45 strains (assumed constant). (2) X=1.50 is the mean number of observed strains per carrier when typing only four colonies (assumed constant). (3) The constrained force of infection (rθ in Fig. 2) is obtained as rθ=v(1−Q)=0.0222, whence r~0.1568.
Estimates of model parameters
| Parameter | Value (day−1) | Standard error (day−1) |
| λ | 0.0862 | 0.0089 |
| θ | 0.1416 | 0.0124 |
| θr | 0.0222 | |
| ν | 0.0296 | 0.0046 |
| Q | 0.2471 | 0.0217 |
| α | 0.07899 | 0.0056 |
| Parameter | Value (day−1) | Standard error (day−1) |
| λ | 0.0862 | 0.0089 |
| θ | 0.1416 | 0.0124 |
| θr | 0.0222 | |
| ν | 0.0296 | 0.0046 |
| Q | 0.2471 | 0.0217 |
| α | 0.07899 | 0.0056 |
λ, rate at which infants become exposed to force of infection θ after birth; θ, force of infection (aggregated over all strains) once fully exposed but not yet a carrier; θr, the constrained force of infection=v(1−Q)=0.0222; v, rate of strain clearance — assuming that when multiple strains are carried, they are cleared serially rather than in parallel; Q, mean number of strains per carrier=1/Q=4.05 (95% confidence interval=3.44–4.91 strains per carrier); α, the proportion of swabs negative for H. influenzae that are interpreted as false negatives by the model.
Notes: (1) =45 strains (assumed constant). (2) X=1.50 is the mean number of observed strains per carrier when typing only four colonies (assumed constant). (3) The constrained force of infection (rθ in Fig. 2) is obtained as rθ=v(1−Q)=0.0222, whence r~0.1568.
3.2 Strain acquisition (λ, θ)
An important feature of the model was the protection from H. influenzae acquisition seen immediately after birth, presumably because Aboriginal infants were born in the Royal Darwin Hospital with fewer opportunities for cross-infection. This post-natal protection appeared to wane at a rate of 8.62% per day (λ=0.0862±0.0089, Table 1), corresponding to a mean latent period of 11.6 days. Subsequently, the model suggested that uninfected infants acquired a H. influenzae strain at a rate of 14.16% per day (θ=0.1416±0.0124 day−1), corresponding to a mean waiting time of 7.06 days. However, infants already carrying one or more strains were estimated to acquire additional strains at a mean rate of 2.22% per day (rθ=0.0222 day−1), corresponding to a longer mean waiting time of 45 days, presumably because of the competitive effects of the strains already in situ.
3.3 Number of strains carried (Q, X, Ø)
From those swabs that were positive for H. influenzae, the routine practice of typing four different colonies identified an average of 1.50 different strains amongst the four colonies typed. Inspection of the data showed that individual strains tended to appear, disappear and reappear in consecutive swabs, probably because they were temporarily ‘hidden’ behind other (temporarily more frequent) strains. This feature, represented in Fig. 1 through the parameters Ø1 and Ø2, was incorporated in the model, and the results suggest that the mean number of H. influenzae strains per carrier was actually 4.05 (with an approx. 95% confidence interval of 3.44–4.91) compared with the observed number of 1.50 strains. This indicates that a strain was detected on average on 37% (1.50/4.05) of occasions on which it was actually present.
3.4 Strain clearance (v)
The average clearance rate for individual strains was also potentially ambiguous because of the phenomena of multiple concurrent carriage and ‘hidden strains’. We resolved this ambiguity by assuming (Fig. 2) that only one strain was being cleared at a time (that is, serial clearance) at an average rate v. This assumption yielded plausible results (v=0.0296±0.0046 day−1) corresponding to the clearance of one strain every 33.8 days on average. However, because on average there were 4.05 strains carried per infant at any one time, the best estimate is that each strain was carried for a total of 4.05×33.8=136.9 days altogether.
4 Discussion
The model results presented (Table 1), are those which are statistically most consistent with the data and with the assumptions implicit in Figs. 1 and 2. The log likelihood corresponding to Table 1 with five parameters was virtually identical to the log likelihood for the model with nine free parameters based on Fig. 1 alone. This suggests that the additional assumptions implicit in Fig. 2 provide a plausible interpretation of the average behaviour of individual strains of H. influenzae in infants subject to concurrent colonisation with multiple strains. Although other models might explain the data equally well, we believe that the model presented is biologically plausible, parsimonious and easily interpretable, and can be used as a basis for future research. For example, our future work quantifying H. influenzae and other respiratory bacteria in nasopharyngeal swabs will add a further dimension to our models and will provide a greater understanding of the carrier state.
4.1 Continuous carriage of strains
An important assumption in the model was that each strain experiences a period of continuous carriage, interrupted only by false negative cultures and when obscured by co-colonising strains. Indeed, the ‘dominance seesaw’ evident in Fig. 3 for type 49 (360 days of age, four of four colonies type 49; 363 days, none of four colonies; 373 days, one of four colonies; 377 days, none of four colonies; 387 days, three of four colonies) is most likely due to competition or immunity-driven dynamics rather than clearance of the strain followed by re-colonisation. On the other hand, it could be argued that the 36 month gap between episodes of type 3 carriage (Fig. 3) which we assumed to be continuous but hidden carriage, is more likely due to clearance and re-colonisation. Allowance for such re-colonisation would impact upon our parameter estimates relating to the mean number of strains per carrier. Thus we are currently planning to use PCR-based methods to test the prediction that the mean number of strains is four per carrier per occasion. By using the model to generate such predictions which can be experimentally tested, we can refute or improve the model and its underlying assumptions.
4.2 Implications of multiple concurrent carriage
A distinctive feature of H. influenzae carriage in this population is the multiplicity of strains carried concurrently. The infants are heavily colonised and it appears that multiple H. influenzae strains are almost always present, most likely as a result of serial acquisition of strains. However, a mixed population could also theoretically occur as a result of transmission of more than one strain to a susceptible host, and also as a result of a parent strain and its mutant surviving concomitantly. (The latter is unlikely to be detected by PCR-ribotyping.)
The model of endemic carriage proposed here describes the phenomenon of ‘hidden carriage’ and estimates the mean number of strains carried as 4.05, compared to the average 1.5 detected by routine typing of four H. influenzae colonies. Colonisation with multiple strains ensures that as one strain is cleared, other colonising strains remain. Furthermore, there may be a clinical effect of a multiple antigenic load. Indeed, data from the same study suggested a relationship between disease incidence, severity, and chronicity, and multiplicity of species concurrently carried [14].
Several strains were detected intermittently in the study infants, at intervals of up to 15 months. The sporadic detection of these strains may be a result of re-colonisation by the same strain due to immune tolerance resulting from a high pathogen load, or sequestration of the strain from the immune system. Indeed, others have speculated that NCHi accomplish long-term, nonsuppurative infections by intracellular sequestration in lymphoid tissue and, thus, avoidance of host immune mechanisms and antimicrobial agents [15]. It can also be speculated that certain strains may accomplish long-term colonisation by acting as hitchhikers. Such strains may achieve immune anonymity by maintaining low numbers while more numerous strains are being presented to the immune system. Furthermore, hitchhiking strains may co-exist with limited competition by specialisation of resource requirements and optimal conditions favoured [16]. Specialisation of resource requirements by NCHi is potentially by virtue of P2 porin sequence diversity, as porin changes may theoretically influence the ability to uptake nutrients and perhaps certain antibiotics. PCR-ribotyping of further isolates will allow us to determine whether there is a significant association, in terms of co-colonisation, between particular strains.
4.3 Further implications
The estimate that one strain is cleared every 34 days, on average, is an important bench mark. For example, for the 45 strains considered, this would correspond to an average 80% carriage rate for a period of 34×45/0.8=1912 days=5.24 years. We already know, from parallel studies in the same population, that there are high rates of nasopharyngeal carriage of NCHi through to adolescence, and there are clearly many more NCHi strains, other than those we identified in this study, that will contribute to continuing endemicity of NCHi in this and other populations.
Another important assumption of this model is that a strain-specific (mucosal) immune response is assumed to finally terminate carriage of each strain: there is nothing in the data to suggest that there is significant cross-protection between strains. If significant cross-protection does occur, it would have to be accompanied by short-term immunological memory and re-infection to explain what we have observed in the population under study.
We believe that this model, and its successors, will be important for several reasons. Firstly, they will provide a framework to help evaluate the effects of antibiotic treatment on NCHi infection with multiple strains in children with otitis media. Secondly, they will stimulate further research to test assumptions relating to multiple carriage and the strain-specific immune response. Thirdly, they will support a theoretical framework for the development and testing of vaccines against NCHi.
Acknowledgements
We are grateful to the volunteer families participating in this study, to Dr Amanda Leach, Dr Peter Morris and other members of the Ear Health and Education Unit of the Menzies School of Health Research for access to samples, and helpful discussion.
References
