


ABSTRACT
It is of great interest to elucidate the biogeographic patterns of soil microorganisms and their driving forces, which is fundamental to predicting alterations in microbial-mediated functions arising from environment changes. Although dissolved organic matter (DOM) represents an important resource for soil microorganisms, knowledge of how its quality affects microbial biogeography is limited. Here, we characterized soil bacterial communities and DOM quality in 45 soil samples collected from a 1500-km sampling transect through semi-arid regions in northern China which are currently suffering great pressure from climate change, using Illumina Miseq sequencing and fluorescence spectroscopy, respectively. We found that DOM quality (i.e. the source of DOM and the humification degree of DOM) had profound shaping influence on the biogeographic patterns exhibited by bacterial diversity, community composition and association networks. Specifically, the composition of bacteria community closely associated with DOM quality. Plant-derived DOM sustained higher bacterial diversity relative to microbial-derived DOM. Meanwhile, bacterial diversity linearly increased with increasing humification degree of DOM. Additionally, plant-derived DOM was observed to foster more complex bacterial association networks with less competition. Together, our work contributes to the factors underlying biogeographic patterns not only of bacterial diversity, community composition but also of their association networks and reports previously undocumented important role of DOM quality in shaping these patterns.
INTRODUCTION
Microbial biogeography, the study of distribution patterns of microbial communities over space and time, is a key topic in microbial ecology (Martiny et al. 2006). One of the primary interests in continuously studying microbial biogeography is to get insights into the mechanisms generating and maintaining diversity (Chu et al. 2020), which are critical for predicting how ecosystem will respond to current and future environmental changes and forms a foundation for conservation and environmental management (Wang et al. 2017; Meyer et al. 2018). Given that the climate change will continue and the weather patterns will be more erratic and extreme in the future (Jansson and Hofmockel 2020), such information is of particular importance for climate-sensitive soil ecosystems like semi-arid regions. Semi-arid regions refer to areas with an aridity index ranging 0.2–0.5 (Pointing and Belnap 2012). The unique climate features as well as low levels of water and nutrients make the semi-arid regions prone to desertification (Hu et al. 2017), which can be exacerbated by climate change and thus lead to the expansion of desert and desert steppe (Veron and Paruelo 2010; Delgado-Baquerizo et al. 2013). Therefore, a thorough study of microbial biogeographical patterns and their drivers in these desertified areas fills a crucial need for a predictive understanding of microbially driven ecosystems processes under future climate scenarios and for designing effective management strategies.
Over the past few decades, studies in microbial biogeography have substantially benefited from advances in high-throughput sequencing technology, which allows descriptions of entire microbial communities with unprecedented capacity and resolution (Balint et al. 2016; Peay, Kennedy and Talbot 2016). The biogeographic patterns exhibited by soil microorganisms have been extensively investigated in a wide range of terrestrial ecosystems (Yang et al. 2014; Shi et al. 2015; Deng et al. 2016; Wilhelm et al. 2017; Huang et al. 2019), at local (Bahram, Peay and Tedersoo 2015; Bahram et al. 2016), regional (Kivlin et al. 2014), continental (Griffiths et al. 2011; Ma et al. 2017) and global scales (Bahram et al. 2018; Delgado-Baquerizo et al. 2018). These previous studies have primarily focused on the patterns of microbial community diversity and composition. In contrast, far less attention has been given to the biogeographic variation in interactions between microbial community members. Instead of existing alone as individual populations, microorganisms coexist in complex arrays in which they interact with each other (Faust and Raes 2012). Such inter-taxa associations, which could be either positive (e.g. cooperation) or negative (e.g. competition), contribute more to system functions than individual populations (Ma et al. 2016; Wu et al. 2020) and represent a crucial dimension of microbial community not captured by simple diversity and composition (Rottjers and Faust 2018). Association network analysis is an effective method for inferring and visualizing potential interactions among community members and has been widely used (Barberan et al. 2012). To date, integrating network theory to biogeography has been well addressed in macro-ecology (Cumming et al. 2010; Poisot et al. 2012). However, biogeographic patterns of microbial association networks have been seldom explored (Ma et al. 2016), as a result, how topology of microbial association networks changes over space remains largely unknown.
Regarding factors shaping microbial biogeographic patterns, the existing studies yet have shown mixed results. For example, depending on the spatial scale and ecosystem under investigation, the distribution of bacterial diversity and community composition could be driven by a range of different factors such as soil pH (Fierer and Jackson 2006; Shi et al. 2018), salinity (Lozupone and Knight 2007), plant species richness (Wang et al. 2017) and temperature (Zhou et al. 2016). Surprisingly, among these various driving factors, whether and how resource quality affects spatial patterns of soil microbial communities has not been properly appreciated, even though resources always exist as mixtures of multiple forms (Muscarella et al. 2019). Besides, it's well known that climate change has significant impact on organic matter (OM) in soil (Luo et al. 2016) and thus it is critical to understand the role of OM in shaping microbial biogeography in semi-arid regions where the supply of OM is limited. Dissolved organic matter (DOM), known as the most mobile fraction of OM (Jansen, Kalbitz and McDowell 2014), plays key role in supplying carbon (C), nitrogen (N) and energy source for soil microorganisms (Benner 2011; Gmach et al. 2020). This fact makes DOM the locus of intense microbial activities and leads it to be regarded as a major hotspot for biogeochemical processes (Li et al. 2018). It is of great importance to uncover the role of DOM quality in shaping soil microbial biogeographic patterns, because although soil microorganisms have great dependence on DOM, they are unable to utilize all of the available organic matter due to substrate preference (Glassman et al. 2018; Li et al. 2019). Meanwhile, DOM, an extremely complicated mixture (Cory and McKnight 2005), comprises thousands of organic compounds that varied in bioavailability and degradability (Marschner and Kalbitz 2003; Zhou et al. 2019b), with its quality being highly dynamic and sensitive to environmental changes (Li et al. 2018; Chai et al. 2019). It was shown that the quantity of DOM had significant impacts on the bacterial communities in semi-arid soils (Bastida et al. 2016), but how variations in DOM quality relate to soil bacterial diversity patterns in semi-arid regions still remains unknown. In addition, microbial mineralization of DOM contributing to the CO2 production (Drake et al. 2015) further necessitates a comprehensive investigation linking DOM quality to soil microbial biogeography in semi-arid regions.
In the present study, we carried out a 1500-km transect survey in semi-arid regions in Inner Mongolia, China. The study area encompasses considerable environmental variations and is extremely susceptible to climate change (Bai et al. 2008). Given that the availability of organic C is a main limiting factor for microbial communities in semi-arid regions (Maestre et al. 2015; Bastida et al. 2016), we hypothesized that the spatial variations in bacterial in soil bacterial diversity, community composition and association networks could be primarily driven by DOM quality. To test this hypothesis, we characterized soil bacterial communities using Illumina sequencing of 16S rRNA gene and DOM quality using fluorescence spectroscopy. Two commonly used spectrofluorometric indices were calculated to quantify DOM quality. Fluorescence index (FI) is used to differentiate the source of DOM, with lower values (values of 1.2–1.5) indicating plant-derived DOM and higher values (values > 1.7) indicating microbial-derived DOM (Gabor et al. 2015; Agethen and Knorr 2018). Humification index (HIX) is used to monitor the degree of humification, with higher values corresponding to increasing degree of humification (Ohno 2002; Gabor et al. 2015). The primary goals of this study were (1) to explore the biogeographic patterns exhibit by soil bacterial diversity, community composition and association networks, and (2) to uncover the role of DOM quality in shaping these patterns.
MATERIALS AND METHODS
Study sites and field sampling
This research was carried out along a 1500-km transect across the Inner Mongolia in northern China, which presents a natural precipitation gradient from the east to the west (Wang et al. 2014) and is characterized by high vulnerability to climate change as well as desertification processes (Bai et al. 2008). The transect spanned 37.69°N–49.25°N and 107.23°E–122.41°E, covering approximately 12° latitude and 15° longitude, respectively (Figure S1, Supporting Information). A total of 45 sites were established through the entire transect during September to early October in 2016. There was no rain during the sample collection and the altitude of the sampling sites ranged from 172 to 1450 m. A portable GPS device was used to record the coordinate of each site during the field work. Vegetation types of the selected sampling sites were mainly desert and desert steppe, which were species-poor and characterized by bare soils (low plant cover and no biocrusts) and sparse shrubs (Caragana microphylla Lam., Artemisia ordosica) or grasses (Leymus chinensis). Soil types were predominantly sandy soil which was dominated by sand (Table S1, Supporting Information). At each site, a 8 m × 8 m plot was established and five 0.5 m × 0.5 m quadrats were randomly placed in bare ground areas within the plot. Surface soil (0–10 cm) samples were collected at each quadrat and were homogenized completely as one composite sample per plot. In total, 45 soil samples were collected. These soil samples were passed through a 2 mm sieve to remove roots and rocks and were then separated into two parts, sealed in sterilized sampling bags. Soil samples were returned to laboratory as soon as possible. One part was placed on ice and stored at −80°C for later DNA extraction upon arrival. The other part was transported at ambient temperature and was analyzed immediately for edaphic properties and DOM quality upon arrival.
Illumina sequencing of 16S rRNA gene and data processing
Soil microbial DNA was extracted from 0.25 g soil per sample using The Power soil DNA Kit (MO BIO, Carlsbad, CA) according to the manufacturer's instructions. Nano Drop 2000 UV–vis spectrophotometer (Thermo Scientific, Wilmington, DE) was used to evaluate the purity and concentration of the extracted DNA. High-quality DNA samples were used for polymerase chain reaction (PCR) with the bacterial primer pair 515F (5'-GTGCCAGCMGCCGCGGTAA-3') and 907R (5'-CCGTCAATTCCTTTGAGTTT -3'; Biddle et al. 2008). Each DNA sample was amplified in a 20 µL volumes containing 4 µL of 5 × FastPfu Buffer, 2 µL of 2.5 mM dNTP mix, 0.8 µL of each primer (5 µM), 0.4 µL of FastPfu Polymerase (TransGen, Beijing, China), 0.2 µL of BSA, 10 ng of template DNA and double-distilled H2O. The amplification was conducted under the following condition: 95°C for 3 min, followed by 35 cycles at 95°C for 30 s, 55°C for 30 s, 72°C for 45 s and a final elongation step at 72°C for 10 min. PCR was performed for each soil DNA samples in triplicate and combined into a composite sample. After purifying and quantifying using AxyPrep DNA Gel Extraction Kit (Axygen Biosciences, Union City, CA) and QuantiFluor -ST (Promega, Madison, WI), respectively, the PCR products were used to construct DNA library and paired-end sequencing (2 × 250 bp) was then performed on the Illumina Miseq sequencing platform (Illumina, San Diego, CA, USA). All of the bacterial sequence data in this present study have been deposited in Sequence Read Archive (SRA) of NCBI database under the accession number SRP149055.
The quality of raw sequences was checked by using Trimmomatic with a 50 bp sliding window, a minimum quality score of 20 and a minimum length of 50 bp (Bolger, Lohse and Usadel 2014). After the above quality trimming, retained sequences were merged using FLASH with a minimum overlap of 10 bp and a 20% error rate (Magoč and Salzberg 2011). UCHIME algorithm in USEARCH (Edgar et al. 2011) was used for detecting and filtering chimeric sequences. Classification of operational taxonomic units (OTUs) at 97% identity level was done using the UPARSE algorithm. Taxonomic affiliations of the OTUs were assigned to bacteria by reference to SILVA release 123 using RDP classifier (Wang et al. 2007). Singletons were eliminated in the whole data set to minimize the impact of sequencing artefacts resulting in 1 446 362 sequences, ranging from 19 303 to 41 233 per sample. To minimize any bias due to differences in sequencing depth among samples, the sequence data were randomly subsampled to 19 303 sequences per sample before downstream analyses.
Climatic data collection and edaphic variables analyses
Mean annual precipitation (MAP) and mean annual temperature (MAT) for each site were obtained from China Meteorological Data Sharing Service System (https://data.cma.cn/en). Aridity index (AI) was then calculated using the obtained MAP and MAT values and aridity (1-AI) was used in this study for simplicity. Edaphic variables, including soil pH, soil texture (proportion of clay, silt, fine sand and coarse sand), soil electrical conductivity (EC), the content of total nitrogen (TN), the content of total phosphorus (TP), soil organic carbon (SOC) and soil moisture were determined in this study. Methods for measuring these edaphic properties were described in detail in our previous study (Huang et al. 2019, 2020). Briefly, soil pH was measured by a pH meter in a slurry with a 1:2.5 (w/v) ratio of soil to water. Soil texture, including proportion of clay (particle size < 0.002 mm), silt (particle size ranging from 0.002 to 0.05 mm), fine sand (particle size ranging from 0.05 to 0.25 mm) and coarse sand (particle size ranging from 0.25 to 2 mm), was determined using a Mastersizer 2000 (Malvern Instruments, Malvern, England). TN was determined using a Kjeltec 2200 Auto Distillation Unit (Foss Tecator AB, Sweden). TP was measured by molybdenum blue method using a UV–visible spectrophotometer (UV-2550, Shimadzu, Japan). SOC was quantified using potassium dichromate oxidation titration method (Bai et al. 2018). Soil moisture was determined gravimetrically at 105°C for 24 h.
DOM extraction and DOM quality characterization
DOM in soil was extracted using the water extraction method according to Gao et al. (2018) with some modifications. In brief, the collected soil samples were air-dried at room temperature and 5 g of air-dried soil were mixed with 25 mL distilled water in 50 mL centrifuge tubes. The obtained 1:5 (w/v) soil/water suspension was then placed in an end-over-end shaker in the dark and shaken for 2 h. The DOM extract was performed by centrifuging the suspension at 600 rpm for 10 min and collecting the supernatant. To avoid possible scatter of the spectral analysis induced by fine particles, the supernatant was filtered through a 0.22 μm membrane. The filtrate was transferred into brown glass sample bottles to prevent photodecomposition and stored in at 4°C in darkness. All of these DOM samples were analyzed within 24 h after extraction.
For characterization of DOM quality, fluorescence excitation emission matrix (EEM), a fast, sensitive and non-destructive spectroscopic technique (Chai et al. 2019), was used in this study. Absorbance scans and fluorescence EEM were collected simultaneously using an Aqualog Analyzer (HORIBA Scientific, Edison, NJ, USA) equipped with 10-mm quartz fluorescence cuvettes. Milli-Q water was used as the blank. Absorbance spectra were scanned in the range of 200–800 nm with a 1 nm interval. EEM data was collected for each sample at excitation wavelengths (Ex) of 200–550 nm in increments of 4 nm and at emission wavelengths (Em) of 280–550 nm in increments of 1 nm. MATLAB R2016b (The MathWorks, Natick, MA, USA) was used to facilitate EEM data manipulation and analyses. After method blank subtraction and removal of the 1st and 2nd Rayleigh and Raman peaks, EEM data was normalized to Raman Units (R.U.) following the method of Murphy et al. (2010). The absorbance data obtained above was used to correct for inner filter effects as described by Kothawala et al. (2013).
Network analysis
To explore the biogeographic patterns of bacterial association networks, an overall network was first constructed using data from all 45 sampling sites. To reduce rare OTUs and noise, OTUs with mean relative abundance less than 0.01% were removed, thus subsetting the data to 1407 OTUs. All pairwise Spearman's rank correlations (ρ) were calculated between the remaining OTUs using R package Hmisc (Harrell and Dupont 2018). Only correlations considered to be robust (ρ > 0.6 or ρ < −0.6) and statistically significant (Benjamini Hochberg adjusted P < 0.01) were used to construct the network (Ju et al. 2014). The interactive platform Gephi was then used to visualize the constructed network (Bastian, Heymann and Jacomy 2009). To test whether the constructed network differed significantly from random networks and thus is of ecological significance, Erdös–Réyni random networks, which had the same number of nodes and links as the real network, were simulated for 1000 times using R package igraph (Csárdi and Nepusz 2006). One-sample t-test was then used to test the difference between the observed network and the corresponding random networks. Subsequently, sub-networks for each soil sample were extracted from the constructed overall network by preserving OTUs presented in each sample using igraph package as described by Ma et al. (2016). For network property characterization, a set of topological metrices such as average clustering coefficient (avgCC), average path length (APL), modularity, average degree (avgK), centralization of betweenness (CB), centralization of degree (CD) was calculated using igraph package.
Statistical analysis
To determine spatial oscillation in environmental conditions, pairwise environmental similarity was regressed against geographic distance using mantel test in ecodist package with Spearman correlation and 9999 permutations (Goslee and Urban 2007). Environmental distance was calculated as Euclidean distances of all standardized environmental factors (i.e. DOM quality, edaphic and climatic factors) and environmental similarity was calculated as 1 minus environmental distance. Pairwise geographic distance was calculated using Imap package (Wallace 2012). A principal component analysis (PCA) combined with a circle of equilibrium contribution was completed in vegan package (Oksanen et al. 2007) to identify which environmental factor contributes significantly to environmental heterogeneity.
The alpha diversity of bacteria was represented by the number of observed OTUs (i.e. richness). The impact of DOM quality on soil bacterial diversity was explored by fitting linear regressions between two fluorescence indices (FI and HIX) and bacterial richness. Before regression analysis, normality tests (Shapiro–Wilk) were implemented and both FI and HIX were log-transformed to meet statistical assumptions. Stepwise multiple regression was conducted to test whether DOM quality explained bacterial diversity better than other measured environmental factors. All the variables were standardized before fitting the model. Forward and backward stepwise model selection based on Akaike information criterion (AIC) was used to determine the best model with the ‘stepAIC’ function in MASS package. To eliminate multicollinear variables, the variance inflation factor (VIF) was calculated by the car package and variables with VIF < 4 were retained in the final model. The relative importance of each predictor in the final model was quantified using the relaimpo package (Gromping 2006). To further quantify how much variability in bacterial diversity can be uniquely explained by DOM quality and compare the explanatory power of DOM quality with edaphic and climatic factors, variation partitioning analysis (VPA) was carried out as described by Delgado-Baquerizo et al. (2017).
For characterizing bacterial biogeographic patterns, distance-decay relationship was analyzed using linear regression between log-transformed community similarity and log-transformed geographic distance (Bahram et al. 2013). The community similarity was calculated as 1 minus Bray–Curtis dissimilarity. The statistical significance of distance-decay relationship was determined by matrix permutation tests with 1000 permutations, as data points within matrices were non-independent (Martiny et al. 2011). To assess the relative importance of environmental factors versus geographic factors in structuring the observed bacterial biogeographic patterns, community variations were partitioned into environmental and geographic effect using a two-way permutational multivariate analysis of variance (PERMANOVA) as described by Wu et al. (2018). Briefly, the aforementioned PCA of environmental data set and principle coordinate analysis of neighbor matrices (PCNM; Dray, Legendre and Peres-Neto 2006) were used to represent environmental effect and geographic effect respectively. According to the Kaiser–Guttman rule, the first five axes of PCA that accounted for 80.4% of the total variation in environmental factors and PCNM1-PCNM3 were selected and included in the two-way PERMANOVA. The statistical significance of the pure effects of environmental (E|G) and geographic factors (G|E) were all tested with 1000 permutations. To confirm the result of variation partitioning, Mantel and partial Mantel tests were conducted for relationships between spatial community dissimilarity and environmental/geographic factors. Further, for discerning the roles of DOM quality and other individual environmental factors in shaping communities, partial Mantel tests were applied to determine how well these factors correlated with community dissimilarity after controlling for geographic distance.
To estimate the importance of DOM quality for network topology, the relation between environmental factors and topological features was analyzed at subnetwork level. Pearson's correlations between individual network topological features and environmental factors were first calculated. Multiple regression on distance matrices (MRM) with the ecodist package was then implemented to identify the most important factor attributable to topological variations along the sampling transect. Before applying MRM, the redundancy of environmental factors was assed using the varclus procedure in the Hmisc package and variables with higher correlation (Spearman's ρ2 > 0.8) were excluded. Both network topological features and environmental factors were standardized and Euclidean distance matrices were used in the MRM model.
RESULTS
Environmental characteristics along the sampling transect
Significant variations in environmental conditions occurred along the sampling transect, as the environmental similarity markedly decreased with increasing geographic distance (P < 0.001; Figure S2a, Supporting Information). The environmental variability was then illustrated by the PCA in which the first two axes accounted for 51.9% of the variance (Figure S2b, Supporting Information). The first PCA axis had high loadings of soil pH, coarse sand, fine sand and FI, while the second PCA axis was mainly correlated with clay, silt, HIX and TP. The circle of equilibrium contribution further showed that pH, coarse sand, FI, clay, silt as well as HIX contributed more to the identified environmental variations than average (Figure S2b, Supporting Information).
Summary of bacterial dataset
A total of 868 635 effective bacterial sequences were obtained after rarefying samples to the least common number of sequences (i.e. 19 303). Sequence clustering at a 97% identity level yielded 7817 unique bacterial OTUs, with the number of OTUs for each sample ranging from 1105 to 2507. Rarefaction curves generally approached saturation (Figure S3, Supporting Information) and the Good's coverage values were above 95% in all cases, suggesting that the current sequencing effort was sufficient to reliably capture the majority of the soil bacterial communities. Overall, soils in semi-arid regions contained phylogenetically diverse communities, as taxonomic analysis identified 39 bacterial taxa at the phylum level. Proteobacteria was the most dominant phylum, accounting for 27.41% of the total effective bacterial sequences on average and ranging from 16.38 to 40.12% per sample (Figure S4, Supporting Information). The other dominant phyla were Actinobacteria (15.86–46.51%, averaging 27.01%), Acidobacteria (3.17–21.38%, averaging 13.31%), Chloroflexi (4.82–16.19%, averaging 8.67%), Planctomycetes (2.29–7.88%, averaging 5.43%) and Firmicutes (0.63–35.27%, averaging 4.56%). On average, 1.97% of bacterial sequences were unclassified at the phylum level (Figure S4, Supporting Information).
Relation of bacterial diversity and DOM quality
FI, an indicator of the source of DOM, was negatively related to bacterial diversity and explained 56.8% of variation in bacterial diversity (P < 0.001, Fig. 1A). This means that plant-derived DOM supported more diverse bacterial communities than microbial-derived DOM. By contrast, HIX, a measure of the degree of humification, was positively correlated with bacterial diversity and explained 36.4% of variation (P < 0.001, Fig. 1B), indicating that increasing humification of DOM significantly promoted bacterial diversity. Stepwise multiple regression was used to test whether DOM quality explained bacterial diversity better than other measured environmental factors. Five variables were selected in the best model and together accounted for 62.5% of the overall variability in bacterial diversity (Table S2, Supporting Information). Among them, FI and HIX were the best predictors and respectively contributed 65.47% and 18.85% of the explained variation of bacterial diversity (Fig. 2A and Table S2, Supporting Information). Variation partitioning model further verified that bacterial diversity was primarily driven by DOM quality, as DOM quality uniquely explained the largest proportion of the variance in bacterial diversity (Fig. 2B).
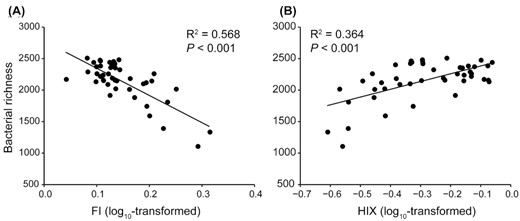
Relationships between soil bacterial diversity, as measured with bacterial richness, and both (A) FI and (B) HIX. Adjusted R2 and associated P-value in each fitted linear regression are shown on the figure.
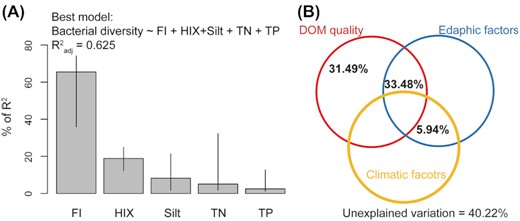
Relative contribution of DOM quality, edaphic and climatic factors as predictors of bacterial diversity. (A) Percent of R2 of regressors retained in the best multiple regression model. Metrics are normalized to sum to 100% and intervals are 95% bootstrap confidence intervals. (B) Venn diagram illustrating the independent and joint effects of DOM quality, climatic and edaphic factors on bacterial diversity. Note that the fraction of explained variation < 1% is not shown on the figure for simplicity.
Spatial variability in bacterial community composition and its relation with DOM quality
There was high spatial variability in communities of bacteria, as the bacterial community similarity decreased with increasing geographic distance, showing a significant distance-decay relationship (slope = −0.082, P < 0.001, Fig. 3A). The result of variation partitioning (two-way PERMANOVA) showed that both environmental factors and geographic factors independently explained significant amounts of variation in bacterial community composition (P = 0.001 and P = 0.009, respectively), but environmental factors had much higher explanatory power than geographic factors (14.34% vs. 4%; Fig. 3B). These results were also supported by Mantel tests and partial Mantel tests, which showed that bacterial community dissimilarity significantly associated with environmental and geographic distance (all P < 0.01), but its correlations with environmental distance (Mantel r = 0.476 and partial Mantel r = 0.389) were consistently higher than that of geographic distance (Mantel r = 0.332 and partial Mantel r = 0.154; Table 1). Further, partial Mantel tests were performed to discern the roles of individual environmental factors in structuring bacterial communities after removing the effect of geographic distance (Table 2). This showed that bacterial community dissimilarity was more strongly associated with FI than with other environmental factors, resulting in the highest partial Mantel coefficient of up to 0.513 (P < 0.001). Soil pH also had significant effect on bacterial community dissimilarity (partial Mantel r = 0.262, P < 0.001), which was comparable to the effect of HIX (partial Mantel r = 0.230, P < 0.001). TP, TN, Silt and SOC had relatively weak (partial Mantel r ranging from 0.131 to 0.182) but significant (all P < 0.05) effects. Collectively, these results indicated that spatial variability in bacterial community composition was primarily driven by environmental factors, with DOM quality acting as the determinant driver.
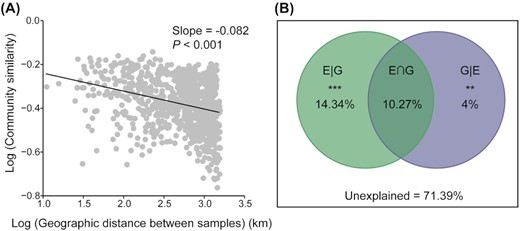
Spatial variability in bacterial community composition and the underlying controlling mechanisms. (a) Distance–decay relationship of soil bacterial communities. (b) The Venn diagram of variation partitioning illustrating the effects of environmental and geographic on community variation. E|G, the pure effects of environmental factors; G|E, the pure effects of geographic factors; E∩G, the joint effects. * P ≤ 0.05; **P ≤ 0.01 and *** P ≤ 0.001.
The correlations between soil bacterial community dissimilarity and environmental and geographic distance. The Mantel statistic r and associated P-value were determined by Mantel and partial Mantel tests based on Spearman's correlation with 9999 permutations, respectively.
| Effect of | Controlling for | Spearman's coefficient | P-value |
|---|---|---|---|
| Env | 0.476 | < 0.001*** | |
| Geo | 0.332 | < 0.001*** | |
| Env | Geo | 0.389 | < 0.001*** |
| Geo | Env | 0.154 | 0.004** |
| Effect of | Controlling for | Spearman's coefficient | P-value |
|---|---|---|---|
| Env | 0.476 | < 0.001*** | |
| Geo | 0.332 | < 0.001*** | |
| Env | Geo | 0.389 | < 0.001*** |
| Geo | Env | 0.154 | 0.004** |
Env, Environmental distance; Geo, geographic distance;
P ≤ 0.01;
P ≤ 0.001, significant P-values are in bold.
Partial Mantel tests showing the relationships between bacterial community dissimilarity and individual environmental factors after controlling the potential effect of geographic distance. Mantel statistic r and associated P-value were determined by partial Mantel tests based on Spearman's correlation with 9999 permutations.
| Spearman's coefficient | P-value | |
|---|---|---|
| DOM quality | ||
| FI | 0.513 | < 0.001*** |
| HIX Edaphic factors | 0.230 | < 0.001*** |
| Edaphic factors | ||
| Clay (%) | −0.137 | 0.944 |
| Silt (%) | 0.158 | 0.008** |
| Fine sand (%) | 0.108 | 0.061 |
| Coarse sand (%) | 0.039 | 0.244 |
| Soil moisture (%) | 0.119 | 0.073 |
| pH | 0.262 | < 0.001*** |
| TN (g/Kg) | 0.166 | 0.012* |
| EC (µS/cm) | 0.123 | 0.076 |
| SOC (g/Kg) | 0.131 | 0.034* |
| TP (g/Kg) | 0.182 | 0.014* |
| C/N ratio | 0.052 | 0.248 |
| Climatic factors | ||
| Aridity | 0.025 | 0.349 |
| MAP (mm) | −0.182 | 0.995 |
| MAT (°C) | 0.072 | 0.141 |
P ≤ 0.05;
P ≤ 0.01;
P ≤ 0.001, significant P-values are in bold.
Overall topological properties of the constructed network
To infer bacterial associations across a large spatial scale in semi-arid regions, an overall network was first constructed using data from all 45 sampling sites. This constructed network contained 22 696 links among 1201 nodes (Fig. 4A) and harbored much more positive links (68.98%) than negative ones (31.02%). The node degree distribution of this network fitted the power law distribution very well (R2 = 0.923), which is quite different from the corresponding random networks (Gaussian distribution: R2 = 0.977; Figure S5, Supporting Information). Besides, the constructed network exhibited values of average path length (APL), average clustering coefficient (avgCC) and modularity that were significantly higher than those in random networks (all P < 0.001; Table S3, Supporting Information). Such results indicated that the observed network was a nonrandom biologically meaningful network and exhibited general topological features such as scale-free, small-world and modular.
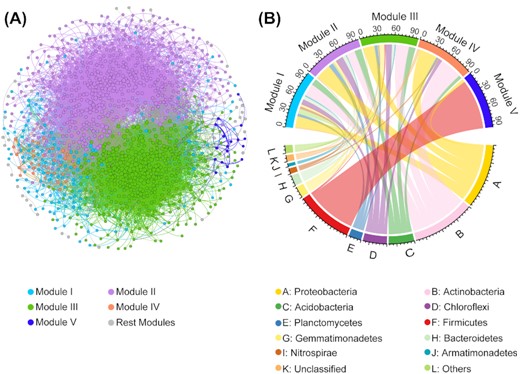
An overview of the overall bacterial association network. (A) Nodes contained in the network are colored by modules. A connection indicates a strong (ρ > 0.6 or ρ < −0.6) and significant correlation (Benjamini–Hochberg adjusted P < 0.01). The size of each node is proportional to the degree. Modules with nodes less than 15 were grouped into ‘Rest modules’. (B) The phyla distribution of nodes from different major modules.
The nodes in the network distributed into 10 major bacteria phyla, with Proteobacteria (24.56%), Actinobacteria (21.40%), Acidobacteria (12.32%), Chloroflexi (12.16%) and Plantomycetes (6.83%) being the top five abundant nodes, accounting for 77.27% of all nodes (Figure S6, Supporting Information). The network was then modularized and resulted in 22 modules, but 96.5% of all nodes were accounted for by only five of the 22 modules (Figure S7, Supporting Information). These five major modules were comprised of different taxonomic profiles, as nodes from modules I, II and III mostly belonged to Proteobacteria, Actinobacteria and Acidobacteria; nodes from module IV were mostly Proteobacteria and Actinobacteria; nodes for module V mostly belonged to Firmicutes (Fig. 4B).
Relation of network topology and DOM quality
The Pearson's correlation analysis showed that all network topological features analyzed in this study significantly correlated with several environmental factors (Fig. 5A), suggesting that bacterial association network varied with environmental conditions. MRM analysis also confirmed this result, as environmental factors significantly explained substantial variations in network topological features (40.9%, P < 0.001) after removing the highly correlated environmental factors from the MRM model (Fig. 5B and Figure S8, Supporting Information). Further investigation showed that the top three important factors responsible for the network's topology variations were FI, HIX and clay content (Fig. 5B and Table S4, Supporting Information), with the explanatory power of FI (31.4%, P < 0.001) being far higher than HIX (4.9%, P < 0.001) and clay content (4.4%, P < 0.5). Specifically, FI significantly (P < 0.05) and negatively correlated with the number of links (r = −0.728) and nodes (r = −0.717), average degree (r = −0.74) and modularity (r = −0.382), but positively correlated with centralization of betweenness (r = 0.599), average path length (r = 0.337) and the proportion of negative links (r = 0.448), as revealed by Pearson's correlation analysis (Fig. 5A). Collectively, these results suggested that topological features of bacterial association networks were tightly related to DOM quality, among which FI was the strongest one in explaining topological variations.
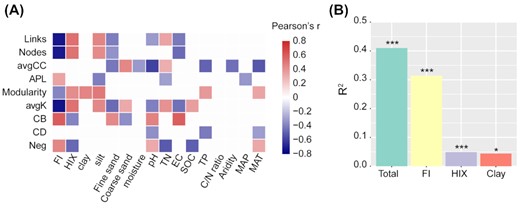
Linkages between environmental factors and network topological features. (A) Pearson's correlation between individual environmental factors and network topological features. The correlation matrix only keeps correlations with P < 0.05. avgCC stands for average clustering coefficient; APL stands for average path length; avgK stands for average degree; CB stands for centralization of betweenness; CD stands for centralization of degree; Neg stands for the proportion of negative links. (B) The contributions (R2 values) of both the total and the top three important environmental factors to topological variations. R2 values and associated P-values were estimated with MRM models. * P ≤ 0.05; ** P ≤ 0.01 and *** P ≤ 0.001.
DISCUSSION
While previous studies have highlighted the importance of factors such as aridity (Wang et al. 2015), soil total C (Maestre et al. 2015) as drivers of soil bacterial diversity in drylands. Here, we demonstrated that DOM quality explained bacterial diversity better than any other edaphic and climatic factors investigated, which was supported by both stepwise multiple regression (Fig. 2A and Table S2, Supporting Information) and variation partitioning (Fig. 2B). Specifically, we found that plant-derived DOM supported higher diversity of soil bacteria relative to DOM coming from microbial source, as indicated by the significant negative correlation discovered between FI and bacterial diversity (Fig. 1A). This is largely because that plants represent major resource inputs to soil (Gmach et al. 2020), and can substantially diversify the pool of resources and offer more ecological niches to partition by generating plant residues and root exudates (Prober et al. 2015; Zhang et al. 2017). In addition, we noted a significant positive relationship between bacterial diversity and HIX, suggesting a higher DOM humification degree with increment in bacterial diversity (Fig. 1B), which was consistent with previous studies in glacial ecosystems on the Tibetan Plateau (Zhou et al. 2019a). As humification processes result in lower H/C ratios (Gabor et al. 2014) and more complex and disordered structure of DOM (Bernard et al. 2012), the results observed may reflect that more diverse bacterial communities are required to breakdown the DOM with increasing degree of humification. These results for bacteria were similar to our observations of soil fungal diversity (Huang et al. 2020), which collectively emphasized that DOM quality is of key importance in affecting soil microbial diversity in semi-arid regions.
As for the bacterial community composition, significant spatial differences were reflected by the distance–decay relationship (Fig. 3A), which has been widely reported in soil bacterial communities (Ma et al. 2017; Meyer et al. 2018). Both environmental factors and geographic distance can contribute to the distance-decay relationship (Bahram et al. 2016), but their relative importance for soil bacterial communities varies across study systems (Wang et al. 2017), spatial scales (Martiny et al. 2011) and life history of the bacteria (Bissett et al. 2010). Our results showed that environmental factors were more important than geographic distance in shaping bacterial community composition (Fig. 3B and Table 1). One possible reason is that microorganisms have high rate of dispersal due to their small size, which lessens the importance of geographic distance (Finlay 2002). Alternatively, semi-arid regions are characterized by low nutrition content and low water availability (Delgado-Baquerizo et al. 2013; Nielsen and Ball 2015); these harsh environmental filters may impose strong environmental selection to select species that can endure such stressful conditions, as previously reported (Chase 2007; Tripathi et al. 2018). This interpretation was further supported by the prevalence of stress-tolerant taxa such as Acidobacteria, Chloroflexi and Plantomycetes (Fierer 2017; She et al. 2018) in this study (Figure S4, Supporting Information). Among the measured environmental factors, importantly, we found that soil bacterial community composition was strongly correlated with DOM quality after controlling for the effect of geographic distance (Table 2). This result indicated that not only the conventional physiochemical factors such as pH (Fierer and Jackson 2006), salinity (Zhang et al. 2019), plant diversity (Prober et al. 2015), but also DOM quality can play a significant role in shaping bacterial community composition and was in accordance with studies conducted in permafrost environments (Zhou et al. 2020), lakes (Muscarella et al. 2019) and sea waters (Zhao et al. 2019). Numerous studies have reported that bacteria specialized on specific DOM substrate and different components of DOM differentially participate in bacterial metabolism (Li et al. 2019; Muscarella et al. 2019; Zhou et al. 2019a). These specific metabolic niches for bacterial utilization of DOM might explain why DOM quality could differentiate bacteria communities.
Other than driving the patterns of bacterial diversity and composition, our results showed that DOM quality was also the most important factor associated with topological variations in bacterial association networks along the sampling transect, with FI explaining more of the variability than HIX (Fig. 5 and Table S4, Supporting Information). Specifically, plant-derived DOM fostered larger and more complex networks than microbial-derived DOM as reflected by the significantly negative relationships between FI and the number of links, nodes and average degree (Fig. 5A). Because individuals in more diverse communities are more likely to interact with other species (Tu et al. 2020), the greater network size and complexity in plant-derived DOM might be linked to the observed higher bacterial diversity sustained by plant-derived DOM (Fig. 1A). In addition, as modules could be regarded as niches (Chaffron et al. 2010; Eiler, Heinrich and Bertilsson 2012), the negative relationship between modularity and FI (Fig. 5A) supports the notion that plant could diversify the resource pool and signifies the importance of plant-derived DOM in offering niches for microbial communities (Li et al. 2019; Huang et al. 2020). Conversely, the proportion of negative links was observed to be positively correlated with FI (Fig. 5A), which indicated that there were fewer negative links in bacterial association networks when DOM was plant-dominated in origin than those when microbial source dominated. This might be attributed to the fact that plant-derived DOM is preferentially consumed by microorganisms and transformed into microbial-derived DOM (Roth et al. 2019; Ye et al. 2020), and suggests that the depletion of plant-derived DOM likely trigger bacterial competition. Previous studies have shown that resource depletion induced by microbe-mediated transformation of DOM could enhance the importance of deterministic selection in community assembly (Zhou et al. 2021) and result in changes in bacterial community structure (Gabor et al. 2014). Our results expanded this by showing that depletion of plant-derived DOM could increase competitive pressure. Overall, we consider that plant-derived DOM could facilitate the development of more niches for bacteria to partition, which would yield higher bacterial diversity, greater interactions and ultimately result in more complex bacterial association networks with less competition.
In summary, this study provides new insights into soil bacterial biogeographic patterns in semi-arid regions by exploring the patterns not only of bacterial alpha- and beta-diversity but also of bacterial association network, as well as by adding detail to the importance of DOM quality in structuring bacterial communities. Our results showed that DOM quality, encompassing the source and the humification degree of DOM, had profound shaping influence on the biogeographic patterns exhibited by bacterial diversity, community composition and association networks. This previously unrecognized importance highlights that inclusion the interactions of DOM quality with bacteria communities is essential to predict how complex bacterial communities and their contribution to ecosystem function will respond to climate change in semi-arid regions.
ACKNOWLEDGEMENTS
This work was jointly funded by the National Key Research and Development Program of China (Project number 2016YFC0500903) and State Key Joint Laboratory of Environment Simulation and Pollution Control (number 18Y01ESTCT). The authors declare no conflicts of interest.
Conflicts of interest
None declared.
REFERENCES
Magoč T,
