


ABSTRACT
Core samples from bioretention cell media as well as surface stormwater sediment samples from seven urban areas were collected to assess the potential for biotransformation activity of polychlorinated biphenyls (PCBs). The presence of putative organohalide-respiring bacteria in these samples was studied. Based on extracted DNA, Dehalobacter, Dehalogenimonas and Dehalococcoides were detected. Other organohalide-respiring bacteria like Desulfitobacterium and Sulfurospirillum were not studied. Bacteria containing the genes encoding for biphenyl 2,3-dioxygenase (bphA) or 2,3-dihydroxybiphenyl 1,2-dioxygenase (bphC) were detected in 29 of the 32 samples. These genes are key factors in PCB aerobic degradation. Transcribed bacterial genes from putative organohalide-respiring bacteria as well as genes encoding for bphA and bphC were obtained from the microbial community, thus showing the potential of organohalide respiration of PCBs and aerobic PCB degradation under both aerobic and anaerobic conditions in the surface samples collected at the bioretention site. Presence and concentrations of 209 PCB congeners in the bioretention media were also assessed. The total PCB concentration ranged from 38.4 ± 2.3 ng/g at the top layer of the inlet to 11.6 ± 1.2 ng/g at 20–30 cm at 3 m from the inlet. These results provide documentation that bacteria capable of PCB transformation, including both anaerobic dechlorination and aerobic degradation, were present and active in the bioretention.
INTRODUCTION
Polychlorinated biphenyls (PCBs) are persistent organic pollutants (Stockholm Convention 2008) that are resistant to physicochemical treatments (ATSDR 2000), making it difficult to eliminate PCBs from the environment. Since the 1960s, urban stormwater has been known to be an important source of water quality impairment pollution incl. for PCBs (Granier et al. 1990). To prevent continued PCB contamination of surface waters, measures must be taken to remove PCBs from stormwater. Chemical treatment methods may not be practical in most stormwater applications because chemical methods can be expensive and energy demanding, and may produce more toxic chlorine-containing products than present in the initial contamination (ATSDR 2000; Luo, D'Angelo and Coyne 2008).
In contrast, biotransformation is a sustainable and potentially energy-saving and economical approach that can be used to remove PCBs from the environment (Luo, D'Angelo and Coyne 2008). PCBs can be biologically transformed via two pathways: (i) aerobic degradation (Flanagan and May 1993) and (ii) anaerobic organohalide respiration (Quensen, Tiedje and Boyd 1988; May et al. 2008). During aerobic degradation, lower chlorinated congeners function as substrate and act as electron donors (Abraham et al. 2002). Genes encoding enzymes of the biphenyl upper pathway (bph) were present in a variety of native bacteria capable of PCB aerobic transformation (Gibson et al. 1993). BphA, BphB, BphC and BphD enzymes are key factors in the biphenyl upper pathway, during which biphenyl is degraded into benzoate and 2-hydroxypenta-2,4-dienote (Pieper 2005). The two critical steps for this process are incorporation of two hydroxyl groups into the biphenyl ring structure (the ring fission reaction), which is catalyzed by the dioxygenase enzymes BphA (encoded by the bphA gene) and BphC (encoded by the bphC gene), respectively (Pieper 2005; Petrić et al. 2011).
The bottleneck process that is required prior to aerobic degradation of highly chlorinated PCBs is anaerobic dechlorination. Here, PCBs serve as electron acceptor and the chlorine substituent is replaced with hydrogen. Chloroflexi bacterium o-17, Dehalococcoides spp. (D. mccartyi CBDB1 and D. chlorocoercia DF-1) and Dehalobium chlorocoercia DF-1 are known to anaerobically transform PCBs by organohalide respiration (OHR) (Cutter et al. 2001; Fennell et al. 2004; Fagervold et al. 2005; Bedard, Ritalahti and Löffler 2007; Adrian et al. 2009; Wang and He 2013; Wang et al. 2014). Some other bacterial genera, including Dehalogenimonas and Dehalobacter, are also reported to be involved in PCB dechlorination (Wang and He 2013a,b). Chlorines can be substituted at all three ring positions: para, meta and ortho, depending on the involved bacteria. Due to steric hindrance at the ortho position, chlorine substitution during organohalide respiration is more likely to happen at flanked para and meta positions (Quensen, Tiedje and Boyd 1988).
Several studies have reported on the potential for PCB biotransformation taking place in stormwater drainage areas and a bioswale (Kjellerup et al. 2012; Gill, Lee and McGuire 2017). Anaerobic dechlorination was observed in soil samples collected in a stormwater drainage ditch in Mechanicsburg, PA. Additionally, in the soil aggregates, putative anaerobic dechlorinating bacteria and biphenyl dioxygenase genes were detected (Kjellerup et al. 2012). In an urban bioswale stormwater control measure (SCM) in New York, NY, bphA genes were detected (Gill, Lee and McGuire 2017).
Bioretention has become an increasingly popular SCM, consisting of a layer of engineered media, typically hardwood mulch, and a layer of vegetation (Davis 2007). Various active biological processes have been reported in bioretention systems. Biodegradation of oil and grease was found in the mulch layer in a bench-scale infiltration study (Hong, Seagren and Davis 2006), while mineralization of naphthalene was observed in laboratory bioretention columns (LeFevre et al. 2012a). Increased quantities of naphthalene dioxygenase genes in the bioretention media indicated the capacity for hydrocarbon biodegradation (LeFevre et al. 2012b). Research concerning biotransformation of PCBs in bioretention media is lacking and is needed to sustainably treat PCBs in stormwater.
Since PCBs have been detected in stormwater samples (Cole et al. 1984; Rossi et al. 2004; Hwang and Foster 2008; Jartun et al. 2008; Zgheib, Moilleron and Chebbo 2011; Gilbreath and McKee 2015; Cao et al. 2019), it is important to study the potential of biotransformation in stormwater sediments and bioretention media. The objectives of this study were to (i) examine the presence of microorganisms capable of PCB transformation, including aerobic and anaerobic pathways in stormwater sediments and bioretention media; (ii) evaluate the abundance of such microorganisms and the potential for PCB biotransformation using gene expression and bioinformatics approaches; and (iii) relate the presence and abundance of microorganisms capable of PCB transformation with accumulated PCB concentrations in the bioretention media.
MATERIALS AND METHODS
Sampling sites
Surface stormwater sediment samples and bioretention media core samples were collected from September 2016 to July 2018. Surface sediment samples were collected at seven different sites, including sites near roadways (BBG and BTM), at an institutional area (UMD), at a commercial area (BV), surrounded by green space (R1 and R2) and at a residential area (CP). At each site, one to three samples were collected at different locations. Descriptions about the sampling sites are summarized in Table 1. More details about sampling process and PCB concentrations can be found in Cao et al. (2019).
Summary of the sampling sites.
| Site name | Description | Drainage area | Sampling time |
|---|---|---|---|
| BBG | Roadside gutter | Roads, buildings | September 2017 |
| BTM | Roadside gutter | Roads, buildings | May 2018 |
| UMD | Bioretention on campus | Road, sidewalk, parking lot | September 2016 |
| BV | SCM along Route 1 | Roads, parking lot, commercial building | September 2017 |
| R1 | Runoff channel on highway | Highway | June 2017 |
| R2 | Roadside gutter | Roads | July 2018 |
| CP | Storm drain in a residential area | Buildings, parking lot | July 2018 |
Media core samples were collected from a bioretention cell located on the University of Maryland campus (College Park, MD). The drainage area of the bioretention included concrete sidewalks as well as asphalt parking lots and roads (Fig. 1). More details about the bioretention facility can be found in DiBlasi et al. (2009). The core samples were taken from the surface to 18–30 cm deep and split into two to four segments. Additional bioretention media samples at the top media layer as well as surface sediment samples for RNA analysis were collected in February 2020. They were stored in an RNA stabilization solution (DNA/RNA Shield, ZYMO RESEARCH, Irvine, CA) and extracted within 24 h.
![Overhead sketch of the bioretention cell at UMD [×: sampling site of the surface sediment samples (sample UMD); dots: sampling sites of the core samples (0, 0.3, 1 and 3 m from the inlet; collected using a JMC environmentalist's subsoil probe [2 cm inner diameter, 71 cm length])].](https://oup.silverchair-cdn.com/oup/backfile/Content_public/Journal/femsec/97/12/10.1093_femsec_fiab159/1/m_fiab159fig1.jpeg?Expires=1750279639&Signature=ZLv8TEWTQDp5tDI8a7KN2VxnIz-qH-EqENDZYhdqYFbM2NfdeEeNNpyry-MO-q~8rNVdUV5sWupB~Hw7RSL9uG~yE9vVFEQQWeSKAdk5KVN3I6p-EAc5n5k80HM-7RJrwXy5wvhyMwU2q4prOH0WHl6dqUPI5JF3-Fnw7Mr0zoGMK6th308dRk50M1t406lUfiElwLoX1eebyHUxuTn1v4WkYGkVZawYZ7C7K6DmbqqAHK28tyHTaqlS~WHLHTD6yIf4VderSEh3moNOVkX4YTS6wBCJmH7pdyePq~pkL7IBBISSixfvpFewxOhhpsuXI5N7lI8e4EEoC2i3FungWA__&Key-Pair-Id=APKAIE5G5CRDK6RD3PGA)
Overhead sketch of the bioretention cell at UMD [×: sampling site of the surface sediment samples (sample UMD); dots: sampling sites of the core samples (0, 0.3, 1 and 3 m from the inlet; collected using a JMC environmentalist's subsoil probe [2 cm inner diameter, 71 cm length])].
PCB extraction and cleanup
The core samples were extracted using microwave-assisted extraction (MAE) and cleaned with alumina as described in Cao et al. (2019). Briefly, 6 g of core samples and 36 mL of hexane/acetone mixture (v/v = 1:1) were extracted at 115°C for 10 min at 1000 W. Before extraction, 20 µL of the mixed solution of surrogates [0.5 µg mL−1 2,4,6-trichlorobiphenyl (PCB 30) and 2,2′,3,4,4′,5,6,6′-octachlorobiphenyl (PCB 204)] was added into each sample to calculate the recovery of the extraction and cleanup process. After MAE, the supernatant was collected and combined with the solvents after washing the samples. The extracts were ready for cleanup after concentrating to <100 µL. The extracts were loaded to a preactivated alumina column and eluted with hexane. The elution was collected and concentrated under N2 flow. Twenty microliters of the mixed solution of internal standards [0.5 µg mL−1 4-bromobiphenyl (4-BB) and 2,2′,4,4′,5,5′-hexabromobiphenyl (hexa-BB)] was added before GC analysis.
PCB analysis
Samples were analyzed using gas chromatography with electron capture detector (GC-ECD) (7890B, Agilent Technologies, Santa Clara, CA). The samples were analyzed with an Agilent J&W HP-5ms column (60 m × 250 μm × 0.25 μm) with the following temperature program: initial temperature at 70°C, 7°C/min to 180°C, 1°C/min to 225°C, 5.8°C/min to 285°C, held at 285°C for 20 min, 11.5°C/min to 300°C and held at 300°C for 10 min. The injection volume was 1 µL and N2 was used as the carrier gas.
All laboratory materials for PCB analysis were made either of glass or PTFE to avoid sample contamination or loss. Detection limits for PCB congeners ranged from 0.0008 to 0.33 ng/g. All values below detection limits were substituted with half of the detection limits. All the measured concentrations were corrected based on the recoveries of surrogates (Mono- to tetra-CBs: using PCB 30; penta- to deca-CBs: using PCB 204).The acceptable range of recovery was 50–125% (Hermanson and Johnson 2007). Samples with surrogate recoveries <50% were not included in the final data analysis. Average surrogate recoveries were 72.6% (range: 55.2–92.8%) for PCB 30 and 87.0% (range: 50.3–105%) for PCB 204.
Extraction of DNA/RNA from surface sediments and bioretention media
Sediment samples were freeze-dried (FreeZone 6 PLUS, LABCONCO, Kansas City, MO, U.S.) before DNA extraction. Sediment genomic DNA (gDNA) were extracted from 0.25 g of the dry sediment samples using a DNeasy PowerSoil Kit (Qiagen, Germantown, MD, U.S.). Sediment RNA were extracted using a ZymoBIOMICS TM DNA/RNA Miniprep Kit (Zymo Research, Irvine, CA, U.S.). Both gDNA and RNA were extracted according to the manufacturer's protocols, with minor modifications. During the process of RNA extraction, gDNA was removed via DNase I treatment. A260/280 and A260/230 were measured using a nanoDrop spectrophotometer (Nanodrop 2000, Thermo Scientific, Waltham, MA, U.S.) to check the quality of extracted DNA and RNA.
cDNA was synthesized ProtoScript II Reverse Transcriptase (New England Biolabs, Ipswich, MA, U.S.) and random primers. Briefly, reaction mixture I was prepared using 60 µM Random Hexamers (2 µL; Invitrogen, U.S.), 10 mM dNTP mix (1.25 µL; Invitrogen, Waltham, MA, U.S.) and RNase-free water (3.75 µL; Zymo Research, U.S.). Three microliters of RNA sample was added to reaction mixture I and denatured at 70°C for 5 min. Reaction mixture II was prepared using 5X ProtoScript II Buffer (5 µL; New England Biolabs, U.S.), 0.1 M dithiothreitol (2.5 µL; New England Biolabs, U.S.), 20 U/µL SUPERase·In RNase Inhibitor (0.5 µL; Invitrogen, U.S.), 200 U/µL ProtoScript II Reverse Transcriptase (1.25 µL) and RNase-free water (5.75 µL). Denatured mixture I with RNA was mixed with 15 µL of Reaction mixture II. The new mixture was incubated at 42°C for 1 h and then inactivated at 70°C for 20 min.
Detection of bacteria capable of PCB transformation
Universal primers 27F and 1392R were used to amplify the 16S rRNA genes of total bacteria (Marchesi et al. 1998). Escherichia coli DNA was used as the positive control. Primers 348F and 884R (Fagervold et al. 2005) were used to detect the putative OHR within the Chloroflexi in the samples, since all known bacteria capable of organohalide respiration are found in this group. Primers 634F/799R (Yan et al. 2009), 728F/1172R (Löffler et al. 2000) and 477F/647R (Grostern and Edwards 2006) were used to detect the presence of Dehalogenimonas(DHG), Dehalococcoides(DHC) and Dehalobacter(DHB), respectively. DNA samples extracted from Dehalococcoides-containing microbial consortium (SDC-9) and the West Branch Canal Creek Consortium (WBC-2) culture were used as positive controls for anaerobic OHR. The bphA gene was amplified using primer sets 463F and 674R (Petrić et al. 2011), which targets the gene encoding for a dioxygenase catalyzing the first step of PCB transformation. P42U-F and P43D-R primers were used for the detection of bphC genes (Erb and Wagner-Dobler 1993). Burkholderia xenovorans LB400 were used as positive control for bphA and bphC genes. Polymerase chain reaction (PCR) products of the correct length were confirmed by electrophoresis using 1.5% agarose gel. Details about the applied primers are shown in Table 2. DNA free water and E. coliwere used as negative controls.
Number of chlorines per biphenyl, concentrations of dioxin-like congeners, TEQPCB and level (mol%) of ortho-chlorinated PCBs in the bioretention core samples. Standard deviations are from three (a) or two (b) samples.
| Cl per biphenyl | Dioxin-like PCBs (ng/g) | TEQPCB (pg/g) | Mol% of ortho-chlorinated PCBs | |
|---|---|---|---|---|
| Entrance 0–10 cm deep | 4.65 ± 0.02 b | 1.92 ± 0.05 b | 6.03 ± 0.73 b | 2.23 ± 0.18 b |
| Entrance 10–20 cm deep | 4.75 | 1.75 | 7.12 | 2.03 |
| 0.3 m from entrance 0–10 cm deep | 4.47 ± 0.10 a | 1.49 ± 0.10 a | 4.85 ± 0.47 a | 2.51 ± 0.20 a |
| 0.3 m from entrance 10–20 cm deep | 4.13 ± 0.18 a | 1.29 ± 0.09 a | 5.55 ± 0.36 a | 3.19 ± 2.71 a |
| 0.3 m from entrance 20–35 cm deep | 4.25 ± 0.13 a | 1.15 ± 0.27 a | 4.87 ± 1.20 a | 2.21 ± 0.10 a |
| 0.3 m from Entrance 25–30 cm deep | 4.37 ± 0.23 a | 0.90 ± 0.14 a | 4.16 ± 1.22 a | 2.73 ± 0.34 a |
| 1 m from entrance 0–10 cm deep | 4.39 ± 0.19 b | 1.48 ± 0.08 b | 4.90 ± 0.71 b | 2.60 ± 0.07 b |
| 1 m from entrance 10–18 cm deep | 4.48 ± 0.24 a | 1.01 ± 0.04 a | 4.64 ± 0.22 a | 2.17 ± 0.34 a |
| 3 m from entrance 0–10 cm deep | 4.52 ± 0.10 a | 1.79 ± 0.10 a | 5.84 ± 0.20 a | 2.38 ± 0.56 a |
| 3 m from entrance 10–15 cm deep | 4.64 ± 0.07 a | 1.78 ± 0.19 a | 6.57 ± 0.58 a | 1.70 ± 0.07 a |
| 3 m from entrance 15–20 cm deep | 4.30 ± 0.18 a | 0.52 ± 0.03 a | 2.23 ± 0.54 a | 2.28 ± 0.33 a |
The abundance of total bacteria and Dehalogenimonas were estimated using quantitative PCR (qPCR) targeting the bacterial 16S rRNA gene using extracted gDNA (341F/907R and 634F/799R, respectively) (Yan et al. 2009; Kjellerup et al. 2012). PCR conditions are shown in Table 2. For total bacteria, the standard DNA template was PCR products from E. coli with primers 341F/907R. For Dehalogenimonas, the standard DNA template was PCR products from WBC2 with 463F/799R. The qPCR reactions were performed with CFX Connect Real-Time System (Bio-Rad, U.S.). With each primer set, no amplification of genes was observed in the negative control.
Analysis of microbial community
Microbial communities in surface sediment and bioretention media samples were studied using Illumina MiSeq (300 bp). For Illumina sequencing library preparation, primer sets targeting the 16S V3 and V4 region and putative anaerobic OHR within Chloroflexi (348F and 884R) were used to amplify the specific region of 16S rRNA genes, respectively (Table S1, Supporting Information). Illumina sequencing adapters and dual-index barcodes were added to the amplicon target.
Sequencing data were processed in the open source statistical and graphing software RStudio (rstudio.com). Low-quality reads were trimmed using a maximum EE value of 2 and the reads were truncated using dada2 and phyloseq R packages (McMurdie and Holmes 2013), after which, the average quality score was above 20 for all samples. The reads were truncated at position 290 for forward reads and at position 256 for reverse reads for the sequencing results targeting putative OHR. For sequencing results targeting V3–V4 region, the reads were truncated at positions 250 and 230, respectively. Sequence abundances in each operational taxonomic unit (OTU) table were normalized by rarefaction based on the minimum read count per sample using the vegan R package.
Data analysis
For the comparison of two groups of data, F-tests were performed to test the equality of two variances and Student t-tests were performed to examine differences among different samples. Pearson correlation coefficients were calculated to study the relationship between two variables. All tests were performed in Microsoft Excel 2016.
RESULTS AND DISCUSSION
Spatial distribution of PCBs in bioretention media
The total PCB concentrations in the core samples ranged from 38.4 ± 2.3 ng/g at the surface of the bioretention entrance to 11.6 ± 1.2 ng/g at 20 cm depth and 3 m from the entrance (Fig. 2). In order to protect aquatic biota, different degrees to which adverse biological effects are likely to occur as a result of exposure to PCBs in sediments were calculated. These guidelines can be used for stormwater sediments because they are similar environments with freshwater and sediments. PCB concentrations in all the core samples were below the consensus-based threshold effect concentration (TEC: 59.8 ng/g) and the probable effect levels (PEL: 277 ng/g). Concentrations below the TEC indicate that adverse effects are not expected to occur on sediment-dwelling organisms (MacDonald, Ingersoll and Berger 2000). However, samples collected at the 0–20 cm section at the entrance were above the interim sediment quality guidelines (ISQGs) concentration (34.1 ng/g), thus adverse biological effects could happen as a result of exposure to PCBs in this sample. PCBs in other core samples were below ISQGs. Additionally, PCB concentrations higher than 1000 mg/kg may cause toxic effects on bacterial communities (Passatore et al. 2014). All the concentrations found in the bioretention media were below this level, indicating that the presence of PCBs would not cause toxicity nor reduction of activity in bacterial communities in the bioretention cell.
![Concentrations of total PCBs, mono- to tetra-CBs and penta- to deca-CBs in the bioretention media core samples at UMD [(A): entrance of the inlet; (B): 0.3 m from the entrance; (C): 1 m from the entrance; (D): 3 m from the entrance. Error bars represent the standard deviation from three samples (for samples from 0 to 10 cm at the entrance of inlet and 0 to 10 cm at 30 cm from the entrance, standard deviation was calculated from two samples)].](https://oup.silverchair-cdn.com/oup/backfile/Content_public/Journal/femsec/97/12/10.1093_femsec_fiab159/1/m_fiab159fig2.jpeg?Expires=1750279639&Signature=wbV8olr8e~jwN1X8LcKf1Js0REn~TWe9rCiZLCWz5qa7T~ffV~Lyo9HIv7zwjl-TQdh60qXkz7d6~7U7ij2m0e0cEY7188F7JsYPUAOwSqrl7eoAI-zn80aBVEdVsmxLZAeseFQmZqQJSUsbfnPDorTWRjr5pyd-UYujt9fje2iBL7oqyh6iumFjFMY8nOgn~hxlsqgrHOWDFiHG3VZvIvkweYhwLyp9eYvYX4E6x06tsX6klB733CYO24i~pie57TC3eLyjJL9D5nfAydbVpnr3KOy-PBygygCjEAq5APDeUZ8UpGkEU15bTJ1v4kkfdBo65tH3t43ZeD9gHxVicw__&Key-Pair-Id=APKAIE5G5CRDK6RD3PGA)
Concentrations of total PCBs, mono- to tetra-CBs and penta- to deca-CBs in the bioretention media core samples at UMD [(A): entrance of the inlet; (B): 0.3 m from the entrance; (C): 1 m from the entrance; (D): 3 m from the entrance. Error bars represent the standard deviation from three samples (for samples from 0 to 10 cm at the entrance of inlet and 0 to 10 cm at 30 cm from the entrance, standard deviation was calculated from two samples)].
Total PCB concentrations decreased as the depth increased (P < 0.05). Additionally, the farther away from the entrance (horizontally), the lower the measured concentrations were. This can be explained by PCBs sorbing onto the bioretention media when they make contact with the media, or are being filtered/settled out. The surface media near the entrance of the inlet received runoff more frequently compared with farther locations, especially during small storm events (<0.25 cm), which produced little runoff. As a result, the surface media near the entrance had a higher potential for adsorption of PCBs in runoff.
In all the core samples, the concentrations of penta- through deca-CBs were higher than that of mono- through tetra-CBs. In the inlet entrance core sample, the concentration of penta- to deca-CBs was 1.5 times that of mono- to tetra-CBs. The higher concentration of highly chlorinated PCBs compared with lowly chlorinated ones indicated that anaerobic organohalide respiration was more likely to impact PCB concentrations in the core samples than aerobic degradation if favorable conditions would be present, such as anaerobic and reduced media environment. Higher concentrations of more chlorinated PCBs were also found in a previous study on surface sediment samples (Cao et al. 2019). The finding of higher concentration of penta- to deca-CBs than that of mono- to tetra-CBs was in accordance with Gilbreath and McKee (2015), where results showed that the hexa- or higher chlorinated congeners were transported in larger proportions during storm flows due to higher Kow and as a result stronger associations with particles.
PCBs in all core samples followed a similar homolog distribution pattern, with di-, tetra-, penta- and hexa-CBs as the predominant homolog groups (Fig. 3). The high abundance of di-CBs was attributed to the presence of PCB 11 (3,3'-PCB). PCB 11 was detected in all the core samples with the highest concentration for individual congeners. The concentration of PCB 11 ranged from 0.49 to 5.29 ng/g. The relative abundance of PCB 11 in the core samples ranged from 4.2% to 15.0% of the total PCB concentrations. Prior study indicated the yellow roadway paints could be an active PCB 11 source (Cao et al. 2019). With vapor pressure higher than 10−4 mm Hg, PCB 11 can evaporate into the atmosphere (ATSDR 2000). Thus it is unlikely that PCB11 will persist in the environment at high concentrations. PCB 26 and PCB 51, two major end products of predominant congeners in A1254 (Kaya et al. 2016), were detected in the bioretention media (PCB 26: 0.04–2.6%, PCB 51: 0.7–1.4%, based on mass). The highest relative abundance (based on mass) of PCB 26 in Aroclors is 1.6% and for PCB 51 it is 0.3% (Frame, Cochran and Bøwadt 1996). The higher relative abundance of such dechlorination products in the bioretention media indicated dechlorination of higher chlorinated congeners in the bioretention.
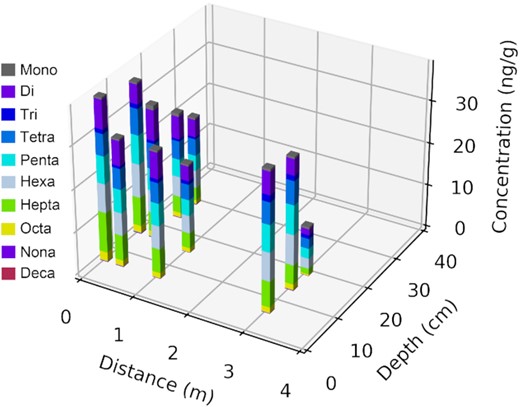
Concentration of homolog groups in the core samples from the bioretention cell.
The number of chlorines per biphenyl in the core samples were similar, ranging from 4.13 to 4.75 with an average of 4.41 ± 0.24 (Table 3). No trend could be found between chlorine numbers and depth or distance from the entrance. This indicated that the mobility of PCBs in the bioretention media was not related to the number of chlorines.
Presence of aerobic PCB-degrading bacteria, putative OHR and subgroup of OHR. (‘+’ means presence of the target bacteria; ‘−’ means absence of the target bacteria; blank means not analyzed).
| Sites | PCB-degrading bacteria (bphA gene) | PCB-degrading bacteria (bphC gene) | Putative dechlorinating bacteria | DHG | DHB | DHC | |
|---|---|---|---|---|---|---|---|
| BBG1 | + | + | (+) | + | − | − | |
| BBG2 | + | + | + | + | − | − | |
| BTM1 | + | + | + | + | − | − | |
| BTM2 | − | − | + | + | − | − | |
| BTM3 | + | + | + | + | − | − | |
| BV1 | + | + | + | + | − | − | |
| BV2 | + | + | + | + | − | − | |
| BV3 | + | + | + | + | + | − | |
| CP1 | + | + | + | + | − | + | |
| CP2 | + | − | + | + | − | + | |
| CP3 | + | + | + | + | − | + | |
| R1_1 | + | + | + | − | − | ||
| R1_2 | + | − | + | − | − | ||
| R1_3 | − | − | + | − | − | ||
| R2_1 | + | (−) | − | + | − | + | |
| R2_2 | + | + | − | + | − | + | |
| Distance/m | Depth/cm | ||||||
| 0 | 0–10 | − | + | + | + | − | − |
| 10–20 | + | + | + | + | − | + | |
| 20–25 | + | + | + | + | − | + | |
| 0.3 | 0–10 | + | + | + | + | − | − |
| 10–20 | − | + | + | + | − | − | |
| 1 | 0–10 | + | + | + | + | − | − |
| 10–20 | − | (−) | + | + | − | − | |
| 20–33 | − | + | + | + | − | − | |
| 2 | 0–10 | − | + | + | + | − | − |
| 10–20 | − | (−) | + | + | − | − | |
| 20–25 | + | + | + | + | − | − | |
| 25–33 | + | + | + | + | − | − | |
| 3 | 0–10 | + | − | + | + | − | − |
| 10–20 | + | − | + | + | − | − | |
| 20–25 | − | + | + | + | − | − | |
| 25–35 | − | + | + | + | − | − | |
The level of unflanked ortho-chlorinated PCBs, which is an indicator of organohalide respiration (EPA 2004), ranged from 1.7 ± 0.03% to 2.7 ± 0.34%. The preferred loss of chlorines in the meta and para positions result in an increase in the level of unflanked ortho-chlorinated PCBs (EPA 2004). As a result, a high level of unflanked ortho-chlorinated PCBs indicates the presence of anaerobic organohalide respiration. The levels of ortho-chlorinated PCBs found in the core samples were significantly higher (P < 0.001) than the values found in accumulated stormwater sediment samples at a dense urban area, where the level was 0.50% (Cao et al. 2019). The fraction of unflanked ortho-chlorinated PCBs in Aroclor mixtures ranged from 0.2% to 2.4% (ATSDR 2000). Five of the 11 core samples had a higher level of ortho-chlorinated congeners than the maximum value found in Aroclor mixtures (2.4% in A1016). The fraction of chlorines at different positions was also calculated and the results showed an increase of chlorine at the ortho-position (Fig. 4). Both of these measures suggest that some amount of anaerobic dechlorination took place in the bioretention media.
![Fraction of ortho-, meta-, para-chlorines in PCBs present in core samples from the UMD bioretention cell. [(A): entrance of the inlet; (B): 0.3 m from the entrance; (C): 1 m from the entrance; (D): 3 m from the entrance. Error bars represent the standard deviation from three samples (for samples from 0 to 10 cm at the entrance of inlet and 0 to 10 cm at 30 cm from the entrance, standard deviation was calculated from two samples)].](https://oup.silverchair-cdn.com/oup/backfile/Content_public/Journal/femsec/97/12/10.1093_femsec_fiab159/1/m_fiab159fig4.jpeg?Expires=1750279639&Signature=O24H6NzbtyAf3lFsgILDMmKlNqy4zENRdJImkMQLW6x58zjqbH5ce3uqPAZM4Q5WbcnlbSgmZML0KIJoF8iPJmsnuqZ0oCxZa97QMp~vOTjO8O4RreF-c7Ej847FKvMuoFXvYIrSYYqcjyRYXxrRtIgnhvNp5kj9VRqqIuFZLZhNoUCkuBJeKDthQNOlFSWZs0OCcOhFKPhsIJB3dGX6EnzCSiQS0aj--8IRWBSm-imkQPidXS6KHxcQdjvKaCbVXAvCN4-lm2G~qPhzVVXEMbfmPzzfXMU5MPp1fqTGz3dcMFqzaSVJYEjTwyfRjs7s7rFLV6Bn7xKEi9FFXylCEA__&Key-Pair-Id=APKAIE5G5CRDK6RD3PGA)
Fraction of ortho-, meta-, para-chlorines in PCBs present in core samples from the UMD bioretention cell. [(A): entrance of the inlet; (B): 0.3 m from the entrance; (C): 1 m from the entrance; (D): 3 m from the entrance. Error bars represent the standard deviation from three samples (for samples from 0 to 10 cm at the entrance of inlet and 0 to 10 cm at 30 cm from the entrance, standard deviation was calculated from two samples)].
Dioxin-like PCBs (PCBs 77, 81, 126, 169 105 114, 118, 123, 156, 189) can exert toxic responses similar to those caused by 2,3,7,8-tetrachlorobenzodioxin (Van den Berg et al. 1998). Due to their toxicity, the concentration of dioxin-like PCBs is of special concern. Toxic equivalency values (TEQs) were calculated to evaluate the toxicity of dioxin-like PCBs in the bioretention media. The TEQs ranged from 2.23 ± 0.54 to 6.57 ± 0.58 pg/g TEQPCB (Table 3), which were in the range of the TEQs found in Northwest Mediterranean sediment (0.03–24.8 pg TEQ/g) (Eljarrat et al. 2001). The lowest TEQ was found in the 20–30 cm deep sample at 3 m from the entrance. A Pearson correlation coefficient was calculated at −0.47, indicating no linear relationship could be found in TEQs regarding the depth and distance of the core samples. All the core samples were below the safe sediment value of 20 pg TEQ/g (Eljarrat et al. 2001). This finding indicated that the bioretention media samples at different locations of the bioretention were safe when only considering the dioxin-like congeners.
Microbial communities in surface and sediment samples
A total of 6448 bacterial OTUs and 526 bacterial OTUs within Chloroflexi were distributed across all the samples. The plateaus in all the rarefaction curves indicate that the majority of the resident phylotypes were collected in these samples (Fig. S1, Supporting Information).
Among the 40 phylogenetic groups, the most dominant bacterial phyla were Actinobacteria (20.2–34.6%), Proteobacteria (13.6–47.9%), Chloroflexi (0.3–18.4%), Cyanobacteria (0.3–38.3%) and Acidobacteria (1.2–15.6%) (Fig. 5A). The predominance of Chloroflexi and Proteobacteria was observed in the acclimated raw sludge during the anaerobic degradation of 2,4,6-trichlorophenol (Song et al. 2019). Some bacteria belonging to Chloroflexi are known to be obligate OHR (Dam et al. 2019).
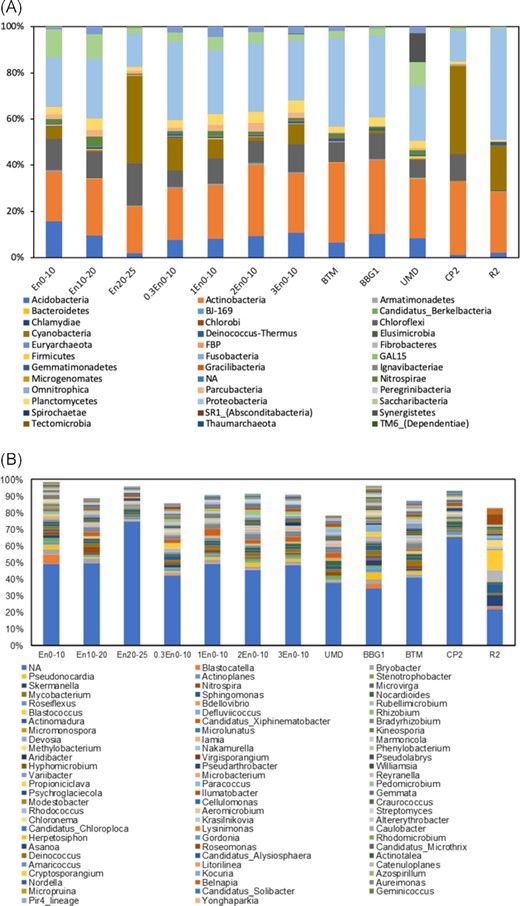
(A) Relative abundance of bacterial OTUs at the phylum level in core samples and surface samples; (B) relative abundance of the top 80 bacterial OTUs at the genus level in core samples and surface samples.
Looking at the relative abundance of OTUs based on primers for putative OHRs at class level in the bioretention cores and surface sediment samples, Chloroflexia (0–63.9%) and Ktedonobacteria (0–70.5%) were the most dominant classes (Fig. 6A). The class Dehalococcoidia, to which several genera capable of organohalide respiration belong, was detected in three of the six core samples and three of the eight surface sediment samples. The relative abundance of Dehalococcoidia ranged from 3.78% to 27.9% in these samples. The presence of Dehalococcoidia further demonstrated the potential of organohalide respiration in these samples.
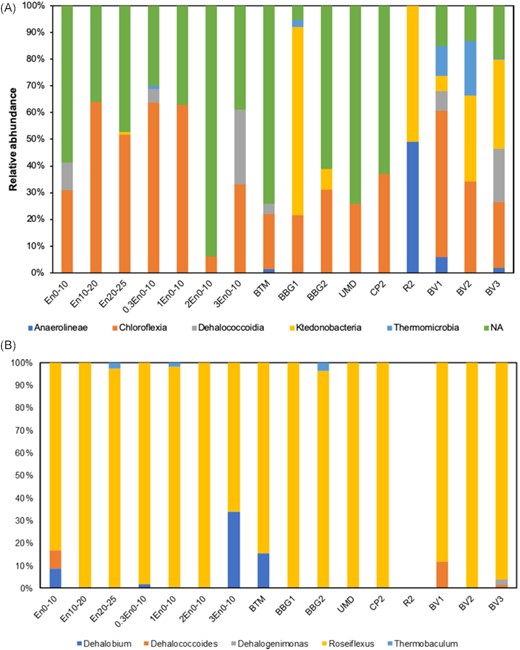
(A) Relative abundance of bacterial OTUs at class level of a monophyletic group within Chloroflexi at different sites; (B) relative abundance of identified bacterial OTUs at genus level of a monophyletic group within Chloroflexi at different sites.
At genus level, Dehalococcoides was found at BV1, BV3 and 0–10 cm at the bioretention entrance (Figs 5B and 6B). Dehalococcoides mccartyi was detected at BV3. This species performs organohalide respiration of Aroclor 1248, Aroclor 1254 and Aroclor 1260 (Adrian et al. 2009; Kaya et al. 2016). Top layer core samples at the inlet, 0.3 and 3 m from the entrance, and surface sediment sample at BTM contained Dehalobium species. Dehalobium chlorocoercia DF-1 was isolated from a tidal estuary of Charleston Harbor and is utilizing 2,3,4,5-tetrachlorinated biphenyl (PCB 61) as the sole electron acceptor (Wu, Sowers and May 2000). Dehalogenimonas was detected at site BV3. Dehalobacter was not detected in any of the samples. The detection rates of Dehalococcoides, Dehalogenimonas and Dehalobacter were lower compared with PCR results, suggesting the low abundance of these anaerobic bacteria. The presence of different OHRs is a prerequisite for organohalide respiration and more evidence on the activity of such OHRs is needed.
In addition to the anaerobic OHR, bacteria potentially capable of aerobic degradation of PCBs were also explored. Rhodococcus was present in all the samples with a relative abundance ranging from 0.19% to 1.36% of total OTUs (Fig. 7). Rhodococcus is an important genus because some strains were reported to degrade 45 PCB congeners from PCB mixture with mono- to octa-CBs (Seto et al. 1995). The presence of Rhodococcus in the samples suggested a potential for PCB degradation via aerobic pathways.
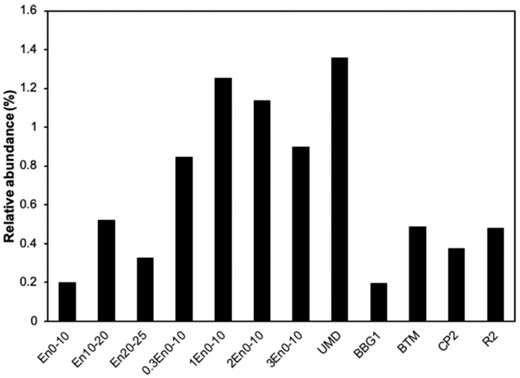
Relative abundance of bacterial OTUs belongs to Rhodococcus genus.
Sequencing data indicated that Chloroflexi was an important component of the microbial communities in both surface sediment samples and bioretention core samples. Within the phylum Chloroflexi, bacteria capable of organohalide respiration such as Dehalogenimonas, Dehalococcoides and Dehalobium exist. Bacteria capable of PCB degradation under aerobic conditions such as Rhodococcus were also detected in the stormwater sediments and bioretention cores. The presence of such microorganisms capable of PCB transformation is a prerequisite for PCB transformation. However, it is still not clear if the microorganisms are actually biotransforming PCBs. Evidence on the protein level is needed to prove the activity of these microorganisms.
Presence and abundance of bacteria capable of PCB transformation
qPCR results showed that the gene copy number of total bacteria (341F/907R on 16S rRNA gene) ranged from 3.23 × 10⁶ ± 1.71 × 10⁵ to 2.92 × 10⁹ ± 1.78 × 10⁸ copies g−1 sediment in the bioretention core samples (Fig. 8). The gene copy number is an estimation to the number of bacteria because the number of gene copies for each bacterium varies (Větrovský and Baldrian 2013). The gene copy number decreased when the soil depth increased, especially for core samples at 2 and 3 m from the inlet entrance. This might be related to the higher abundance of nutrients and oxygen level in the top layer. The total carbon content decreased from 4.5% to 1.5% in the top 30 cm and was stable at 1.5% at deeper layers. A similar trend was observed for total nitrogen in a previous study of the bioretention cell (Li and Davis 2014). More bacteria as well as microbial activity found at the surface layer may be due to the higher abundance of nutrients like oxygen, nitrogen and phosphorus in the upper layers of the media.
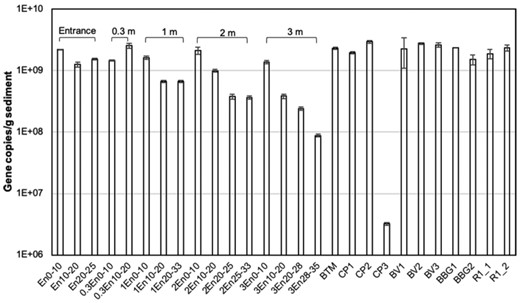
Quantitative assessment of the abundance of total bacterial 16S rRNA genes in the core samples as well as surface sediment samples. Error bars represent standard deviation (n = 3).
PCR results showed that OHRs and subgroup of OHRs like Dehalococcoides,Dehalobacter and Dehalogenimonas were detected in the sediment samples and bioretention core samples (Table 3). The functional genes encoding bphA and bphC also showed positive results in some of the stormwater sediments and bioretention cell.
According to PCR results, putative dechlorinating bacteria within Chloroflexi were present in all the bioretention core samples and eleven of the surface stormwater sediment samples, indicating the potential for organohalide respiration in these samples. The high detection frequency in the bioretention media samples could be related to anaerobic microsites inside soil particles and/or brief inundation periods following each storm event. Saturation could reduce the redox potential in bioretention cells to −100 mv as it was observed in two raingardens in Haddam, CT (Dietz and Clausen 2006). Anaerobic activities like denitrification were shown to occur during such conditions (Waller et al. 2018). Additionally, higher abundance of denitrifying bacteria was observed in the top media than deeper layers in SCMs, indicating the presence of anoxic microenvironment in the upper layers (Willard et al. 2017; Chen et al. 2019). These findings suggest that a favorable condition for organohalide respiration in bioretention cells could be present. Putative dechlorinating bacteria were also detected in 10 of the 19 soil samples collected in a stormwater drainage ditch in 2012 in Mechanicsburg, PA, at 5 × 10³ to 5 × 10⁶ bacteria g−1 soil (Kjellerup et al. 2012). The presence of putative dechlorinating bacteria within Chloroflexi in different environments indicated the potential of anaerobic dechlorinating in stormwater drainage and river sediments.
For aerobic degradation, PCR using the bphA genes as a target showed positive results in 14 of the 16 surface sediment samples and seven of the bioretention core samples (Table 3). The detection rate of bphC (69%) was lower compared with bphA (88%) for the surface sediment samples. However, bphC (75%) was more frequently detected in the core samples than bphA (50%). Aerobic PCB degraders were also present in half of the soil samples from the stormwater drainage ditch mentioned above (Kjellerup et al. 2012). In addition, bphA was found in the sediment samples from Indiana Harbor and Ship Canal and a correlation between bphA gene abundance and PCB concentration was observed (Liang et al. 2014). Therefore, the occurrence of bphA in different natural environments could be a microbial response to PCB contamination and indicate the presence of potential of in situ hydroxylation on the biphenyl rings. bphC genes were also detected in PCB-contaminated soil from a long-term electronic waste recycling area in Taizhou, China (Hu et al. 2016). The presence of both bphA and bphC genes suggested that aerobic PCB degradation occurred in these samples, which could lead to complete mineralization.
Twenty-two of 32 samples contained both putative dechlorinating Chloroflexi and bphA/bphC. The co-occurrence in these samples indicated that bacteria capable of simultaneous aerobic and anaerobic PCB transformation were present. For example, during a storm event, the media is saturated and an anaerobic environment exists. In this condition, anaerobic organohalide respiration could take place and the number of chlorines on the PCB molecules would be reduced. When the water is drained and the environment subsequently becomes aerobic, the presence of bphA/bphC genes indicated a potential of biphenyl ring deoxygenation and/or ring cleavage. The presence of bacteria capable of PCB transformation indicates that a microbial response to PCB contamination would be a solution for bioretention cells in the long term, including organohalide respiration of highly chlorinated congeners and subsequent aerobic degradation of low chlorinated congeners.
The samples were further tested for OHR at the genus level with selected targets capable of organohalide respiration. Dehalobacter,Dehalogenimonas and Dehalococcoides have been reported to each contain 10–38 reductive dehalogenase (rdh) genes (McMurdie et al. 2009; Maphosa et al. 2012; Siddaramappa et al. 2012; Türkowsky et al. 2018) and are all capable of dechlorination with PCBs. Dehalococcoides spp. are abundantly involved in organohalide respiration (Yoshida et al. 2007; Qiu et al. 2020; Zhang et al. 2021) and it was reported that they altogether can respire with 64 tetra- to nona-PCBs in A1260 (Bedard, Ritalahti and Löffler 2007). Dehalococcoides strains were detected in five surface samples and two of the core samples. Yan et al. (2009) also detected Dehalococcoides in two of the eight contaminated groundwater samples from the Petro-Processors of Louisiana, Inc. Superfund site. The presence of this genus is crucial in the organohalide respiration of PCBs in various environments.
Dehalobacter strains have been detected in one of five soil samples contaminated with the aliphatic organohalide tetrachloroethene (Yoshida et al. 2007). Dehalobacter spp. could be responsible for PCB dechlorination (Wang and He 2013) even though Dehalobacter had the lowest detection frequency in this study (only one surface sediment, Table 3). Dehalogenimonas were detected in all the collected surface sediment and core samples. A high detection frequency was also observed in Yan et al. (2009), where Dehalogenimonas strains were detected in all the eight groundwater samples tested in this study. Dehalogenimonas bacteria were reported to couple their growth with PCB dechlorination (Wang and He 2013). The presence of Dehalobacter,Dehalogenimonas and Dehalococcoides in different environments is a likely result of microbial response to PCB contamination and suggests that dechlorination is occurring in stormwater sediments and bioretention media.
The abundance of Dehalogenimonas from different samples showed that higher levels were found in surface sediment than the core samples (Fig. 9 ). Overall, Dehalogenimonas abundance was approximately six orders of magnitude lower than the presence of total bacteria, indicating the low abundance of Dehalogenimonas among all the bacteria in the bioretention media. Low relative abundance of Dehalogenimonas is commonly found in natural environments. In groundwater samples collected at the Petro-Processors of Louisiana, Inc. Superfund site, abundance of Dehalogenimonas represented 0.0014–9.2% of total bacteria (Yan et al. 2009). However, relative abundance of Dehalogenimonas of total bacteria could reach 16–30% in sediment mesocosms (Qiao et al. 2018). Additionally, the relative abundance of Dehalogenimonas was not related to PCB concentration in the cores (Pearson correlation: −0.16). These results indicate that Dehalogenimonas were not the major bacteria performing organohalide respiration in either surface sediments or bioretention media or the PCB concentrations were higher than what Dehalogenimonas need for metabolism. The presence of all these genes indicate a potential of both anaerobic dechlorination and aerobic degradation on PCBs in stormwater sediments as well as bioretention cells.
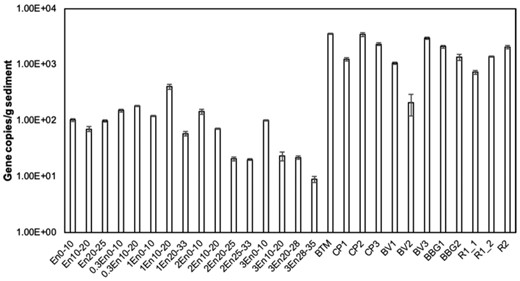
Abundance of Dehalogenimonas in the bioretention core and surface sediment samples. All data points are averaged triplicate tests. Error bars represent standard deviation from three samples.
Presence of bacteria capable of PCB transformation based on RNA
Transcription analyses of bphA and bphC functional genes, Dehalogenimonas and putative OHR were performed (Table 4). This evaluation (the first of its kind to our knowledge) was performed to confirm that expression of genes involved in PCB transformation (e.g. bphA, bphC, Dehalogenimonas 16S and putative dechlorinating bacteria) occurred. Different from PCR results based on DNA, only one of the five samples was detected with bphA genes and three with bphC genes. All the samples were tested positive for putative OHR and subgroup Dehalogenimonas. Difference in microbial community as well as functional gene abundance between DNA and RNA were also observed in urban green infrastructure bioswale soils in New York City (Gill, Lee and McGuire 2017). The difference between DNA and RNA based results indicated that the presence of target sequence in DNA does not denote activity of the microorganisms. On the contrary, a positive result from RNA indicates that the genes with positive results were expressed and target microbial activity could be expected. Thus, the presence of transcripts is more direct evidence than DNA when studying the activities in the microbial community (Gill, Lee and McGuire 2017). Based on the transcriptomic results, the presence of putative OHR and bphA/bphC genes showed that these bacteria were active at different locations in the bioretention cell at the time of sample collection. Thus, anaerobic dechlorination and aerobic degradation were taking place at different locations in the bioretention.
Transcripts confirmed from PCB transforming bacteria.
| Sites | PCB-degrading bacteria (bphA gene) | PCB-degrading bacteria (bphC gene) | Putative anaerobic dechlorinating bacteria | Dehalogenimonas |
|---|---|---|---|---|
| UMD | − | − | + | + |
| En0–10 | − | − | + | + |
| 1En0–10 | − | + | + | + |
| 3En0–10 | + | + | + | + |
| 10En0–10 | − | + | + | + |
Potential of in situ biotransformation
Although the presence and activity of anaerobic dechlorination and aerobic PCB degradation were found in the stormwater sediments, the feasibility of in situ biotransformation is still unknown. The study on the in situ biotransformation of PCBs was scarce. Loss of ∼25% of the PCB mass was observed after 360 days in the nonbioaugmented treatment with PCB-impacted sediment from Baltimore Harbor (Payne et al. 2013). An 80% decrease by mass of PCBs was observed in the mesocosm bioaugmented with both anaerobic Dehalobium chlorocoercia DF1 and aerobic Burkholderia xenovorans LB 400 (Payne et al. 2013). These indicated that with presence and activity of microorganisms capable of PCB transformation, PCB mass loss is expected in the long term. An in situ treatment of bioaugmentation is needed to enhance PCB transformation in natural environments such as bioretention cells (Payne, May and Sowers 2011). In this study, microorganisms capable of PCB transformation under both aerobic and anaerobic conditions were found in stormwater sediments and bioretention cells. The coexistence of both microorganisms could be an effective strategy to reduce PCB levels.
Bioretention design and maintenance recommendations
The decreasing trend in PCB concentration found in the bioretention core suggests that bioretention is efficient in retaining PCBs from stormwater. Higher PCB concentrations found in the surface layers indicate that a shallow cell design might be enough for PCB removal. In addition, in order to enhance performance and reduce costs, only the top layer of the existing bioretention media needs to be replaced. Brown and Hunt (2012) repaired two sets of bioretention cells by excavating the top 75 mm of media and both surface storage volume and infiltration rate were increased significantly. PCB concentration in the bioretention media as well as effluent samples should be inspected at least once a year to decide whether maintenance is needed for the bioretention. The vertical profile of PCBs in the media core could also suggest that the depth of media needs to be excavated.
The benefit of using bioretention to treat PCBs in stormwater is that the bioretention media allows the cell to hold as much water as possible, including occasional ponding of water (Davis et al. 2009). This saturation can create anaerobic conditions and longer retention for anaerobic respiration to take place. During the process, some more-chlorinated PCBs become less-chlorinated PCBs (Cl ≤ 4) and they are ready to be degraded when the media becomes aerobic.
CONCLUSIONS
PCBs were detected in the bioretention media core samples. Total PCB concentrations decreased with increasing depth. Lower concentrations of total PCBs were found in media more distant along the flow path, indicating that PCBs were retained in the bioretention media when entering the bioretention cell. Bioretention is efficient in retaining PCBs from stormwater and a shallow cell design might be enough for PCB removal. Besides, when maintaining the existing bioretention, only the top layer of bioretention media needs to be replaced. The higher level of ortho-chlorinated biphenyls found in some of the bioretention core samples compared with Aroclors indicated the presence of dechlorination.
Bacteria capable of PCB transformation via both aerobic (bphA and bphC genes) and anaerobic (Dehalococcoides, Dehalogenimonas and Dehalobium) pathways were detected in the DNA extracted from the surface sediment samples as well as core samples. In some samples, both the putative OHR and functional genes encoding enzymes for biphenyl degradation were found, which indicated the potential of the co-occurrence of simultaneous aerobic and anaerobic PCB respiration. The higher level of unflanked ortho-chlorinated congeners and major metabolites from Aroclors found in some bioretention media samples as well as vertical profile of different chlorines showed evidences of dechlorination.
Both the DNA- and RNA-based results indicate potential of PCB biotransformation in stormwater sediments and bioretention cell. However, due to the low abundance of bacteria capable of PCB transformation, the dechlorination rate and degradation rate could be very low in these environments. Thus, in situ bioaugmentation might be needed to enhance the treatment rates in PCB-impacted bioretention media.
FUNDING
This study was funded by the Maryland Department of Transportation State Highway Administration, Office of Environmental Design.
Conflicts of interest
The authors declare that they have no known competing financial interests or personal relationships that could have appeared to influence the work reported in this paper.
