


ABSTRACT
Virtually all heterotrophs incorporate carbon dioxide by anaplerotic fixation. Little explored, however, is the interdependency of pathways and rates of CO2fixation on the concurrent usage of organic substrate(s). Potentially, this could reveal which substrates out of a pool of dissolved organic carbon are utilised by environmental microorganisms. To explore this possibility, Bacillus subtilis W23 was grown in a minimal medium with normalised amounts of either glucose, lactate or malate as only organic substrates, each together with 1 g/L NaH13CO3. Incorporation of H13CO3− was traced by elemental analysis-isotope ratio mass spectrometry of biomass and gas chromatography-mass spectrometry of protein-derived amino acids. Until the late logarithmic phase, 13C incorporation into the tricarboxylic acid cycle increased with time and occurred via [4–13C]oxaloacetate formed by carboxylation of pyruvate. The levels of 13C incorporation were highest for growth on glucose and lowest on malate. Incorporation of 13C into gluconeogenesis products was mainly detected in the lactate and malate experiment, whereas glucose down-regulated this path. A proof-of-principle study with a natural groundwater community confirmed the ability to determine incorporation from H13CO3− by natural communities leading to specific labelling patterns. This underlines the potential of the labelling approach to characterise carbon sources of heterotrophic microorganisms in their natural environments.
INTRODUCTION
Reductive carbon fixation under volcanic conditions played a key role in a potential chemoautotrophic origin of life (Huber et al. 2012), and CO2 fixation by autotrophic organisms including plants is among the most important biosynthetic processes in the biosphere (Bassham and Calvin 1962; Giovannoni and Stingl 2005; Berg 2011; Fuchs 2011). However, the presence and diversity of carboxylating (CO2-fixing) enzymes in nature are not restricted to autotrophs alone. Already 80 years ago, utilisation of CO2 was reported for heterotrophic bacteria producing propionic acid (Propionibacteria) (Wood and Werkman 1936). Today, it is recognised that virtually all heterotrophic organisms—from microorganisms to humans—incorporate CO2via a variety of pathways involving at least 18 different carboxylases in the central and peripheral metabolism (Dijkhuizen and Harder 1985; Baltar et al. 2010; Erb 2011; Middelburg 2011). Among these enzymes, anaplerotic carboxylases incorporate CO2 into biomass and replenish intermediates of the tricarboxylic acid (TCA) cycle, which are constantly withdrawn for the biosynthesis of amino acids and other metabolic products (Erb 2011). It is therefore not surprising that carbon from anaplerotic CO2incorporation accounts for a significant amount (i.e. 2–8%) of the cell's biomass carbon abundance (Romanenko 1964; Perez and Matin 1982; Doronia and Trotsenko 1985; Miltner et al. 2004; Roslev et al. 2004; Herndl and Reinthaler 2013).
Among the protein family of carboxylases, pyruvate carboxylase, an anaplerotic carboxylase, catalyses the bicarbonate (HCO3−)-dependent conversion of pyruvate into oxaloacetate. As a component of a putative ancestral reverse TCA cycle, the enzyme is also present in chemolitho-autotrophic bacteria (Giovannelli et al. 2017), which are considered as one of the most ancient forms of life. The reaction of pyruvate carboxylase could therefore represent a metabolic feature that goes back to the early evolution of life (Lombard and Moreira 2011).
The enzyme is widely distributed across the three kingdoms of life and has also been retained in many heterotrophic organisms including the Gram-positive bacterium Bacillus subtilis W23. Generally, pyruvate carboxylase occupies a vital position in the central carbon metabolism, since it is located at the ‘phosphoenolpyruvate-pyruvate-oxaloacetate node’ (Attwood 1995; Owen, Kalhan and Hanson 2002; Jitrapakdee et al. 2008). This metabolic hub unites structurally entangled reactions that interconnect the major pathways of carbon metabolism, i.e. glycolysis (catabolism), gluconeogenesis (anabolism) and the TCA cycle (energy supply of the cell) (Sauer and Eikmanns 2005). However, the direction of the carbon fluxes at this metabolic hub (towards catabolism, anabolism or energy supply) primarily depends on the type of the available dissolved organic carbon (DOC) and it can be expected that the amount of incorporated CO2 (or 13CO2/H13CO3− in tracer experiments, respectively) varies even within the same organism depending on the assimilated organic carbon source (Romanenko 1964; Perez and Matin 1982; Doronia and Trotsenko 1985; Miltner et al. 2004; Roslev et al. 2004). Given a typical metabolic network of a heterotrophic organism capable of carrying out the reaction of pyruvate carboxylase using H13CO3− as a substrate, the following simplified scenarios A–C may be distinguished (Fig. 1).

Metabolic routes of 13C-labelled bicarbonate after anaplerotic fixation during growth on different substrates. Scenarios A, B and C show the expected labelling patterns from H13CO3− when using unlabelled glucose (Glc), lactate (Lac) or malate (Mal) as main organic carbon substrates. The bold arrows indicate main carbon fluxes. Red arrows show the respective fluxes from the supplied H13CO3− tracer through the metabolic network; blue arrows depict the carbon fluxes from the unlabelled organic substrates, respectively. Metabolites and products marked with a red circle are expected to receive 13C-label originating from H13CO3−.
Scenario A: During growth on carbohydrates like glucose (Glc), the glycolytic flux constantly produces pyruvate (Pyr), which is further oxidised to acetyl coenzyme A (Ac-CoA). Ac-CoA requires oxaloacetate (Oxa) to form citric acid (Cit) in the first reaction of the TCA cycle. The TCA cycle serves, on the one hand, to catabolise substrates to CO2. On the other hand, intermediates of the TCA cycle are used as building blocks for biosynthesis. Hence, equivalents of Oxa are constantly withdrawn from the TCA cycle for the formation of Asp and related amino acids. Therefore, the pool of Oxa must be replenished to keep the cycle running. To this end, in B. subtilis W23, pyruvate carboxylase directly converts Pyr to Oxa via the addition of H13CO3−. Consequently, TCA cycle metabolites and any products derived thereof, e.g. amino acids like Asp, Lys, Thr, Glu or Pro, are expected to carry this label from H13CO3−.
Scenario B: When substrates such as lactate (Lac) enter the metabolic network somewhere between glycolysis and the TCA cycle, Oxa must also be replenished via the reaction catalysed by pyruvate carboxylase, in the same way as in the first scenario. In this case, however, also gluconeogenesis via Oxa and phosphoenolpyruvate (PEP) would be expected to become active in order to satisfy the need of the organism for glucose and its derivatives (e.g. for building up membranes and the cell wall of the Gram-positive bacterium). As a result, the 13C-label from H13CO3− is expected not only in the metabolites and the products of the TCA cycle (like in the first scenario) but also in those derived from gluconeogenesis or the pentose phosphate pathway, such as Ser, Gly, His, Phe or Tyr.
Scenario C: When cells grow on TCA cycle intermediates like malate (Mal), the substrate directly replenishes the TCA cycle. Hence, Pyr carboxylation seems not to be necessary per se and central carbon metabolites are not expected to show 13C incorporation in labelling experiments with H13CO3−.
However, the assumption that heterotrophic fixation of CO2/HCO3− depends on the organic substrate has not been fully exploited yet. This is surprising since this dependency also has the potential to assign the main carbon source that is utilised by heterotrophic microorganisms. Our study aims to close this gap of knowledge by investigating H13CO3− incorporation into B. subtilis W23, a well-known model for a heterotrophic bacterium, during growth on glucose, lactate and malate, respectively. These carbon substrates are indicative of the three different entry points to the central carbon metabolism as depicted in the simplified scenarios in Fig. 1. Additionally, these substrates also represent naturally occurring components in soil and DOC (Šantrůčková et al. 2005; Kleijn et al. 2010; Gleixner 2013).
To assess and to quantify 13C incorporation from H13CO3− in our experiments, we used 13C-based metabolic pathway/flux analysis as a key method (Heux et al. 2017; Nielsen 2017). Using this technology, carbon from 13CO2/H13CO3− can be traced back through the metabolic network of the organism under study. On this basis, not only mechanisms of CO2 fixation but also downstream fluxes via the TCA cycle or gluconeogenesis into metabolic products can be reconstructed on a functional and quantitative basis as shown earlier for plants (Cegelski and Schaefer 2006; Römisch-Margl et al. 2007; Schramek et al. 2010; Ishihara et al. 2015; Bacher, Chen and Eisenreich 2016) or microorganisms (Johnson and Romanenko 1984; Miltner et al. 2004; Roslev et al. 2004; Hesselsoe et al. 2005; Miltner et al. 2005; Alonso-Saez et al. 2010; Wegener et al. 2012). Indeed, the latter experiments also pointed at the crucial role of CO2 fixation in heterotrophic environmental microbes (Šantrůčková et al. 2005; Alonso-Saez et al. 2010; DeLorenzo et al. 2012; Yakimov et al. 2014).
In the present study with B. subtilis W23, H13CO3−-labelling experiments were monitored by elemental analysis-isotope ratio mass spectrometry (EA-IRMS) of total biomass and by gas chromatography-mass spectrometry (GC-MS) of amino acids to show an example of how to assign main (unlabelled) organic substrates on this basis. Subsequently, H13CO3−-labelling experiments with a natural microbial community from groundwater were conducted to provide a proof of principle that this approach indeed opens a new avenue to elucidate substrate usages in complex environmental samples.
MATERIALS AND METHODS
Strain and growth conditions
All experiments were performed with B. subtilis subsp. spizizenii W23 (DSM No.: 6395), a prototrophic derivative of the wild type, obtained from DSMZ (Leibnitz Institute DSMZ—German Collection of Microorganisms and Cell Cultures, Braunschweig, Germany). For pre-cultivation, 5 mL of M9 minimal growth medium, supplemented with 1 g/L glucose, 1 g/L lactate or 1.1 g/L malate, respectively, and preheated to 30°C, were inoculated with 300 µL of a glycerol stock solution of the bacterium. The amounts of organic substrates were chosen in order to ensure that the amount of carbon available to the bacteria (0.4 g/L) was the same in all three set-ups. The pre-cultures were incubated for 20 h. In order to prevent the formation of biofilms, the culture tubes were shaken vigorously at 300 rpm on an orbital incubation shaker (IKA KS 4000i control, IKA-Werke, Staufen, Germany). Each pre-culture was used to inoculate 195 mL of M9 minimal growth medium, preheated to 30°C, in 500 mL Schott bottles. The M9 minimal growth medium was a mixture of 165 mL of M9 minimal medium, 20 mL of a 10 g/L glucose, 10 g/L lactate or 11 g/L malate stock solution, respectively, and 10 mL of a 20 g/L sodium bicarbonate stock solution. The bicarbonate was either NaH13CO3 (98 atom% 13C, Sigma Aldrich, Darmstadt, Germany) in the 13C-labelling experiments or unlabelled NaHCO3 (1.1% natural 13C-abundance, Sigma Aldrich, Darmstadt, Germany) in the control experiments. The bottles were closed gastight after inoculation to block the release of 13CO2. To avoid depletion of O2, an aliquot of fresh air (filter-sterilised using a 0.22-µm syringe filter) that equals the volume of a taken sample was added at every time point of sampling. The cultivations were performed at 30°C and 150 rpm on an orbital incubation shaker.
The M9 minimal growth medium consisted of the following components (per litre): 8.5 g of Na2HPO4 · 2 H2O, 3 g of KH2PO4, 1 g of NH4Cl and 0.5 g of NaCl (= base salts solution). The following components were autoclaved separately before being added to the base salts solution in the given order (per litre): 1 mL of 0.1 M CaCl2, 10 mL trace salts stock solution, 1 mL of 1 M MgSO4 and 1 mL of 50 mM FeCl3 · 6 H2O (filter-sterilised using a 0.22-µm syringe filter). The trace salts stock solution contained (per litre): 100 mg of MnCl2 · 4 H2O, 170 mg of ZnCl2, 43 mg of CuCl2 · 2 H2O, 60 mg of CoCl2 · 6 H2O and 60 mg of Na2MoO4 · 2 H2O. The glucose, lactate, malate and sodium bicarbonate stock solutions were filter-sterilised, using a 0.22-µm syringe filter, before being added to the medium. All solutions were prepared using sterilised MilliQ water. All chemicals were purchased from Sigma Aldrich (Darmstadt, Germany).
13C-Labelling experiments and microbial dry weight
Bacillus subtilis subsp. spizizenii W23 was grown in M9 minimal growth medium supplemented with 1 g/L glucose, 1 g/L lactate or 1.1 g/L malate, respectively, and 1 g/L sodium bicarbonate. The 13C-labelling experiments were conducted in triplicates and the control experiments with unlabelled bicarbonate in duplicates. After 10 h of incubation, one control experiment was spiked with sodium 13C-bicarbonate (1 g/L); the second control experiment remained untouched. Bacterial growth was monitored by determining the optical density at 600 nm (OD600). Samples for biomass and amino acid analysis were taken at intervals of 2 h after inoculation. At each of these time points, 20 mL of the bacterial culture was harvested by centrifugation (4°C, 4000 rpm, 20 min). The supernatant was carefully removed, filter-sterilised, using a 0.22-µm syringe filter and stored at –20°C for high performance liquid chromatography (HPLC) analysis (see below). The cell pellet was re-suspended in 2 mL of sterile MilliQ water and transferred into an Eppendorf tube. After this washing step, a second centrifugation step (4°C, 14 000 rpm, 20 min) pelleted the cells again. The supernatant was carefully discarded and the pellet was frozen at –80°C. The frozen pellets were freeze-dried overnight using a VirTis Sentry 8 L benchtop freeze dryer (SP Industries, Warminster, PA, USA). The freeze-dried bacterial pellets were weighed using a high-resolution balance (CP2P, Sartorius AG, Göttingen, Germany) to determine the microbial dry weight.
Testing of the H13CO3− method with a microbial groundwater community
Natural oligotrophic and oxic groundwater samples were collected from a shallow unconsolidated quaternary aquifer composed of fluvio-glacial carbonate gravel and sands at Neuherberg/Munich, Germany. The freshly collected groundwater contained 1.5 ± 0.2 mg/L DOC, 1.5 ± 0.15 mg/L nitrate (NO3−) and ∼15 μg/L phosphate (PO43−), whereas the concentrations of nitrite (NO2−) and ammonium (NH4+) were below the detection limit of ion chromatography (LOD of 0.1 mg/L) (Dionex ICS-1100; Thermo Fisher Scientific, Bremen, Germany): 200 µL of the filter-sterilised samples were analysed to determine the concentrations of the nutrients. A stock solution of an organic fertiliser (DOC content 300 mg/L) was prepared by dissolving the lyophilised substrates at a pH of 9 in ultrapure water, followed by a neutralisation and a centrifugation step. The supernatant was filter-sterilised using a 0.22-µm syringe filter. The organic fertiliser was mainly composed of humic substances of varying molecular size (PhyotoGreen®-HumusWP, PhytoSolution, Freyburg, Germany).
Each of two bottles with 400 mL groundwater were loaded with 30 and 50 mL, respectively, of the organic fertiliser, spiked with 1 g/L 13C-sodium bicarbonate (NaH13CO3, 98 atom% 13C, Sigma Aldrich, Darmstadt, Germany) and closed with a screw cap. The bottles were incubated in the dark at room temperature for 52 days (13 September 2018–3 November 2018) and gently mixed once a week. Growth of the bacterial groundwater community was monitored by optical density measurements at 595 nm.
To enhance biomass yield, the two bottles were combined (on 3 November 2018), filled with fresh groundwater to a volume of 1000 mL and supplemented with 25 mL of a soil extract, which was prepared from a dark conifer forest soil by solvent extraction: soil from a coniferous wood was extracted with ultrapure water on a stirrer in darkness at 37°C overnight. The extract was filter-sterilised using a 0.22-µm syringe filter to remove microbes. The DOC content of the sterile soil extract stock solution was 100 mg/L. On 20 December 2018, the bottle was again loaded with 25 mL sterile soil extract. Bacterial growth was monitored by optical density measurements at 595 nm.
The experiment was ended on 18 January 2019 by sacrificing the whole bottle via centrifugation. Biomass was concentrated using centrifugal filter units (30 kDa cut-off; Amicon® Ultra-15, Sigma Aldrich, Darmstadt, Germany) to a final volume of 2 mL. The sample was frozen at –80°C and freeze-dried overnight to remove the residual water.
Protein hydrolysis and amino acid derivatisation
For protein hydrolysis, ∼0.5 mg of the freeze-dried bacterial pellet was mixed with 500 µL of 6 M hydrochloric acid and heated at 105°C for 24 h. After cooling to 70°C, the residual hydrochloric acid was removed by a constant stream of nitrogen gas. The dried sample was then re-suspended in 50% glacial acetic acid by sonication for 120 s. A small column (1 mL pipet tip) of the cation exchanger Dowex 50WX8 [200–400 mesh (= 37–74 µm), H+ form] was prepared and washed with 1 mL of methanol followed by 1 mL of MilliQ water. After loading the sample onto the column, it was washed twice with 1 mL of MilliQ water. The bound amino acids were then eluted from the column by 1 mL of 4 M ammonium hydroxide. An aliquot of the eluate was dried under a constant stream of nitrogen gas at 70°C. The dry residue was dissolved in 50 µL of water-free acetonitrile and 50 µL of N-(tert-butyldimethylsilyl)-N-methyl-trifluoroacetamide containing 1% tert-butyldimethylsilylchlorid. This mixture was kept at 70°C for 30 min. The resulting N-tert-butyldimethylsilyl derivatives of the amino acids (TBDMS-amino acid derivatives) were analysed by GC-MS following established protocols (Eylert et al. 2008).
Gas chromatography/mass spectrometry of silylated amino acids
GC-MS analysis was performed using a 7890A GC system (Agilent Technologies, Santa Clara, CA, USA) equipped with a fused silica capillary column (Equity TM-5; 30 m x 0.25 mm, 0.25-μm film thickness; Supelco, Bellefonte, PA, USA). The mass detector worked with electron impact ionisation at 70 eV. An aliquot (1–3 µL) of the solution containing the TBDMS-amino acid derivatives was injected in a 1:10 split mode. The interface temperature was set to 260°C. The column temperature was held at 140°C for 3 min, heated with a temperature gradient of 4°C/min to 165°C, heated with a second temperature gradient of 15°C/min to 200°C and heated with a third temperature gradient of 7°C/min to 280°C where the temperature was held for 3 min. Selected ion monitoring data were acquired using a 0.3-s sampling rate and the samples were analysed three times. Data collection was carried out via the GC-MSD Data Analysis software (Agilent Technologies, Santa Clara, CA, USA). The retention times and the detected mass fragments of the amino acids are listed in Table T1 in the Supporting Information. Incorporation of 13C into amino acids was computed according to Lee et al. (1991). The steps include the determination of the contribution of the derivatisation reagent to the observed spectrum of the silylated amino acid and the correction for contribution from 13C-carbon natural abundance using multiple linear regression analysis. The mass isotopomer distribution after this background subtraction provides fractional 13C-excess values for amino acid isotopomers carrying one 13C-carbon atom (M+1), two 13C-carbon atoms (M+2), three 13C-carbon atoms (M+3) and so on, where the sum over all isotopomers [M + (M+1) + (M+2) + (M+3) etc.] is defined as 100%. As an example, amino acids with an M+1 excess value of 50% are composed of 50% unlabelled molecules (M) and 50% molecules carrying one 13C-carbon (M+1) from the 13C-labelled precursor. Amino acids that carry at least one 13C-carbon atom in excess are termed labelled amino acids in the following.
Carbon isotopic analysis of biomass
Carbon isotopic ratios were determined by an elemental analyser-isotope ratio mass spectrometer (EA-IRMS) consisting of a EuroEA (Euro vector, Milano, Italy) coupled to a Finnigan MAT253 IRMS (Thermo Fisher Scientific, Bremen, Germany) by a Finnigan ConFlow III interface (Thermo Fisher Scientific, Bremen, Germany). For EA-IRMS analysis, a small amount of the freeze-dried pellet (100–400 µg) was put into tin capsules (3.3 × 5 mm; IVA Analysentechnik, Meerbusch, Germany) and subjected to elemental analysis by dropping them into a heated reactor that contained silvered cobalt oxide and chromium oxide (IVA Analysentechnik, Meerbusch, Germany and HEKA tech, Wegberg, Germany). The biomass pellets were combusted in a stream of O2-containing He at 1000°C to produce N2, NOx, H2O and CO2, where NOx was directly converted to N2 again in an online reduction reactor filled with metallic copper filings. The gases were subsequently transferred to the isotope ratio mass spectrometer via a ConFlow III system using a continuous helium stream of 90 mL/min. The CO2 reference gas was provided by CARBO (Bad Hönningen, Germany). The resulting values from EA-IRMS analysis include the natural abundance of 13C-carbon.
Analysis of substrate consumption (HPLC)
The frozen, filter-sterilised supernatant was used for substrate consumption analysis by HPLC. Briefly, glucose, lactate and malate, respectively, were separated and quantified by HPLC using a ligand exchange Aminex HPX 87H column (300 × 7.8 mm) plus pre-column (30 × 4.6 mm) (Bio-Rad Laboratories GmbH, Feldkirchen, Germany). Aliquots of 20 µL were injected per run. The column oven was set to 40°C. The eluent was 5 mM H2SO4 at a flow rate of 0.6 mL/min. Glucose was detected using an RID-10A detector; lactate and malate were detected using the RID-10A and the DAD-SPD-M10Avp detector operating at 210 nm. The retention times of glucose, malate and lactate were 9.1, 9.9 and 12.8 min, respectively.
Statistical analysis
A two-tailed unpaired Student's t-test was used for the analysis of differences between the mean values of 13C incorporation into selected pairs of amino acids from the experiments with glucose, lactate and malate. Statistical significance is depicted as ns = not significant, *P < 0.05, **P < 0.01 or ***P < 0.001.
RESULTS
Growth of B. subtilis in the presence of glucose and H13CO3−
The growth experiment with B. subtilis W23 in M9 medium containing glucose and H13CO3− displayed the usages of both substrates over time for building up its biomass. The glucose concentration in the medium constantly decreased from 5.6 mM to below the analytical detection limit (3 mM in this set-up) at 8 h after inoculation (Fig. 2A). With declining substrate concentration, bacterial biomass increased from 0.03 to 0.44 g/L during the experiment until glucose became limiting. The 13C-abundance of the biomass, as determined by EA-IRMS, steadily rose from 1.1% (natural abundance of 13C-carbon) to a maximum of 6% at 6 h after inoculation (Fig. 2B). Then, the 13C-abundance levelled off and stayed constant at ∼5% until the end of the experiment. The control experiment with unlabelled HCO3− mirrored the natural abundance of 13C-carbon (1.1%) in the environment. In the labelling experiment, the maximum of 13C-abundance of 6% at 6 h and the subsequent decline to 5% could be explained by the production of unlabelled CO2via respiration of unlabelled glucose, which led to the formation of unlabelled CO2/bicarbonate in the medium as growth occurred. This production of unlabelled bicarbonate led over time to a dilution of the supplied H13CO3− as indicated by model calculations (see data files F1–F4 for details and Figure S1 in the Supporting Information). In addition, glucose became limiting so that microbial growth slowed down. Nevertheless, H13CO3− was still present in the medium and was used by B. subtilis W23 for anaplerosis even during the stationary phase of growth finally leading to a stable 13C-abundance of the bacterial biomass till the end of the experiment (Fig. 2B). Specifically, when 13C-bicarbonate was spiked to a non-labelled control after exponential growth in the stationary phase, i.e. after 10 h of inoculation, the 13C-abundance of the biomass still increased up to ∼2% (Fig. 2C). This clearly demonstrated that CO2fixation took place even in the absence of cell growth indicating active metabolism during the stationary phase. In similar experiments, we added H13CO3− to B. subtilis W23 during the stationary phase when grown on lactate or malate, respectively (see also below). The 13C-abundance of the respective biomass was again determined by EA-IRMS and accounted for 3% in the lactate experiment (Figure S2C, Supporting Information) and 2% in the malate experiment (Figure S3C, Supporting Information). Thus, irrespective of the used carbon substrate and the physiological state (growth phase or stationary phase), metabolic turn-over of oxaloacetate involving the reaction of pyruvate carboxylase remained important, probably to maintain the energy balance also in non-growing B. subtilis W23.
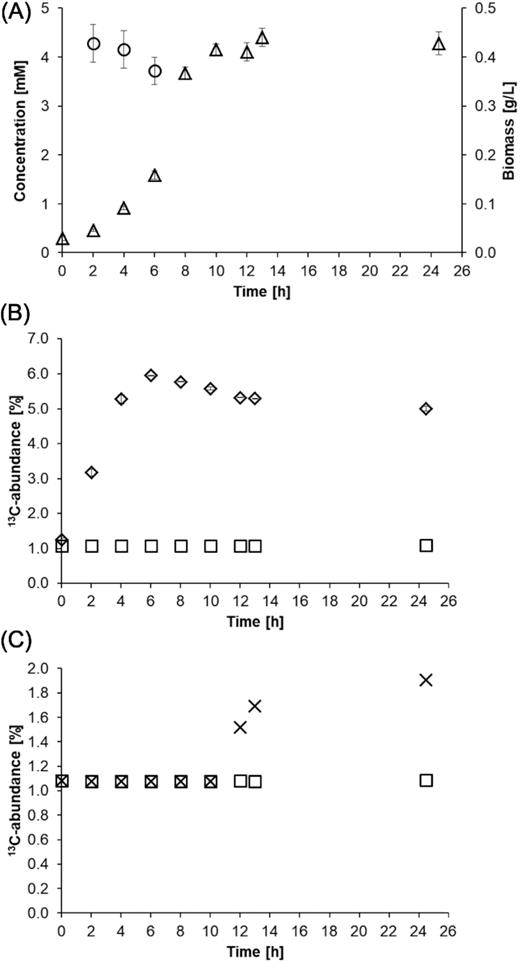
(A) Glucose consumption and biomass production by B. subtilis W23 growing in M9 medium containing 1 g/L glucose. The circles represent the glucose concentration and the triangles the biomass production over time. (B) Incorporation of 13C-carbon into microbial biomass by B. subtilis W23 growing in M9 medium containing 1 g/L glucose and 1 g/L NaH13CO3−. The diamonds represent the 13C incorporation into the biomass as determined by EA-IRMS measurements. The depicted values are mean values of three biological replicates. The squares represent the control experiment conducted with unlabelled bicarbonate that shows the natural abundance of 13C-carbon of 1.1% in the environment. (C) Incorporation of 13C-carbon into microbial biomass by B. subtilis W23 growing in M9 glucose medium containing 1 g/L NaH13CO3− during the stationary phase. The culture was supplied with the tracer 10 h after inoculation. The 13C-abundance of the biomass (depicted as crosses) increased up to 2%. In a control experiment, no H13CO3− was added. The 13C-abundance of the biomass (depicted as squares) again mirrored the natural abundance of 13C-carbon in the environment.
Growth of B. subtilis in the presence of lactate and H13CO3−
The trends for substrate consumption and biomass production for growth on lactate and H13CO3− were similar to the experiment with glucose. Briefly, the concentration of lactate decreased from 11.2 to 0.3 mM, while the biomass increased from 0.03 to 0.43 g/L during the experiment (Figure S2A, Supporting Information). Again, the formation of unlabelled bicarbonate caused a dilution of the 13C-label at the end of the experiment. EA-IRMS showed that under these conditions B. subtilis W23 incorporated 5% of labelled inorganic carbon into its biomass, which is 1% less compared to the glucose experiment (Figure S2B, Supporting Information) (see also Fig. 3).
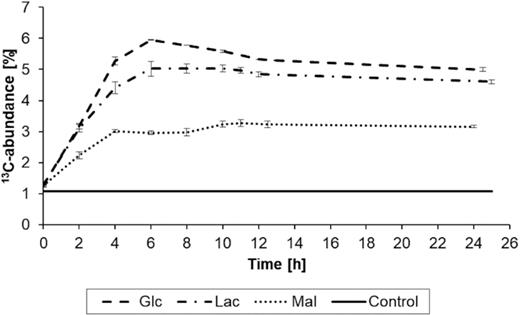
Incorporation of 13C-carbon from H13CO3− into the biomass of B. subtilis W23 growing in M9 containing unlabelled glucose, lactate or malate as carbon sources, respectively. The control shows the natural abundance of 13C-carbon. The depicted values are mean values of three biological replicates. The error bars represent the calculated standard deviation; in case of the control, the error bars are too small to be visible.
Growth of B. subtilis in the presence of malate and H13CO3−
In the third experimental set-up, B. subtilis W23 was grown in M9 medium supplemented with malate and H13CO3−. Measured substrate consumption demonstrated efficient uptake of malate (Meyer and Stülke 2013) that was accompanied by an increase of biomass from 0.04 to 0.29 g/L during the experiment. The concentration of malate in the medium decreased from 8.2 mM to below the analytical detection limit of 0.05 mM (Figure S3A, Supporting Information). When using 13C-bicarbonate in the malate medium, the 13C-abundance of the biomass of the bacteria accounted for 3% under these conditions, as measured by EA-IRMS (Figure S3B, Supporting Information). Notably, this value was significantly lower compared to the glucose and lactate experiments (Fig. 3). Nevertheless, the detection of 13C incorporation came as a surprise, since exogenous malate could have fully refilled the TCA cycle without the need for anaplerotic replenishment, introducing the 13C-label (see simplified scenario C in Fig. 1).
13C-Labelling patterns of amino acids
The 13C-EA-IRMS results demonstrated the general importance of heterotrophic CO2 fixation by pyruvate carboxylase. However, the universal label incorporation under different conditions makes it difficult to achieve the primary objective of our study, namely to identify the use of different substrates. In a next step, we therefore focused on amino acid-specific incorporation of 13C, which should provide more specific data concerning substrate usage. As an example, amino acids from the TCA cycle (e.g. Asp, Glu) or gluconeogenesis (e.g. Tyr, Phe) were expected to acquire a greater fraction of 13C-carbon as compared to those amino acids derived from pyruvate (e.g. Val, Ala), where the incorporation of 13C-carbon should be low (see Fig. 1). Using established protocols (Eylert et al. 2008), we quantified the 13C-excess (mol%) in 14 amino acids obtained from acidic hydrolysis of the biomass. Among the labelled amino acids, 13C-excess was found especially for isotopomers carrying one 13C-carbon atom (M+1 isotopomers) as expected for a labelling experiment with H13CO3−.
During growth on glucose, 13C-excess of the M+1 isotopomers of amino acids derived from intermediates of the TCA cycle, such as Asp, Thr, Lys, Glu and Pro (see also Fig. 1), reached values up to 50% (Fig. 4A). The 13C-excess of the same isotopomers reached values up to 40% when the bacteria were grown on lactate (Fig. 4B) and values up to 15% during growth on malate (Fig. 4C). The 13C-excess of the M+1 isotopomers of amino acids derived from gluconeogenetic intermediates was low for Ser (∼4%) and apparently absent for His (derived from the pentose phosphate pathway intermediate, phosphoribosyl pyrophosphate, PRPP) when B. subtilis W23 was grown on glucose, lactate or malate, respectively. Glycine, which is also derived from gluconeogenetic intermediates, showed a moderate 13C-excess of the M+1 isotopomer under all three conditions (6–8%). Amino acids derived from pyruvate such as Ala, Val and Leu received very low 13C-label under all three conditions (<3%). Amino acids (Tyr and Phe) that were synthesised from the pentose phosphate pathway intermediate, erythrose-4-phosphate, showed moderate 13C-excess of the respective M+1 isotopomers (∼5%) when B. subtilis W23 was grown on lactate or malate (Fig. 4B and C), and no 13C-excess of the same M+1 isotopomers when grown on glucose (Fig. 4A).
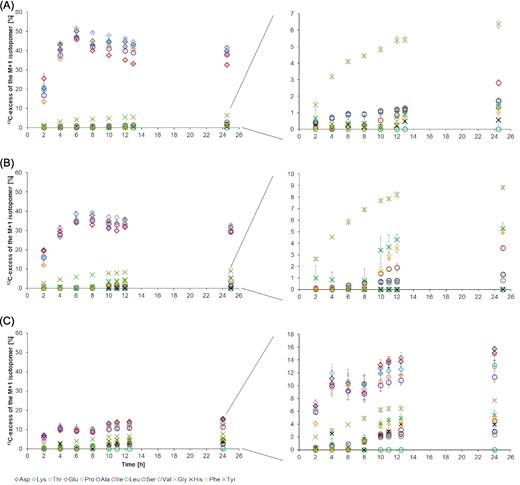
13C-excess (mol%) of the M+1 isotopomers of specific amino acids produced in H13CO3−-labelling experiments with glucose (A), lactate (B) and malate (C), respectively. Amino acids depicted as diamonds are derived from the TCA cycle. Amino acids depicted as circles are derived from pyruvate. Amino acids depicted as crosses are derived from the gluconeogenesis pathway. The 13C-excess of the amino acids derived from pyruvate and the gluconeogenesis pathway are also displayed with a different scaling to improve visibility.
From these comparisons, it becomes already evident that the 13C-patterns in amino acids specifically reflected the (unlabelled) organic carbon substrate used by B. subtilis W23 in our model experiments. However, to better visualise the differences in the respective substrate usages, we now compared ratios of 13C-excess of the M+1 isotopomers in specific sets of amino acids (Fig. 5). More specifically, Ala and Val were used as representatives for 13C incorporation via pyruvate (i.e. displaying only very low 13C-excess of the M+1 isotopomers in the experimental settings). Tyr and Phe served as representatives for 13C-bicarbonate incorporation via gluconeogenesis and the pentose phosphate pathway, whereas Asp and Glu were used as representatives for 13C incorporation via the TCA cycle (see also Fig. 1). The ratios of the 13C-excess of the M+1 isotopomers at quasi steady-state conditions (from 10 h after inoculation till the end of the experiment) gave clear diagnostic trends that uniquely allowed discerning the three different scenarios shown in Fig. 1. When calculating the ratios between the 13C-excess of the M+1 isotopomers in TCA cycle-derived amino acids and those of pyruvate-derived amino acids (i.e. Asp/Val, Asp/Ala, Glu/Val and Glu/Ala), values above 20 were obtained in the experiments with glucose or lactate, where TCA cycle metabolites must be replenished, whereas ratios below 10 were obtained for the same sets of amino acids in the experiments with malate, where anaplerosis is not needed (Fig. 5A). When calculating the ratios between the 13C-excess of the M+1 isotopomers in gluconeogenesis-derived amino acids and those in pyruvate-derived amino acids (i.e. Tyr/Val, Tyr/Ala, Phe/Val and Phe/Ala), ratios above 4 were obtained for experiments with lactate (i.e. under apparently active gluconeogenesis), whereas ratios of 1 or lower were observed for growth on glucose where gluconeogenesis is not needed (Fig. 5B). Thus, ratios of 13C-excess of the M+1 isotopomers between these selected groups of amino acids provided highly selective markers to distinguish the main organic carbon substrates in our model experiments.
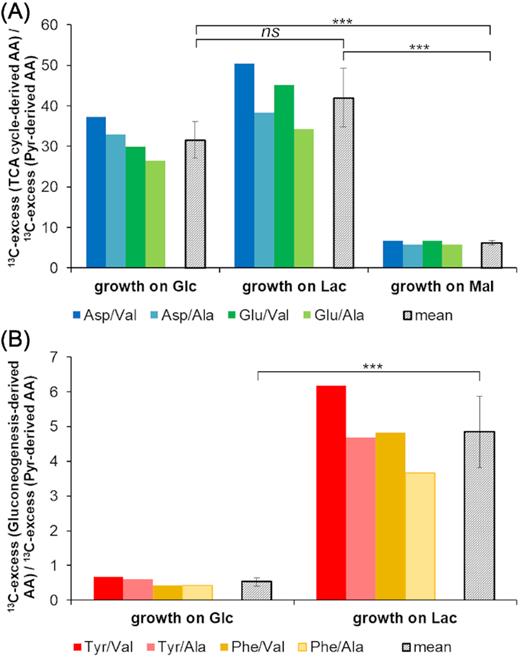
Marker ratios of 13C-excess between selected amino acids. (A) 13C-excess (TCA cycle-derived amino acids)/13C-excess (pyruvate-derived amino acids). The coloured bars depict the ratios of the chosen amino acids in three independent labelling experiments with each of the three substrates, glucose (Glc), lactate (Lac) or malate (Mal). The grey bars show the mean values of 13C-ratios for these fractions. The individual ratios as well as the mean values are significantly higher when an active CO2 fixation is required in the experiments with Glc and Lac compared to a background or random fixation of CO2 in the experiment with Mal. P-values were calculated by Student's t-test (unpaired): P(Glc/Lac) = 0.05031, P(Glc/Mal) = 0.00003, P(Lac/Mal) = 0.00006. (B) 13C-excess (gluconeogenesis-derived amino acids)/13C-excess (pyruvate-derived amino acids). The coloured bars depict the ratios of the chosen amino acids when glucose or lactate were the growth substrates, respectively, and the grey bars show again the mean values of 13C-ratios. P-value was calculated by Student's t-test (unpaired): P(Glc/Lac) = 0.00017 (for detailed calculation, see the excel file F5 m+1 and ratio of label_SI Paper in the Supporting Information).
Incorporation of 13C-carbon from H13CO3− by a natural groundwater community
To test whether this approach can also be used to assign unknown substrates for microbes growing in environmental samples, a proof-of-principle experiment was conducted. Specifically, a natural groundwater microbial community was grown for 124 days in water containing organic fertiliser/soil extract and 1 g/L H13CO3− (Fig. 6A and B). Indeed, significant 13C incorporation was found in the biomass of the harvested bacteria (Fig. 6C).
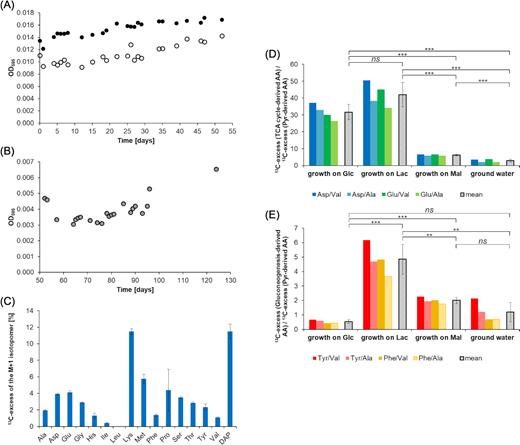
Labelling experiment with a natural groundwater community and H13CO3− as a tracer. (A) Growth curves of the bacterial groundwater communities growing on different concentrations of organic fertiliser. The microorganisms that were supplemented with 30 mL of organic fertiliser are depicted as open circles. The microorganisms that were supplemented with 50 mL of organic fertiliser are depicted as full circles. (B) Growth curve of the combined bacterial groundwater community growing on organic fertiliser and soil extract. (C) 13C-excess of the M+1 isotopomers of specific amino acids produced by H13CO3−-labelling experiments. (D) Marker ratios of 13C-excess between selected amino acids: 13C-excess (TCA cycle-derived amino acids)/13C-excess (pyruvate-derived amino acids). The coloured bars depict the ratios of the chosen amino acids in the labelling experiments. The grey bars show the mean values of 13C-ratios for these fractions. P-values as calculated by Student's t-test (unpaired): P(Glc/Lac) = 0.05031, P(Glc/Mal) = 0.00003, P(Glc/groundwater) = 0.00002, P(Lac/Mal) = 0.00006, P(Lac/groundwater) = 0.00004, P(Mal/groundwater) = 0.00082. (E) Marker ratios of 13C-excess between selected amino acids: 13C-excess (gluconeogenesis-derived amino acids)/13C-excess (pyruvate-derived amino acids). The coloured bars depict the ratios of the chosen amino acids in the labelling experiments and the grey bars show again the mean values of 13C-ratios. P-values as calculated by Student's t-test (unpaired): P(Glc/Lac) = 0.00017, P(Glc/(Mal) = 0.00002, P(Glc/groundwater) = 0.10712, P(Lac/Mal) = 0.00166, P(Lac/groundwater) = 0.00103,P(Mal/groundwater) = 0.06284.
To more specifically assign potential substrates that were used by the microbial community under these conditions, we again analysed amino acids obtained from acidic hydrolysis of the biomass. Overall 13C incorporation and 13C-excess of the M+1 isotopomers were quantified in 16 amino acids. Meso-diaminopimelic acid (DAP, as a component of peptidoglycan) and lysine reached values up to 12% 13C-excess of the M+1 isotopomers (Fig. 6C). These amino acids play important roles in cell wall biosynthesis of bacteria (Born Timothy and Blanchard 1999). DAP is the immediate precursor for lysine (Lysine biosynthesis—Reference pathway 2020), which explained the similar 13C incorporation into these two amino acids. The detected 13C-label of these amino acids showed (i) 13C incorporation via anaplerosis, since DAP and lysine are derived from TCA cycle intermediates and (ii) active cell wall synthesis demonstrating multiplication of the microorganisms under these conditions. Amino acids that are derived from TCA cycle intermediates showed a 13C-excess of the M+1 isotopomers of 3–6%, i.e. Asp (4%), Thr (3%), Met (6%), Glu (4%) and Pro (4%).
To check whether it is possible to reveal the type of organic carbon that has been utilised by the groundwater community, we also calculated the ratios of 13C-excess of the M+1 isotopomers between TCA cycle-derived amino acids and pyruvate-derived amino acids (<10) (Fig. 6D) and the ratios of 13C-excess of the M+1 isotopomers between gluconeogenesis-derived amino acids and pyruvate-derived amino acids (<2) (Fig. 6E). Remarkably, there was a striking similarity between these values and the corresponding values in the model experiments when B. subtilis W23 was grown on malate. Consequently, we hypothesise (also with good statistical significance) that the microorganisms from the groundwater community mainly used organic matter that entered the central carbon metabolism at the stage/level of the TCA cycle, like malate. This result seems reasonable since the utilised organic fertiliser was mostly composed of humic substances, i.e. aromatic compounds, which are degraded to compounds comprising four carbon atoms, such as succinyl-CoA and succinate. These products could then serve as main substrates entering the central carbon metabolism via the TCA cycle such as malate in our model experiment.
DISCUSSION
By means of anaplerotic CO2 fixation, B. subtilis W23 incorporated 13C-labelled bicarbonate to a different extent into its biomass depending on the main organic carbon source being present in the minimal medium (i.e. glucose, lactate or malate, respectively). Indeed, the data from EA-IRMS analyses alone could already show significant differences between the three carbon substrates tested in this study, as illustrated in Fig. 3. Incorporation of H13CO3−/13CO2 to an extent of 6 and 5% into microbial biomass during growth on glucose and lactate, respectively, reflected biomass formation involving anaplerotic carboxylation of pyruvate, which was in some agreement with our simplified scenarios A and B in Fig. 1. Notably, however, in comparison with the glucose experiment, the 13C-abundance of the biomass was lower in the lactate experiment (6 vs 5%). At first glance, this came as a surprise since we expected the same or an even higher 13C-abundance of the bacterial biomass, when lactate was used as the organic substrate. Under lactate conditions, 13C incorporation should also have occurred via13C-labelled oxaloacetate into products derived from intermediates of the TCA cycle as well as into those derived from gluconeogenesis and the pentose phosphate pathway (see scenario B in Fig. 1). The latter routes did not play a major role in the lactate experiment as confirmed by the low levels or the apparent absence of label in His, Ser, Tyr and Phe, respectively. Rather, lactate seemed to be directly channelled via pyruvate and Ser into glycerate-3-phosphate and triose phosphates (Glycine, serine and threonine metabolism 2019) and then serving as unlabelled precursors for glucose formation and the pentose phosphate pathway in our experimental setting (Kleijn et al. 2010). Following this metabolic flux, cell wall sugars and other gluconeogenetic metabolites would not acquire label from H13CO3−/13CO2via13C-oxaloacetate, thus leading to the observed lower 13C incorporation. Interestingly, transcriptional, translational and post-translational down-regulation of anaplerotic reactions might be triggered by the presence of exogenous organic acids in the medium (Schilling et al. 2007; Mirouze et al. 2015). Against the background of lactate, as the only organic carbon source in the medium, it seemed safe to assume that anaplerosis was restrained. Similarly, nicotinamide adenine dinucleotide (NADH) in excess produced by lactate dehydrogenase in the presence of lactate would also down-regulate the TCA cycle and its anaplerotic reactions (Cazzulo and Stoppani 1969). Together, less 13C-carbon is incorporated into gluconeogenetic products and the overall biomass when the bacteria grow on lactate compared to growth on glucose.
The occurrence of the 13C-label in amino acids also clearly assigned pyruvate carboxylase as the H13CO3−/13CO2-binding enzyme in all of our settings including the experiment with malate (for details, see below). The unexpected incorporation of 3% 13C-carbon into microbial biomass during growth on malate suggests that, even under this condition, pyruvate carboxylase was still actively transforming pyruvate to oxaloacetate, even though the organism could have directly refilled the oxaloacetate pool of the TCA cycle by taking excess malate from the growth medium (see scenario C in Fig. 1). Thus, although being characterised as non-essential for B. subtilis W23 in SubtiWiki (Zhu and Stülke 2018), the constantly expressed gene for pyruvate carboxylase implies a permanent activity for this enzyme (Sauer and Eikmanns 2005; Jitrapakdee et al. 2008)—possibly to be able to quickly react when growth conditions change and anaplerosis becomes necessary for survival (Diesterhaft and Freese 1973; Chubukov et al. 2013). Interestingly, metabolic activity of pyruvate carboxylase could also be detected during the stationary growth phase of B. subtilis W23 irrespective of the main organic substrate being used from the medium (Fig. 2C; Figures S2C and S3C, Supporting Information). This also indicates the important role of the constantly present enzyme pyruvate carboxylase in the metabolism of B. subtilis W23.
The reverse reaction of the glycine cleavage system could have afforded [1–13C]Gly, which then serves as the precursor for Ser biosynthesis yielding [1–13C]Ser without the requirement of an active pyruvate carboxylase (Kikuchi et al. 2008; Glycine, serine and threonine metabolism 2019). Alternatively, [1–13C]Gly could be formed by cleavage of 2-aminoacetoacetate (obtained from Thr) whereby C-1 and C-2 of Thr are transformed into C-1 and C-2 of Gly, respectively. Thus, via this route the detected (low) label at C-1 of Thr is transferred to C-1 of Gly. Now, one could speculate that these alternative pathways should be active under all the experimental set-ups and, consequently, the same 13C-excess of the respective M+1 isotopomers of Gly and Ser should have resulted in all three cases. This is not true (Fig. 4) and, therefore, the detected differences in 13C incorporation indicate that a significant fraction of Ser and Gly was synthesised via [1–13C]-PEP. However, we cannot exclude that different Gly biosynthesis pathways are used by B. subtilis W23 when growing on different organic substrates.
![Metabolic network observed for B. subtilis W23 growing in M9 medium containing H13CO3− as a tracer. The full red circles mark the location of the 13C-carbon atom detected in amino acids. On this basis, the labelling profiles of their respective precursors were reconstructed. The equilibrium between the reactions of the reductive branch of the TCA cycle could transfer the 13C-label from oxaloacetate to malate, fumarate and succinate. The intrinsic symmetry of fumarate leads to the formation of a 0.5:0.5 mixture of [1–13C]- and [4–13C]malate, and [1–13C]- and [4–13C]oxaloacetate, respectively. This is indicated by the red half circles.](https://oup.silverchair-cdn.com/oup/backfile/Content_public/Journal/femsec/96/6/10.1093_femsec_fiaa080/1/m_fiaa080fig7.jpeg?Expires=1750187155&Signature=OY0HM3qWLkZdQV9d7uccAZdWZhulc4hI2dXWo3bUgy7ZrX2NeBYokwcAK7Kxs4RoNVEfB7GhRJC0k-uDSk2Nrjd5THKydaAj9e2SI3C81vJPTRBR6bPurOdSKQPmWJV7b69rDjgW~01VXmlhhfwGLjGJk8lvERKjE8iwc03EESaLc~kMMyP31sxkcviV~~EsFozf55JEuCsMCU0wYBGaJMrYmfF6QTbMbEv4DD9Qjs7yNK1QmbKPEoWiztc9a9RwH3omWckn-wEeZpgn1TUqAmMpgzd77IeE9Pw9Qujg8f6gDUpUnfaLrl5pgcrPAEATVfeRO5YXFlgCpYbKi7OI5Q__&Key-Pair-Id=APKAIE5G5CRDK6RD3PGA)
Metabolic network observed for B. subtilis W23 growing in M9 medium containing H13CO3− as a tracer. The full red circles mark the location of the 13C-carbon atom detected in amino acids. On this basis, the labelling profiles of their respective precursors were reconstructed. The equilibrium between the reactions of the reductive branch of the TCA cycle could transfer the 13C-label from oxaloacetate to malate, fumarate and succinate. The intrinsic symmetry of fumarate leads to the formation of a 0.5:0.5 mixture of [1–13C]- and [4–13C]malate, and [1–13C]- and [4–13C]oxaloacetate, respectively. This is indicated by the red half circles.
In summary, our experiments using H13CO3− as a tracer and B. subtilis W23 as a model organism, as well as our proof-of-principle experiment with a natural groundwater community, therefore provide solid evidence that EA-IRMS analysis of the biomass in conjunction with GC-MS analysis of protein- and cell wall-derived amino acids (i) reflect the core functional metabolic networks of the organism(s) under study and (ii) can identify the type of the main organic carbon substrate or at least the substrate family being used by the heterotrophic organism or organisms under study.
The general validity of this hypothesis is supported by the fact that almost all heterotrophs need to refill the TCA cycle by anaplerotic CO2 fixation. For this purpose, heterotrophs use either pyruvate carboxylase that is highly conserved and found in a great variety of organisms, including prokaryotes, archaea, yeasts, fungi and higher organisms (e.g. mammals) or PEP carboxylase, which is also widely distributed in bacteria (Attwood 1995; Jitrapakdee and Wallace 1999; Sauer and Eikmanns 2005; Jitrapakdee et al. 2008). PEP carboxylase serves as another anaplerotic enzyme that catalyses the reaction from PEP to oxaloacetate via the addition of bicarbonate. Presumably, this results in the same labelling patterns when starting from H13CO3− in comparison to organisms using the pyruvate carboxylase. Thus, labelling experiments using H13CO3− as a tracer bear high potential to generally assign the type of microbial DOC utilisation under various conditions.
FUNDING
This work was funded by the Helmholtz Association and in part (to WE) by grants from the Hans-Fischer-Gesellschaft (Munich, Germany) and the Deutsche Forschungsgemeinschaft DFG (Bonn, Germany) (TRR235).
ACKNOWLEDGEMENTS
We thank Ellen Röhm (Geomicrobiology—University of Tübingen) for performing the HPLC measurements and Ramona Brejcha (Institute of Groundwater Ecology, Helmholtz Zentrum München) and Martina Daubmeier (Institute of Groundwater Ecology, Helmholtz Zentrum München) for supporting us in the acquisition of the elemental analyser-isotope ratio mass spectrometer analyses of the bacterial cell pellets.
Conflict of interest
None declared.
