


ABSTRACT
The plant microbiota may differ depending on soil type, but these microbiota probably share the same functions necessary for holobiont fitness. Thus, we tested the hypothesis that phytostimulatory microbial functional groups are likely to co-occur in the rhizosphere, using groups corresponding to nitrogen fixation (nifH) and 1-aminocyclopropane-1-carboxylate deamination (acdS), i.e. two key modes of action in plant-beneficial rhizobacteria. The analysis of three maize fields in two consecutive years showed that quantitative PCR numbers of nifH and of acdS alleles differed according to field site, but a positive correlation was found overall when comparing nifH and acdS numbers. Metabarcoding analyses in the second year indicated that the diversity level of acdS but not nifH rhizobacteria in the rhizosphere differed across fields. Furthermore, between-class analysis showed that the three sites differed from one another based on nifH or acdS sequence data (or rrs data), and the bacterial genera contributing most to field differentiation were not the same for the three bacterial groups. However, co-inertia analysis indicated that the genetic structures of both functional groups and of the whole bacterial community were similar across the three fields. Therefore, results point to co-selection of rhizobacteria harboring nitrogen fixation and/or 1-aminocyclopropane-1-carboxylate deamination abilities.
INTRODUCTION
Plant Growth-Promoting Rhizobacteria (PGPR) colonize plant roots and implement a range of plant-beneficial traits, which may result in enhanced plant development, nutrition, health and/or stress tolerance (Vacheron et al. 2013; Almario et al. 2014b; Gamalero and Glick 2015; Cormier et al. 2016; Hartman et al. 2018). As a consequence, PGPR strains have received extensive attention for use as microbial inoculants of crops (Couillerot et al. 2013; Bashan et al. 2014).
Plant-beneficial effects exhibited by PGPR are underpinned by a wide range of modes of actions, which include (i) enhanced nutrient availability via associative nitrogen fixation (Puri, Padda and Chanway 2016, Deynze et al. 2018) or phosphate solubilization (Arruda et al. 2013), (ii) stimulation of root system establishment through phytohormone synthesis (Cassán, Vanderleyden and Spaepen 2014) or consumption of the ethylene precursor 1-aminocyclopropane-1-carboxylate (ACC) via an enzymatic deamination (Glick 2014) and (iii) the induction of systemic resistance responses in plant (Pieterse and Van Wees 2015). In addition to phytostimulation, certain PGPR may also achieve inhibition of phytoparasites using antimicrobial secondary metabolites (Agaras et al. 2015) or lytic enzymes (Pieterse and Van Wees 2015). Often, PGPR strains display more than one phytostimulatory mode of action, which is considered important for effective plant-beneficial effects (Bashan and de-Bashan 2010; Rana et al. 2011; Bruto et al. 2014b; Vacheron et al. 2017). Therefore, the co-occurrence of multiple phytostimulation traits is likely to have been subjected to positive evolutionary selection in PGPR populations to maximize success of the plant-PGPR cooperation. This hypothesis is substantiated by genome sequence analysis of many prominent PGPR strains from contrasted taxa (Chen et al. 2007; Bertalan et al. 2009; Wisniewski-Dyé et al. 2012; Redondo-Nieto et al. 2013).
Even though PGPR strains tend to accumulate several plant-beneficial traits (Bruto et al. 2014b), the co-occurrence patterns of these traits are not random. This takes place in part because many past horizontal gene transfers of the corresponding genes were ancient (Frapolli et al. 2012), often leading to clade-specific profiles of plant-beneficial traits (Bruto et al. 2014b). However, the analysis of 304 proteobacterial genomes from contrasted taxa evidenced, overall, the co-occurrence of nifHDK (nitrogen fixation) and acdS (ACC deamination) based on Exact-Fisher pairwise tests (Bruto et al. 2014b), raising the possibility that nitrogen fixation and ACC deamination might be useful traits when combined in a bacterium. Indeed, nitrogen fixation and ACC deamination occur together in various rhizobacteria (Ma, Guinel, and Glick 2003; Blaha et al. 2006; Nukui et al. 2006; Duan et al. 2009; Jha, Gontia and Hartmann 2012), but the relation between both traits can be complex. In Azospirillum lipoferum 4B for instance, the plasmid-borne gene acdS is eliminated during phase variation while nif genes are maintained (Prigent-Combaret et al. 2008) and in Mesorhizobium loti transcription of acdS is controlled by the nitrogen fixation regulator gene nifA2 (Nukui et al. 2006). Moreover, ACC deamination was described as facilitator of the legume-rhizobia symbiosis (Ma et al. 2003; Nascimento et al. 2012).
At the scale of an individual plant, the rhizosphere is colonized by a diversified range of bacteria, including nifH acdS bacteria as well as bacteria harboring only nifH or acdS (Blaha et al. 2006; Bouffaud et al. 2018). There is additional level of complexity in that many of these bacteria are PGPR, but some of them are not (Bruto et al. 2014b). However, the overall impact of nitrogen fixation and ACC deamination on the plant is likely to be the sum of the contribution of individual root-colonizing bacteria displaying these traits. This raises the question whether there is, for the plant, an optimal balance between the functional microbial groups of nifH rhizobacteria and acdS rhizobacteria in the rhizosphere. On this basis, we tested here the hypothesis that rhizobacteria with either nitrogen fixation ability or ACC deamination ability (or with both) co-occur on roots. For that purpose, we used three maize fields under reduced nitrogen fertilization practices, with samplings carried out at 6-leaf and flowering stages during two consecutive years and numbers of nifH and acdS rhizobacteria were monitored by quantitative PCR. In addition, nifH and acdS rhizobacteria were assessed by metabarcoding (MiSeq Illumina sequencing) of nifH and acdS genes at one sampling, in parallel to sequencing of 16S rRNA genes for the whole rhizobacterial community.
MATERIALS AND METHODS
Field experiment
The experiment was conducted in 2014 and 2015 at field sites located in Chatonnay (L), Sérézin-de-la-Tour (FC) and Saint Savin (C), near the town of Bourgoin–Jallieu (Isère, France). According to the FAO soil reference base, L field corresponds to a luvisol, FC a fluvic cambisol and C a calcisol (Table 1). The trial set-up has been described in Rozier et al. (2017).
Field characteristics of the top (5–30 cm) soil layer.
| Texture (%) | pH | Organic C | Total N | Cation exchange (cmol/kg) | |||||||||
|---|---|---|---|---|---|---|---|---|---|---|---|---|---|
| Field | Soil type | Sand | Silt | Clay | H2O | KCl | (g/kg) | (g/kg) | C/N ratio | CECa | Ca2+ | Mg2+ | K+ |
| FC | Fluvic cambisol | 26.9 | 38.3 | 34.7 | 7.1 | 6.3 | 31.6 | 3.4 | 9.3 | 22.8 | 21.2 | 0.67 | 0.38 |
| L | Luvisol | 42.9 | 42.9 | 14.2 | 7.3 | 6.7 | 21.5 | 1.6 | 13.4 | 93.0 | 10.5 | 0.33 | 0.43 |
| C | Calcisol | 15.6 | 74.1 | 10.3 | 8.2 | 7.7 | 25.9 | 3.1 | 8.4 | 97.0 | 36.1 | 0.24 | 0.29 |
CEC, cation exchange capacity.
For each of the fields, the crop rotation consists in one year wheat, six years maize and one year rapeseed and wheat was grown the year before the 2014 experiment. The maize sowing season ranges from middle April to middle May in the area. Maize seeds (Zea mays ‘Seiddi’; Dauphinoise Company, France) were sown on April 18 (FC) and 23 (C and L) in 2014 and April 30 (C) and May 11 (FC and L) in 2015. Five replicate plots, which were 12 (FC and C) or 8 (L) maize rows wide and 12 m long, were defined in each field. The fields were undergoing a reduction in chemical fertilization usage and did not receive any nitrogen fertilizers in 2014 and 2015. Only non-inoculated plots from the overall trial (Rozier et al. 2017) were used.
Plant sampling
In 2014 and 2015, plants were sampled at six leaves and at flowering. In 2014, the first sampling was done on May 25 (FC) and 26 (C and L). On each replicate plot, six plants were chosen randomly, the entire root system was dug up and shaken vigorously to dislodge soil loosely adhering to the roots. At sites FC and C, one pooled sample of six roots system was obtained per plot, i.e. a total of five pooled samples per field site. At site L, each of the six roots system was treated individually to obtain 30 samples. The second sampling was done on July 8 (FC and C) and 9 (L), on all five plots. Six plants were sampled per plot and treated individually to obtain 30 samples per field site.
In 2015, the first sampling was done on May 27 (C), June 5 (FC) and June 8 (L). In each replicate plot, four root systems were sampled and treated individually to obtain 20 samples per field site. The second sampling was done on July 15 (C), 16 (FC) and 17 (L), and four root systems were sampled and treated individually to obtain 20 samples per field site.
Each sample was immediately flash-frozen on site, in liquid nitrogen and lyophilized back at the laboratory (at −50°C for 24 h). Roots and their adhering soil were separated and the latter stored at −80°C.
DNA extraction from root-adhering soil
DNA from root-adhering soil was extracted with the FastDNA SPIN kit (BIO 101 Inc., Carlsbad, CA). To this end, 500 mg (for the pooled samples from FC and C in 2014) or 300 mg samples (for all other samples) were transferred in Lysing Matrix E tubes from the kit and 5 µl of the internal standard APA9 (109 copies ml−1) was added to each Lysing Matrix E tube to normalize DNA extraction efficiencies between rhizosphere samples, as described (Park and Crowley,2005; Couillerot et al.2010). This internal standard APA9 (i.e. vector pUC19 with cassava virus insert; GenBank accession number AJ427910) requires primers AV1f (CACCATGTCGAAGCGACCAGGAGATATCATC) and AV1r (TTTCGATTTGTGACGTGGACAGTGGGGGC). After 1 h incubation at 4°C, DNA was extracted and eluted in 50 µl of sterile ultra-pure water, according to the manufacturer's instructions. DNA concentrations were assessed by Picogreen (ThermoFisher).
Size of microbial functional groups
The amounts of nifH genes were estimated by quantitative PCR based on the primers polF/polR (Poly, Jocteur Monrozier, and Bally 2001), as described by Bouffaud et al. (2016). The reaction was carried out in 20 µl containing 4 μl of PCR-grade water, 1 μl of each primer (final concentration 0.50 μM), 10 μl of LightCycler-DNA Master SYBR Green I master mix (Roche Applied Science, Meylan, France) and 2 µl of sample DNA (10 μg). The cycling program included 10 min incubation at 95°C, followed by 50 cycles of 95°C for 15 s, 64°C for 15 s and 72°C for 10 s. Melting curve calculation and Tm determination were performed using the Tm Calling Analysis module of Light-Cycler Software v.1.5 (Roche Applied Science).
The amount of acdS genes was estimated by quantitative PCR based on the primers acdSF5/acdSR8 (Bouffaud et al. 2018). The reaction was carried out in 20 µl containing 4 μl of PCR grade water, 1 μl of each primer (final concentration 1 μM), 10 μl of LightCycler-DNA Master SYBR Green I master mix (Roche Applied Science) and 2 µl of sample DNA (10 μg). The cycling program included 10 min incubation at 95°C, followed by 50 cycles of 94°C for 15 s, 67°C for 15 s and 72°C for 10 s. The fusion program for melting curve analysis is described above.
Real-time PCR quantification data were converted to gene copy number per gram of lyophilized root-adhering soil, as described (Bouffaud et al. 2016; Bouffaud et al. 2018).
nifH, acdS and rrs sequencing from rhizosphere DNA
Sequencing was performed on 2015’ samples taken when maize reached six leaves. Each sample was an equimolar composite sample of four DNA extracts obtained from root-adherent soil, resulting in five samples per field site, i.e. a total of 15 samples. DNA extracts were sent to MR DNA laboratory (www.mrdnalab.com; Shallowater, TX) for sequencing.
For nifH and acdS sequencing, PCR primers were the same ones used for quantitative PCR (i.e. polF/polR for nifH and acdSF5/acdSR8 for acdS). For rrs sequencing, PCR primers 515/806 were chosen for the V4 variable region of the 16S rRNA gene. For all three genes, the forward primer carried a barcode. Primers were used in a 30-cycle PCR (five cycles implemented on PCR products), using the HotStarTaq Plus Master Mix Kit (Qiagen, Valencia, CA) under the following conditions: 94°C for 3 min, followed by 28 cycles of 94°C for 30 s, 53°C for 40 s and 72°C for 1 min, with a final elongation step at 72°C for 5 min. PCR products were checked in 2% agarose gel to determine amplification success and relative band intensity. Multiple samples were pooled together in equal proportions based on their molecular weight and DNA concentrations. Pooled samples were purified using calibrated Ampure XP beads and used to prepare a DNA library following Illumina TruSeq DNA library preparation protocol. Sequencing was performed on a MiSeq following the manufacturer's guidelines.
Sequence data were processed using the analysis pipeline of MR DNA. Briefly, sequences were depleted of barcodes, sequences < 150 bp or with ambiguous base calls removed, the remaining sequences denoised, operational taxonomic units (OTUs; defined at 3% divergence threshold for the three genes) generated and chimeras removed. Final OTUs were taxonomically classified using BLASTn against a curated database derived from Greengenes (DeSantis et al. 2006), RDPII (http://rdp.cme.msu.edu) and NCBI (www.ncbi.nlm.nih.gov). Final OTUs of the acdS sequencing were classified using an in-house curated acdS database, obtained after curation of acdS homolog genes from the FunGene acdS 8.3 database, as described by Bouffaud et al. (2018). Diversity indices of Shannon (H) and Simpson (1-D) were calculated using sequencing subsample data for which each sample had the same number of sequences.
An acdS phylogenetic tree (based on maximum-likelihood method) was computed using acdS sequences from 10 arbitrarily chosen OTUs per genus recovered in our sequencing data and from one reference taxa for each genus and related D-cystein desulfhydrase genes D-cystein desulfhydrase genes from strains Escherichia coli strains K-12, ER3413, 042 and RM9387, Escherichia albertii KF1, Escherichia fergusonii ATCC 35 469, Enterobacter sacchari SP1, Enterobacter cloacae ECNIH2, Enterobacter asburiae L1, Enterobacter sp. 638 and Enterobacter lignolyticus SCF1 (used as out-group).
Statistical analysis
Statistical analysis of quantitative PCR data was carried out by ANOVA and Fishers’ LSD tests. For each gene sequenced, comparison of bacterial diversity between field sites was carried out by between-class analysis (BCA) using ADE4 (Chessel, Dufour and Thioulouse 2004; Culhane et al. 2005; Dray, Dufour and Chessel 2007) and ggplot2 packages for R, and the 12 genera contributing most to field site differentiation were identified. To assess co-trends between nifH and acdS variables, as well as between rrs and nifH or acdS variables, sequence data were also assessed using co-inertia analysis (CIA) (Dray, Chessel and Thioulouse 2003; Dray, Dufour and Chessel 2007), which was computed with the ADE4 package in the R statistical software environment (Culhane et al. 2005). CIA is a dimensional reduction procedure designed to measure the similarity of two sets of variables, here the proportions of nifH and acdS bacterial genera obtained during between-class analyses. Its significance was assessed using Monte-Carlo tests with 10 000 permutations. Unless otherwise stated, statistical analyses were performed using R v3.1.3 (Team 2014), at P < 0.05 level.
Nucleotide sequence accession numbers
Illumina MiSeq paired-end reads have been deposited in the European Bioinformatics Institute (EBI) database under accession numbers PRJEB14347 (ERP015984) for rrs; PRJEB14346 (ERP015983) for nifH, PRJEB14343 (ERP015981) for acdS.
RESULTS
Relation between numbers of nifH and acdS alleles in the three field sites
The number of acdS bacteria in the rhizosphere of maize harvested at six-leaf stage in 2014 (7.87 to 17.4 × 10⁷acdS gene copies g−1 of dry soil) and 2015 (1.76 to 2.81 × 10⁷acdS gene copies g−1 of dry soil) did not differ significantly between field sites (Fig. 1A, B). At flowering stage, however, the number of acdS bacteria differed from one site to the next, both in 2014 and in 2015 (Fig. 1E, F). At that growth stage, the lowest rhizosphere abundance was observed in site L (5.08 × 10⁷acdS gene copies g−1 of dry soil) and the highest in site C (1.76 × 10⁸acdS gene copies g−1 of dry soil) in 2014, whereas site ranking was the opposite in 2015 (8.35 versus 44.0 × 10⁶acdS gene copies g−1 of dry soil for sites C and L, respectively).
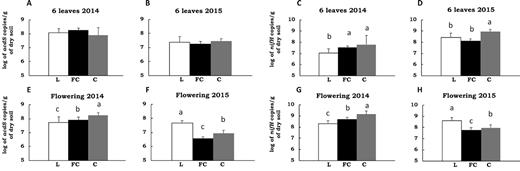
Size of the acdS and nifH functional groups compared in the three field sites L, FC and C over four sampling times. Means and standard deviations are shown for the acdS group at six leaves in 2014 (A), and 2015 (B), and at flowering in 2014 (E), and 2015 (F), and for the nifH group at 6 leaves in 2014 (C), and 2015 (D), and at flowering in 2014 (G), and 2015 (H). The analysis was done using pooled samples of six roots systems (n = 5) at FC and C and individual root systems (n = 30) at L in 2014, and individual root systems (n = 20) at all three sites in 2015. Statistical differences between sites are indicated by letters a-c (ANOVA and Fischer's LSD tests, P < 0.05).
The numbers of nifH rhizobacteria differed according to field site (Fig. 1C, D, G, H). In 2014, the lowest nifH abundance was observed in rhizospheres of site L (1.06 and 20.8 × 10⁷nifH gene copies g−1 of dry soil at respectively six leaves and flowering) and the highest in those of site C (6.43 and 147.0 × 10⁷nifH gene copies g−1 of dry soil at respectively six leaves and flowering) (Fig. 1C, G). In 2015, the numbers of nifH rhizobacteria was higher in site C (9.31 × 10⁸nifH gene copies g−1 of dry soil) than in FC (1.30 × 10⁸nifH gene copies g−1 of dry soil) and L (2.52 × 10⁸nifH gene copies g−1 of dry soil) at six leaves, whereas the situation was opposite at flowering, with higher abundance in site L (40.7 × 10⁷nifH gene copies g−1 of dry soil) than C (9.81 × 10⁷nifH gene copies g−1 of dry soil) and FC (5.66 × 10⁷nifH gene copies g−1 of dry soil) (Fig. 1D, H).
When comparing the log numbers of nifH rhizobacteria and acdS rhizobacteria across the 12 site × sampling combinations, significant (3.8 × 10⁻⁵ < P < 0.01) positive correlations (0.67 < r < 0.98, n = 20) were found in 9 of 12 cases, with only three correlations that were not significant, i.e. in site C at six-leaf stage in 2014 (P = 0.10, n = 5) and FC at flowering in 2014 (P = 0.67, n = 5) and 2015 (P = 0.19, n = 20) (Fig. 2). In summary, moderate but significant differences in the numbers of nifH and/or acdS rhizobacteria could take place according to field site, sampling year and/or maize phenology and in most cases a positive correlation was found between the log values of both numbers.
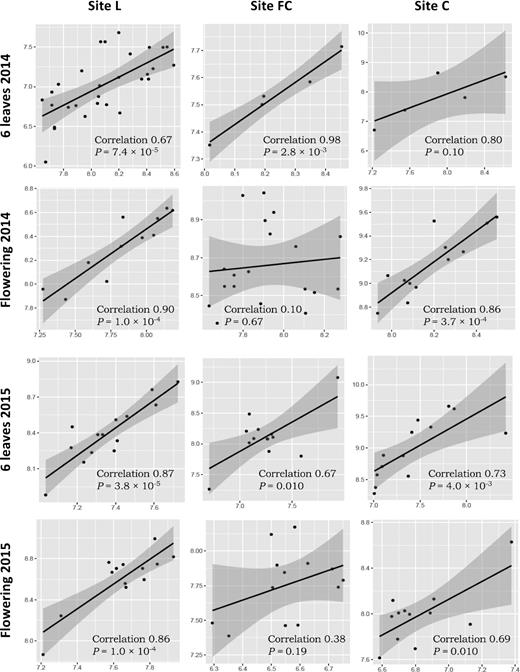
Correlation between log numbers of nifH (X axis) and acdS genes (Y axis). Correlation was established using the Pearson coefficient. The analysis was done using pooled samples of six roots systems (n = 5) at FC and C and individual root systems (n = 30) at L in 2014, and individual root systems (n = 20) at all three sites in 2015.
Relation between diversities of nifH and acdS alleles in the three field sites
Illumina MiSeq sequencing of nifH and acdS (as well as rrs) was carried out on 15 rhizosphere samples from 6-leaf maize grown in 2015. For nifH, 1342 966 reads were obtained (10 775 to 62 752 sequences per sample), for a total of 36 241 OTUs. Rarefaction analysis showed that curves reached a plateau (Fig. S1A, Supporting Information). Subsampling was done with 10 775 sequences per sample, for a total of 34 459 OTUs. For acdS, 5490 230 reads were obtained (68 376 to 139 245 sequences per sample), with a total of 32 468 OTUs. Rarefaction curves reached a plateau (Fig. S1B). Subsampling was done with 68,376 sequences per sample, for a total of 26,246 OTUs. After quality filtering, 6082,255 reads were obtained for rrs (51 696 to 223 926 sequences per sample), giving a total of 39 600 OTUs (3% cut-off). Rarefaction analysis showed that the sequencing effort captured most of the diversity with curves reaching a plateau (Fig. S1C, Supporting Information). Subsampling was done with 51 696 sequences per sample, for a total of 25 437 OTUs.
The effect of field site on nifH diversity of diazotrophic bacteria was not significant based on analysis of Shannon and Simpson indices. Conversely, the effect of field site on acdS diversity of ACC deaminase bacteria was significant based on the Shannon (P = 1.9 × 10⁻⁴) and Simpson indices (P = 8.6 × 10⁻⁴). The Shannon index was lower in FC (6.32) than in L (6.82) and C (6.92), whereas the Simpson index was higher in FC (6.42 × 10⁻³) than in L (2.88 × 10⁻³) and C (2.38 × 10⁻³). The effect of field site on rrs diversity of the total bacterial community was significant based on the Shannon (P = 1.8 × 10⁻⁵) and Simpson indices (P = 1.6 × 10⁻⁴). As in the case of acdS data, the Shannon index was lower in FC (7.20) than in L (7.41) and C (7.71), whereas the Simpson index was higher in FC (3.42 × 10⁻³) than in L (2.28 × 10⁻³) and C (1.40 × 10⁻³).
The correlation (n = 5) between nifH diversity and acdS diversity was positive and significant at site L, when considering both the Shannon index (r = 0.98; P = 0.01; Fig. 3) and the Simpson index (r = 0.86; P = 0.06; Fig. 3). However, the correlation was not significant at the other two sites, regardless of the diversity index. When considering also rrs diversity, a significant correlation was found only with nifH diversity at site C (r = 0.91; P = 0.03; Fig. 3). In summary, there was no relation between the diversities of nifH rhizobacteria and acdS rhizobacteria, based on comparison of diversity indices in the three field sites and correlation analyses at two of the three field sites.
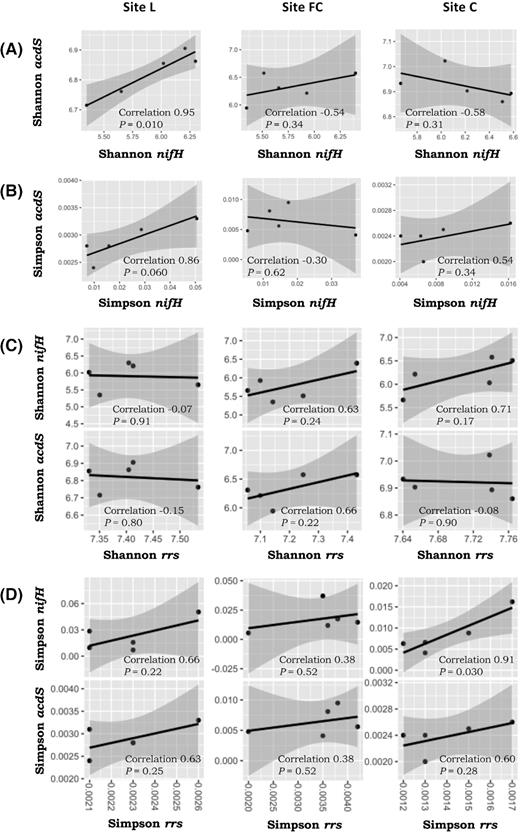
Correlation between Shannon diversity indices of nifH and acdS(A), Simpson diversity indices of nifH and acdS(B), Shannon diversity indices of rrs and acdS or nifH(C) and Simpson diversity indices of rrs and acdS or nifH(D). Correlation was established separately at each of the three field sites L, FC and C, using the Pearson coefficient (n = 5).
Relation between prevalence of nifH and/or acdS rhizobacterial taxa in the three field sites
BCA of nifH data showed that the composition of diazotrophic bacteria differed according to field site (Fig. 4A). The first axis (54% of between-class variability) distinguished site C from FC and L, and the 12 genera contributing most to this differentiation were Xanthobacter, Dechloromonas, Methyloferula, Ideonella, Nitrospirillum and Tolumonas (more prevalent in C than in L and FC), as well as Desulfovibrio, Selenomonas, Ruminiclostridium, Paludibacter, Gloeocapsopsis and Ruminococcus (less prevalent in C than in FC and L). The second axis (46% of between-class variability) distinguished site L from the two other sites, and the 12 genera contributing most to this differentiation included Rhizobium, Gluconacetobacter, Skermanella, Leptothrix, Streptomyces and Methylocapsa (more prevalent in L than in FC and C), as well as Marichromatium, Pelobacter, Gordonibacter, Desulfobulbus, Desulfovibrio and Sideroxydan (less prevalent in L than in C and FC).
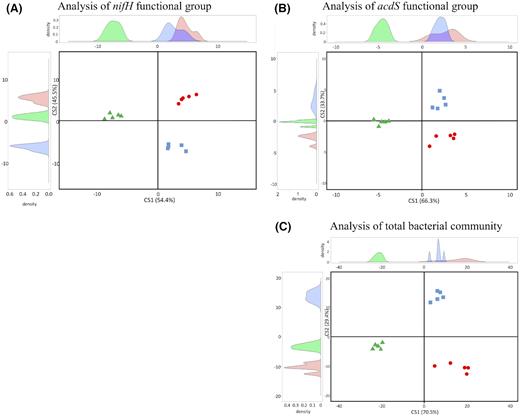
Comparison of nifH(A), acdS(B), and rrs(C), diversity between sites L, FC and C by between-class analysis. Red circles, green triangles and blue squares are used for samples from sites FC, C and L, respectively. The curves at the top and the left of the panels show the distribution of samples on respectively the X and Y axes.
BCA of acdS data showed that the composition of ACC deaminase bacteria differed according to field site (Fig. 4B). The first axis (66% of between-class variability) distinguished site C from FC and L, and the 12 genera contributing most to this differentiation were Achromobacter, Azospirillum, Pseudolabrys, Roseovarius, one unassigned OTU and Polaromonas (more prevalent in C than in L and FC), as well as Cupriavidus, Burkholderia, Bosea, Bradyrhizobium and Methylobacterium (less prevalent in C than in FC and L). The second axis (34% of between-class variability) distinguished each of the three sites from one another, and the 12 genera contributing most to this differentiation included Azorhizobium, Pseudomonas, Gluconobacter, Collimonas, Herbaspirillum and Burkholderia (more prevalent in FC than in C and L), as well as Ralstonia, Loktanella, Devosia, Variovorax, Novosphingobium and Chelatococcus (more prevalent in L than in C and FC).
BCA of rrs data showed that the composition of the total bacterial community differed according to field site (Fig. 4C). The first axis (71% of between-class variability) distinguished C from the two other sites, and the 12 genera contributing most to this differentiation were Algisphaera, Fibrobacter, Amaricoccus, Hirschia, Desulfacinum and Saccharophagus (more prevalent in C than in L and FC), as well as Actinomadura, Lutispora, Bacillus, Rhodopseudomonas, Kouleothrix and Roseiflexus (less prevalent in C than in FC and L). The second axis (29% of between-class variability) distinguished site L from FC and C, and the 12 genera contributing most to this differentiation included Flavobacterium, Gluconobacter, Maricaulis, Prolixibacter, ‘Candidatus Xiphinematobacter’, Chthoniobacter (more prevalent in FC than L), as well as Conexibacter, Hyphomicrobium, Pseudonocardia, Tumebacillus, Chelatococcus and Mycobacterium (less prevalent in FC than in L).
In summary, between-class analysis of nifH and acdS data indicated that the composition of diazotrophic bacteria and of ACC deaminase bacteria differed according to field site, but the main discriminant genera differed completely for both types of bacteria. In both cases, the discriminant taxa were also different from the main range of bacterial taxa distinguishing the three sites most when comparing the latter based on rrs data, at the scale of the entire rhizobacterial community.
Relation between the genetic structures of nifH and acdS rhizobacteria in the three field sites
Since there was a positive correlation between log numbers of nifH and/or acdS rhizobacteria but the corresponding bacterial genera discriminating most between the three fields studied were not the same, the co-structuration between nifH and acdS diversity was explored by co-inertia analysis to compare more globally the genetic structures of these rhizobacterial groups across the three field sites. Monte-Carlo permutation tests showed a significant co-structuration (P = 9 × 10⁻⁵) of nifH and acdS rhizobacteria, with a RV coefficient of 0.83. This accounted for 57% of data variability. The plot of the co-inertia matrix illustrates the strength of the relationship between acdS and nifH diversities, as superposition of acdS and nifH groups showed a strong co-trend in all three field sites (Fig. 5).
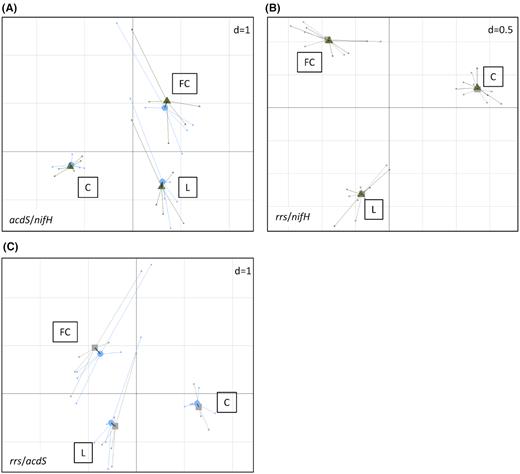
Co-inertia analysis between acdS and nifH diversities (A), rrs and nifH diversities (B), and rrs and acdS diversities (C). Projection of the samples (n = 5) is based on both acdS (Blue) and nifH (Green), rrs (Grey) and nifH (Green), or rrs (Grey) and acdS (Blue) diversity variables (level = genus) into a same factorial plan. The vector in black shows the strength of co-trends between the two barycenters of variables as related to each site (L, FC, C). Shorter vectors indicate stronger convergent trends between the two variable groups.
Co-inertia analyses of nifH and acdS diversities were also performed with rrs diversity, and permutations tests also showed co-structuration in both cases, with respectively RV coefficients of 0.89 and 0.91, the two axes explaining 52% and 69% of variability. Superposition of rrs community with acdS and with nifH groups indicated a strong co-trend across the three fields.
In summary, the genetic structures of nifH and acdS rhizobacterial groups across the three field sites were very close. Co-inertia was strong also when comparing each with the whole rhizobacterial community based on rrs data.
DISCUSSION
The current work made use of molecular tools available to characterize functional groups of nifH and acdS bacteria. Quantification of nifH rhizobacteria was performed with primers PolF/PolR (Poly, Jocteur Monrozier and Bally 2001) rather than other well-established primers such as Zf/Zr (Zehr and McReynolds 1989) since the latter are not effective for quantitative PCR (Poly, Jocteur Monrozier and Bally 2001; Boyd and Peters 2013; Gaby and Buckley 2017). The same primers have also been used for sequencing, both for consistency and efficacy for diazotroph characterization (Wartiainen et al. 2008; Mårtensson et al. 2009). Recently, acdS primers suitable for monitoring of ACC deamination bacteria have been made available (Bouffaud et al. 2018). These primers are effective to amplify true acdS genes while not amplifying related D-cystein desulfhydrase genes coding for other PLP-dependent enzymes, which was verified again in the current work (Fig. S2, Supporting Information). Indeed, phylogenetic analysis of the acdS sequences showed that none clustered within the out-group (built with strains harboring D-cystein desulfhydrase genes), confirming that the sequences obtained were true acdS sequences, as highlighted in previous studies (Blaha et al. 2006; Nascimento et al. 2012; Li et al. 2015; Bouffaud et al. 2018).
The level of taxonomic information carried by nifH sequences has been described in the literature, showing that nifH was sufficiently conserved to enable reliable taxonomic affiliations including for the assessment of rhizobacteria (Vinuesa et al. 2005), and its phylogeny was congruent with the one derived from rrs (Achouak, Normand and Heulin 1999; Zehr et al. 2003). As for acdS, phylogenetic analysis of the new sequences obtained (along with reference acdS sequences) confirmed that the taxonomic affiliations made at the genus level were correct. However, the 130-bp acdS amplicons obtained with the current quantitative PCR primers do not enable any taxonomic affiliation below the genus level, i.e. at the species level (Bouffaud et al. 2018).
In this work, the hypothesis that nifH and acdS rhizobacterial populations co-occur on roots was assessed with maize taken from three fields, using quantitative PCR and MiSeq sequencing. The results that were obtained did substantiate this hypothesis, based on (i) positive correlations between the sizes of nifH and acdS rhizobacterial groups and (ii) comparable genetic structures indicated by inertia analysis for both functional groups across the three field sites studied. Several studies have assessed the co-occurrence of particular microorganisms and measured between-taxa correlations in soil systems (Freilich et al. 2010; Barberán et al. 2011), but few have done so at the level of functional groups. For instance, co-occurrence analysis of nitrite-dependent anaerobic ammonium oxidizers and methane oxidizers in paddy soil showed that the structure of these communities changed with soil depth (Wang et al. 2012). The co-occurrence of plant-beneficial functions in the rhizosphere has been investigated, but often the assessment was restrained to narrow taxonomic levels, such as within the Pseudomonas genus (Frapolli et al. 2012; Almario et al. 2014b; Vacheron et al. 2016). It is interesting to note that not all microorganisms harboring acdS and/or nifH expressed the corresponding functions in rhizosphere based on assessment of qRT-PCR data, as previously described for nifH (Bouffaud et al. 2016) or acdS (Bouffaud et al. 2018).
Specific taxa can be selected by environmental conditions prevailing on plant roots (Berg and Smalla 2009; Raaijmakers et al. 2009; Bakker et al. 2014; Vandenkoornhuyse et al. 2015). Thus, a first possibility to account for the co-occurrence of both functional groups could be that both nifH bacteria and acdS bacteria do well in the maize rhizosphere. Indeed, both types of bacteria are readily found on roots (Blaha et al. 2006; Mårtensson et al. 2009; Arruda et al. 2013; Almario et al. 2014a; Bruto et al. 2014a,b). Such co-occurrence would make sense in ecological terms, because associative nitrogen fixation and ACC deamination are functions limiting plant nutrient deficiency by supplying nitrogen (Pii et al. 2015) and enhancing root system development (thereby improving uptake of mineral nutriments including nitrogen) (Glick 2014), respectively.
A second possibility could be that bacteria that harbor both genes/functions are well adapted to maize roots. Indeed, Bruto et al. (2014b) showed that the nif operon co-occurred with acdS in several bacterial clades, and for instance the genera Bradyrhizobium or Burkholderia contain several species harboring both functions (Bruto et al. 2014b). Furthermore, the co-inertia between these two functional groups and the total community raises the possibility that additional functions could also be present in addition to associative nitrogen fixation and ACC deamination. Indeed, comparative genomics studies showed that bacterial taxa display multiple specific functions, including plant interaction functions (Bruto et al. 2014b; Lassalle, Muller and Nesme 2015; Vacheron et al. 2017), and thus these functions would also be co-selected when selecting the corresponding rrs-based taxa. In the current study, Bradyrhizobium represented 17% to 25% of acdS+ bacteria and 20% to 42% of nifH+ bacteria in the maize rhizosphere, and the high proportion of this bacterial clade may contribute to the co-occurence of diazotrophs and ACC deaminase producers that was found. However, when the 10 369 completely-sequenced bacterial genomes available in the NCBI database were screened, it showed that 833 of them harbored acdS and 461 others nifH, but only 122 genomes had both genes. Therefore, it could be that this second possibility is insufficient for a complete explanation of the current findings.
A third possibility to consider is the joint occurrence of both functions in the rhizosphere, regardless of the taxa harboring them, thereby providing functional redundancy (Shade and Handelsman 2012). Several studies in soil or aquatic settings have suggested that the metabolic/functional potential of microbial communities rather than their taxonomic variations are closely related to environmental conditions (Burke et al. 2011; Louca, Parfrey and Doebeli 2016; Louca et al. 2017; Bouffaud et al. 2018). These observations were conceptualized as the ‘It's the song, not the singer’ theory (ITSNTS; Doolittle and Booth 2017), i.e. functional groups within microbial communities (the songs) would be better conserved and more relevant ecologically than the taxa themselves (the singers). Consistent with the ITSNTS theory, our study suggests that the assembly of the rhizosphere microbial community would entail a balance between phytostimulation-relevant genes, which may be needed to achieve an effective holobiont (i.e. the plant host and its functional microbiota), and points to the preponderance of functional interactions within the plant holobiont. This hypothesis, which has been put forward recently for root-associated microorganisms (Lemanceau et al. 2017), remains speculative at this stage and deserves further research attention. In particular, methodology development is needed to enable direct assessment of key plant-beneficial groups when parallel monitoring of several genes is required (e.g. for auxin production or P solubilization, which entail many genetic pathways), in contrast to ACC deamination and N fixation for which analysis of a single gene (acdS and nifH, respectively) may suffice.
To test whether the current findings could be also relevant under other environmental conditions, we reassessed the data obtained for nifH (Bouffaud et al. 2016) and acdS (Bouffaud et al. 2018) from two maize lines grown in another soil (luvisol) with different management histories (cropped soil vs meadow soil). A positive correlation (r = 0.45; P = 0.050; n = 20) was found between the numbers of nifH and acdS bacteria in the monocropping soil but not in meadow soil (P = 0.75; n = 10), suggesting that maize monocropping history could have been an important factor. However, these findings were obtained with young plants only (21 days), grown in sieved soil under greenhouse conditions.
In conclusion, the current findings indicate that rhizobacteria with nitrogen fixation capacity and counterparts harboring ACC deamination ability co-occur in the maize rhizosphere, pointing to the possibility that plants may rely on multiple, complementary phytostimulatory functions provided by their microbial partners. Additional method development is needed to extend this type of assessment to additional phytostimulatory groups and other microbial functional groups important for plant performance.
DATA ACCESSIBILITY
Illumina MiSeq paired-end reads have been deposited in the European Bioinformatics Institute (EBI) database under accession numbers PRJEB14347 (ERP015984) for rrs; PRJEB14346 (ERP015983) for nifH, PRJEB14343 (ERP015981) for acdS.
ACKNOWLEDGEMENTS
This work was supported in part by project Azodure (ANR Agrobiosphère ANR-12-AGRO-0008). We are grateful to J. Haurat and H. Brunet for technical help, as well as D. Abrouk (iBio platform, UMR CNRS 5557 Écologie Microbienne) and J. Thioulouse (UMR CNRS LBBE) for helpful discussion. The authors declare no conflict of interest.
AUTHOR CONTRIBUTIONS
LL, YML and DM designed the project, SR, LL, CPC, YML and DM carried out field work and samplings, SR conducted the molecular work, SR, MLB and AD implemented bioinformatic analyses, SR, YML and DM analyzed data, SR, YML and DM prepared the first draft of the manuscript, which was finalized by all authors.
Conflict of interest. None declared.
REFERENCES
Author notes
Current addresses: S.R.: BGene genetics Bâtiment B Biologie, F-38400 Saint Martin d'Hères, France. M.L.B.: Helmholtz Center for Environmental Research UFZ, Theodor-Lieser-Straβe 4, 06120 Halle, Germany.
