


ABSTRACT
Globally, the conversion of primary forests to plantations and agricultural landscapes is a common land use change. Kauri (Agathis australis) is one of the most heavily impacted indigenous tree species of New Zealand with <1% of primary forest remaining as fragments adjacent to pastoral farming and exotic forest plantations. By contrasting two forest systems, we investigated if the fragmentation of kauri forests and introduction of pine plantations (Pinus radiata) are significantly impacting the diversity and composition of soil microbial communities across Waipoua kauri forest, New Zealand. Using next generation based 16S rRNA and ITS gene region sequencing, we identified that fungal and bacterial community composition significantly differed between kauri and pine forest soils. However, fungal communities displayed the largest differences in diversity and composition. This research revealed significant shifts in the soil microbial communities surrounding remnant kauri fragments, including the loss of microbial taxa with functions in disease suppression and plant health. Kauri dieback disease, caused by Phytophthora agathidicida, currently threatens the kauri forest ecosystem. Results from this research highlight the need for further investigations into how changes to soil microbial diversity surrounding remnant kauri fragments impact tree health and disease expression.
INTRODUCTION
The structure and function of forest ecosystems is heavily influenced by the dominant tree species as they shape the characteristics of the surrounding soil and vegetation (Urbanova, Šnajdr and Baldrian 2015). Soil microbial communities in forest ecosystems play a vital role in organic matter mineralisation and nutrient acquisition for plants as well as regulating soil biogeochemical processes such as carbon (C) and nitrogen (N) cycling (Zhou et al. 2017). By modifying soil physicochemical properties, plant community composition, litter inputs and chemical composition of root exudates, dominant tree species can impact the diversity and composition of soil microbial communities (Llado, López-Mondéjar and Baldrian 2017; Nakayama et al. 2019). In turn, tree-associated soil microbial communities can impact ecosystem functioning and resilience to disturbance (Liu et al. 2018).
Globally, the conversion and fragmentation of primary forests to plantations and agricultural landscapes is a dominant land use change (Payn et al. 2015). The majority of exotic forestry plantations are found in countries of the Southern Hemisphere, such as South America and Oceania, where the forestry industry is dominant (Zhou, Wang and Luo 2018). Currently, indigenous forest covers 6.3 million hectares in New Zealand, whereas planted forest covers 1.73 million hectares. The most common exotic plantation type in New Zealand is of Pinus radiata, which constitutes ∼90% of current plantation forestry (Ministry for Primary Industries, New Zealand 2018). Kauri (Agathis australis) is one of the most heavily impacted indigenous tree species of New Zealand; this species has historically been subjected to heavy disturbance from uncontrolled logging for timber and gum, and then more recently land clearance for pastoral farming and exotic timber plantations (Ecroyd et al. 1982; Ogden et al. 2003; Steward and Beveridge 2010). Belonging to the ancient family Araucariaceae, kauri are the largest and longest living tree species in New Zealand forests with mature tree trunk diameters exceeding 3 m, tree heights averaging 30–50 m and estimated ages exceeding 1700 years (Steward and Beveridge 2010). Because of the size and dominance of kauri in the forest canopy and their influences on the abiotic and abiotic soil environment, they are often referred to as ecosystem engineers and are associated with soil podsolisation (Wyse et al. 2014). Once covering 1 million hectares, only 7500 hectares of this primary forest remain and exist as fragmented pockets, alongside 60 000 hectares of plantation and secondary regenerating kauri forest (Steward and Beveridge 2010). The largest remnant primary fragment is located in Waipoua, Northland, which is surrounded by pasture and pine plantations (Pinus radiata). While kauri forests are essentially unmanaged, pine plantations are subject to intensive management practices such as planting, pruning, thinning, harvest and replanting.
These remnant and regenerating kauri are now impacted by kauri dieback disease, caused by the soil-borne pathogen Phytophthora agathidicida, which is extensive throughout the natural range and particularly in Waipoua Forest (Beever et al. 2009; Weir et al. 2015). The combined threats of dieback disease and widespread forest fragmentation due to land use change threaten survival of the remaining kauri forests. Understanding how separate, overlapping disturbance events can interact to influence tree health is of growing interest in forest pathology (Cobb and Metz 2017). By creating new transmission pathways and altering the environmental conditions of the ecosystem, vegetation and land use changes can impact disease emergence and spread (Meentemeyer et al. 2008). Kauri dieback disease is an example of widespread tree dieback caused by an invasive pathogen that is distributed across the majority of the host's natural range (Waipara et al. 2013). Furthermore, this pathogen is spreading across a fragmented forest environment, with high levels of spatiotemporal variability at a landscape level. Characterising the changes to soil microbial communities that have occurred as a result of kauri forest fragmentation and plantation establishment is a key step in assessing the influence of historical landscape disturbances on health of kauri forest. Additionally, the risks posed by unintentional introduction of invasive microbial species from pine plantation establishment to the remaining kauri forest fragments are still unknown (Desprez-Loustau et al. 2007). To facilitate such assessments, it is first required to characterise and identify differences between the soil microbial communities associated with both tree species.
The disease triangle is a widely used tool that models disease spread resulting from complex interactions between a pathogen, host and environmental conditions (Cobb and Metz 2017). As kauri forests have been so heavily impacted by forest fragmentation, defining environmental factors conducive to pathogen spread requires us to consider differences in the soil biotic environment surrounding remnant kauri fragments. The objective of this study was to characterise the differences in the diversity and composition of soil fungal and bacterial communities in adjacent stands of kauri and pine plantation forest. Soil microbial communities play a key role in modulating tree health and pathogen spread (Desprez-Loustau et al. 2007). Lewis et al. (2019) found that P. agathidicida cultures incubated in soil collected from pine forest produced higher oospore counts in vitro than when incubated in soil collected from kauri forest, where both soils originated from Waipoua Forest. It is important to note that no pine plantation soils from Waipoua Forest have yet tested positive for P. agathidicida (Lewis et al. 2019; Tables S4 and S5, Supporting Information). However, results from this in vitro study suggest the potential for pine forest soils to support survival of P. agathidicida, thereby acting as a pathogen reservoir. This study seeks to further explore the impact of pine plantation establishment on kauri forest health, by identifying if there have been significant alterations to native soil microbial communities surrounding remnant kauri forests.
MATERIALS AND METHODS
Site description and soil sampling
Waipoua Forest is an ∼13 000 hectare conservation area situated on the west coast of Northland, New Zealand (35° 38′S, 173° 34′E) (Figure S1, Supporting Information). The Waipoua landscape is formed of gently sloping hills with deeply weathered and low fertility clay soils over basaltic rock (Burns 1995; Steward and Beveridge 2010). Declared a forest sanctuary in 1952, it is the largest remaining area of old growth kauri forest (Steward and Beveridge 2010). However, Waipoua Forest has had a long history of disturbances from forestry activities within it (Beachman 2017) and there are currently 3338 hectares of pine forest located within Waipoua Forest (Te Roroa, 2014). Waipoua Forest was selected as the study site because it contains adjacent stands of old growth kauri forest and plantations of exotic P. radiata.
A preliminary survey was conducted across Waipoua Forest to identify asymptomatic kauri trees, which are those not expressing symptoms of kauri dieback disease, with nearby sites of pine plantation. The kauri forest ecosystem is currently under threat from widespread dieback disease, caused by the soil-borne pathogen Phytophthora agathidicida (Beever et al. 2009, Weir et al. 2015). The impacts of tree dieback on kauri soil microbial communities are not yet known. Therefore, to compare the soil microbial communities of kauri and pine soils, it was important to sample asymptomatic kauri trees not disturbed from pathogen invasion. All kauri and pine soil samples were tested for the presence of P. agathidicida using a TaqMan real-time PCR assay (Than et al. 2013) and a soil baiting bioassay (Beever et al. 2010). No soil samples tested positive for P. agathidicida. A full description of these methods and results is provided in the Supporting Information.
Once suitable sites were identified, 15 mature kauri trees and 15 pine trees from adjacent exotic pine plantations were sampled. Pine trees sampled were from third rotation plantations with tree ages of >50 years. As the pine forest stands have had more active management and have been selectively bred, tree ages and tree structures were uniform and there were few other plant species in each site. For the kauri sites, only mature stands of primary kauri trees (+200 years) were selected; these were the dominant tree type in the selected asymptomatic stands.
For soil sampling, a 500 g composite soil sample, formed of four 125 g subsamples, was taken from around the base of each tree. Following the removal of the leaf litter layer, the A horizon, or the first 10 cm of soil depending on the depth of the A horizon, was targeted for sampling. Each soil sample was sieved, stored in sealed, packaged in triplicate and transported at 4°C. For each sample, 10 g subsamples were stored at −20°C for DNA extraction and soils used for chemical analysis were air-dried and passed through a <2-mm sieve to remove leaf litter and debris. Care was taken to prevent cross-contamination of soil samples by cleaning all sampling equipment with ethanol and using fresh gloves and boot covers between each tree sampled.
Soil DNA extraction and amplicon sequencing
Soil DNA was extracted using a DNeasy Powersoil Kit (Qiagen, Hilden Germany) following the manufacturer's instructions. Three extractions, using 0.25 g of soil per extraction, were taken per sample and DNA from the three replicate extractions were combined to provide a 300-µL DNA extract for each soil sample. DNA samples were quantified using a Quant-iT dsDNA Assay kit (Invitrogen, California USA) on a Qubit 4 Fluorometer (Invitrogen, California USA). Sample purity was assessed using a Nanodrop Spectrophotometer to check for A260/A280 ratio of >1.8.
Genomic DNA samples required for microbial amplicon sequencing were then sent to Novogene Co., Ltd (Wan Chai, Hong Kong) for library preparation. The bacterial 16S rRNA gene region was amplified using primers 341F (CCTAYGGGRBGCASCAG) and 806R (GGACTACNNGGGTATCTAAT) to target the V3–V4 gene region (Fadrosh et al. 2014). The fungal internal transcribed spacer (ITS) gene region (Yang et al. 2018) was amplified using primers ITS3 (GCATCGATGAAGAACGCAGC) and ITS4 (TCCTCCGCTTATTGATATGC) to target the ITS2 gene region (Yang et al. 2018). Following quality control checks, successful libraries were sequenced on the Illumina HiSeq platform to generate 250-bp paired-end reads.
Bioinformatics analysis
Following sequencing, raw sequencing reads were assigned to samples based on unique barcodes attached during library preparation. Barcodes and primers were truncated and paired-end reads merged using FLASH V1.2.7. These reads were quality filtered using QIIME V1.7.0 to obtain high-quality reads and chimera sequences were removed using UCHIME.
Sequences were clustered into operational taxonomic units (OTUs) based on 97% sequence similarity using UCLUST (Qiime V1.7.0; Kuczynski et al. 2011). Each OTU was identified taxonomically using the reference databases ‘Ribosomal Database Project’ for 16S classification and ‘UNITE’ for ITS classification. The resulting OTU clusters, with taxonomic assignment, were used to create an OTU table showing abundance of each identified taxa across all the samples. Prior to conducting these analyses, OTU tables were filtered to remove non-bacterial and non-fungal taxa. Due to differences in sequencing depth across samples, OTU tables were rarefied to even sequence counts associated with each sample. Processing of sequenced reads and preparation of OTU tables for further analysis were guided by protocols from Caporaso et al. (2010). These OTU tables were subsequently used to perform further statistical analyses guided by protocols from Buttigieg and Ramette (2014).
Microbial diversity analysis
Four alpha diversity metrics were calculated using rarefied fungal and bacterial OTU tables. These were observed species counts, Chao1 (an abundance based estimator of species richness), Simpson's diversity (the total species number of a community and the relative abundances of different species making up this community) and Dominance index (how equally taxa are presented across each dataset) (Caporaso et al. 2010).
The following beta diversity analyses were performed using QIIME diversity plugin scripts and the VEGAN R package (Caporaso et al. 2010; Oksanen et al. 2019). To compare differences in community composition across sites, a Bray–Curtis dissimilarity matrix was calculated for bacterial and fungal OTU tables. Principal coordinates analysis was used to ordinate sites based on their distances and to enable visual interpretation of site dissimilarity. Differences in dissimilarity scores) between kauri and pine sites were tested for significance using Permutational analysis of variance (PERMANOVA). Alongside this, a test of homogeneity of dispersion (PERMDISP) was used to test for multivariate homogeneity of within group variance. Similarity percentage (SIMPER) analysis was used to identify which individual fungal and bacterial taxa were contributing to differences in the Bray–Curtis dissimilarity scores between kauri and pine soils. Euclidean distances were calculated for seven soil properties: pH, total carbon, total nitrogen, C:N ratio, organic matter, bioavailable nitrogen (BN) and BN:total nitrogen ratio. The pairwise dissimilarities of soil physicochemical variables were correlated to Bray–Curtis dissimilarities of microbial community composition using Mantel tests, with significance tested through permutations. BIOENV analysis was applied to bacterial and fungal distance matrices to rank correlate environmental variables with differences in community composition.
The Metacoder R package (Foster, Sharpton and Grünwald 2017) was used to produce heat trees to visualise taxa that had significant differences in their relative abundance between kauri and pine soils. The relative abundance of each taxonomic group was tested for significance using Wilcoxon rank-sum tests with multiple comparisons corrected for using false discovery rate (FDR) correction. The FUNGuild database (Nguyen et al. 2016) was used to parse fungal OTUs into different ecological categories based on their taxonomic identity.
Soil properties
Soil samples were air dried at 35°C and sieved through <2 mm sieve prior to determination of pH, total carbon (C), organic matter, total nitrogen (N), bioavailable N (aerobically mineralisable N) and bioavailable phosphorus (P – Olsen P) using established methods (Olsen 1954; Keeney and Bremner 1966; Hinds and Lowe 1980; Nelson and Sommers 1996).
RESULTS
Soil microbial diversity
There was a significant difference in several of the metrics used to measure alpha diversity between kauri and pine soils (Table 1). Pine soil had a significantly higher Simpson's diversity than kauri soil. Kauri soil had a significantly higher dominance, with a few fungal taxa having a large relative abundance in the dataset. Both kauri and pine soils had a high Simpson's diversity (>0.98) and low dominance of bacterial species (<0.02) showing that there was a high diversity of bacterial species, but each species had a low relative abundance.
Means and standard errors (SEM) of each metric used to assess alpha diversity of fungal and bacteria communities between kauri and pine soils. Results of Wilcoxon rank-sum test are shown, testing for significant differences between kauri and pine soils.
| Diversity index | Kauri | Pine | Wilcoxon rank-sum |
|---|---|---|---|
| Fungi | |||
| Observed species | 982.13 ± 64.88 | 907.73 ± 81.79 | W = 128, P > 0.05 |
| Species richness | 1300.6 ± 73.47 | 1158.8 ± 93.52 | W = 121, P > 0.05 |
| Simpson's diversity | 0.86 ± 0.03 | 0.94 ± 0.01 | W = 32, P < 0.01 |
| Dominance | 0.15 ± 0.02 | 0.07 ± 0.01 | W = 166, P < 0.01 |
| Bacteria | |||
| Observed species | 3476.6 ± 68.89 | 3313.7 ± 142.14 | W = 121, P > 0.05 |
| Species richness | 4545.8 ± 81.47 | 4314.6 ± 76.89 | W = 136, P > 0.05 |
| Simpsons diversity | 0.98 ± 0.00 | 0.98 ± 0.00 | W = 71.5, P > 0.05 |
| Dominance | 0.02 ± 0.0 | 0.01 ± 0.0 | W = 129, P > 0.05 |
There was no significant difference in the species richness or observed number of species between kauri and pine soils. For bacterial diversity, there were no significant differences between kauri and pine soils for any of the alpha diversity metrics measured.
Soil microbial community composition
There was a significant difference in the composition of fungal communities between kauri and pine soils (PERMANOVA pseudo-F = 15.4, P = 0.001). Moreover, there was no significant difference in the homogeneity within kauri and pine group samples (PERMDISP, F value = 0.03, P = 0.85) (Fig. 1), thus indicating strong and clear differences in the community composition between kauri and pine soils.
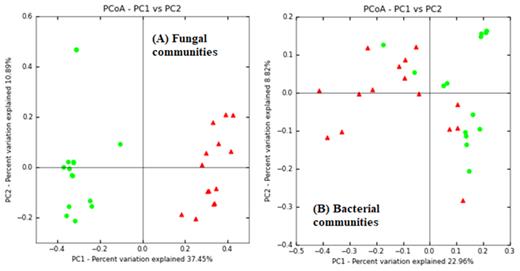
Ordination plots of the principal coordinates analysis conducted on Bray–Curtis dissimilarity distances of fungal community composition (A) and bacterial community composition (B).
There was a significant difference in the bacterial communities between kauri and pine soils (PERMANOVA pseudo-F = 3.9, P < 0.001). However, PERMDISP analysis also showed that there was a significant difference in the homogeneity of sites within each forest soil type (F = 7, P = 0.001). This indicates that both group effect and heterogeneous dispersion of samples were having an impact on community dissimilarities (Fig. 1).
A full list of taxa identified by SIMPER analysis as contributing to differences in fungal community dissimilarity between kauri and pine soils can be found in Table S1 (Supporting Information). Fungal taxa that had the highest contributions to community dissimilarity and were significantly higher in kauri soil than pine soil included Apiotrichum gamsii (11.10%, P < 0.001), Tremellomycetes (12.01%, P < 0.001), Trichoderma spirale (2.45%, P < 0.001), Pezizomycotina (2.69%, P < 0.001) and Mortierellaceae (1.1%, P < 0.05). Fungal taxa significantly contributing to community dissimilarity that were significantly higher in pine soil than kauri soil included Sistotrema (8.18%, P < 0.01), Oidiodendron chlamydosporicum (6.32%, P < 0.001), Sagenomella verticillata (4.22%, P < 0.001), Pseudotomentella griseopergamacea (P < 0.001), Umbelopsis ramanniana (P < 0.001), Oidiodendron tenuissimum (P < 0.001), Amanita muscaria (P < 0.01), Hyaloscyphaceae (P < 0.01), Penicillium (P < 0.01) and Hypocreales (P < 0.001).
Bacterial taxa that significantly contributed to dissimilarity and were significantly higher in kauri soil than pine soil included Enterobacteriaceae (8.49%, P < 0.001), Pseudomonas (1.60%, P < 0.001), Yersinia (1.23%, P < 0.001), Pseudomonadaceae (1.02%, P < 0.001), Acinetobacter (0.98%, P < 0.001) and Rhizobiales (0.78%, P < 0.001). Those significantly higher in pine soil included Actinomycetales (4.64%, P < 0.001), Acidobacteriaceae (3.17%, P < 0.01), Acetobacteraceae (2.29%, P < 0.001) and Sinobacteraceae (1.78%, P < 0.01). A full list of these taxa and results of SIMPER analysis can be found in Table S2 (Supporting Information).
Relationship between community composition and soil physicochemical variables
Significant differences were found between kauri and pine soils for all soil properties except for pH and Olsen P (Table 2). Total C, total N, organic matter, bioavailable N and bioavailable N:total N were significantly higher under kauri whilst C:N ratio was significantly higher under pine. There were no significant differences between kauri and pine soils for pH and Olsen P.
The results of the soil chemical analysis showing means and standard errors (SEM) of each property tested for in kauri and pine soils sampled from Waipoua Forest. ANOVA results are displayed, testing for significant differences between kauri and pine soils.
| Soil chemical property | Kauri | Pine | ANOVA |
|---|---|---|---|
| pH | 5.16 ± 0.05 | 5.09 ± 0.10 | F = 0.37, P > 0.05 |
| Olsen P | 5.75 ± 0.41 | 5.5 ± 0.43 | F = 0.13, P > 0.05 |
| Bioavailable N (ug/g) | 211.49 ± 7.14 | 76.13 ± 2.08 | F = 351.4, P < 0.001 |
| Organic matter (%) | 26.18 ± 1.02 | 18.43 ± 0.29 | F = 56.49, P < 0.001 |
| Total carbon | 14.10 ± 0.74 | 10.84 ± 0.13 | F = 20.08, P < 0.001 |
| Total nitrogen | 0.57 ± 0.04 | 0.31 ± 0.01 | F = 43.40, P < 0.001 |
| C:N ratio | 27.14 ± 0.24 | 34.88 ± 1.10 | F = 43.32, P < 0.001 |
| Bioavailable N:total N | 4.01 ± 0.15 | 2.57 ± 0.16 | F = 40.04, P < 0.001 |
When relating these differences to differences in community composition, mantel tests revealed bioavailable N (r = 0.72, P = 0.001), C:N ratio (r = 0.42, P = 0.001), organic matter (r = 0.47, P = 0.001), total carbon (r = 0.24, P = 0.001) and total nitrogen (r = 0.38, P = 0.001) significantly correlated to differences in fungal community composition between the kauri and pine soils. Bioavailable N (BIOENV, Spearman's rank = 0.75) was the best-fitting soil property that accounted for differences in microbial community composition between kauri and pine soils. For bacterial communities, organic matter (r = 0.44, P = 0.001), bioavailable N (r = 0.29, P = 0.001) and total carbon (r = 0.27, P = 0.02) significantly correlated to differences in community composition. Organic matter content was ranked as the best-fitting soil parameter for differences in community composition between kauri and pine soils (BIOENV, Spearman's rank = 0.42).
Taxonomic composition of microbial communities in kauri and pine soils
There were a total of 18 fungal phyla in kauri and pine soils, with 4.39% ± 0.89 of reads in kauri soil and 3.12% ± 0.59 in pine soil belonging to unassigned phyla. Ascomycota and Basidiomycota formed the majority of reads across all soil samples (Fig. 2). The % relative abundance of Ascomycota was significantly higher (H-value = 7.92, P = 0.005) % in pine soil (56.72 ± 2.46) in comparison to kauri soil (38.50 ± 4.20), whereas Basidiomycota was significantly higher (H-value = 4.98, P = 0.026) in kauri soil (49.22 ± 5.39) in comparison to pine soil (31.58 ± 2.46).
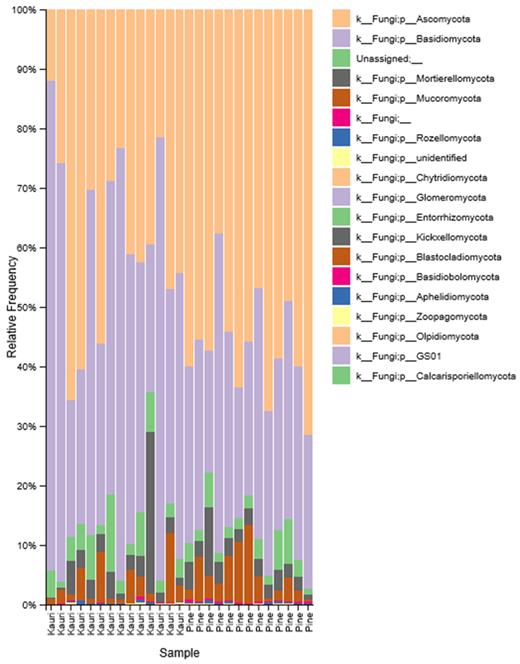
Relative frequency (%) of fungal phyla across kauri and pine soil samples.
Several major fungal taxonomic groups showed significant differences in their relative abundances between kauri and pine soils (Fig. 3 ). Within the Basidiomycota, the class Tremellomycetes was significantly higher in kauri soil (P < 0.001), including the order Trichosporonales (P < 0.001), family Trichosporonaceae (P < 0.001) and genus Apiotrichum (P < 0.001). Members of the Agaricales, such as the family Clavariaceae (P = 0.047) and genera Clavulinopsis (P = 0.015) and Hygrocybe (P = 0.042), had significantly higher relative abundance in kauri soil. The family Ganodermataceae (P = 0.015) and genus Ganoderma (P = 0.015) also had a significantly higher relative abundance in kauri soil. Within the Mortierellomycota, two families belonging to the Mucorales, Backusellaceae (P = 0.015) and Mucoraceae (P = 0.004), had significantly higher relative abundance in kauri soil. This included their genera Backusella (P = 0.015) and Mucor (P = 0.004). Members of the Ascomycota with significantly higher relative abundance in kauri soil included the family Saccharomycetaceae (P = 0.029) and its genera Barnettozyma (P = 0.010) and Kazachstania (P = 0.029). The order Hypocreales (P = 0.019), family Hypocreaceae (P = 0.003) and genus Trichoderma (P = 0.003) were also in significantly higher relative abundance in kauri soil.
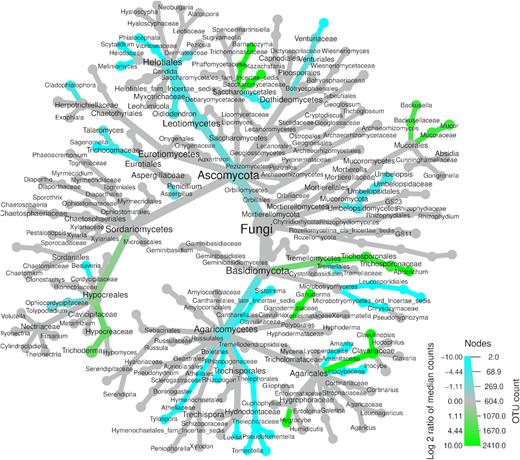
Differential heat tree showing fungal taxa with significantly different relative abundances (P < 0.05) between kauri and pine soils. Taxa significantly higher in kauri soil are represented by green nodes and those significantly higher in pine soil are represented by blue nodes.
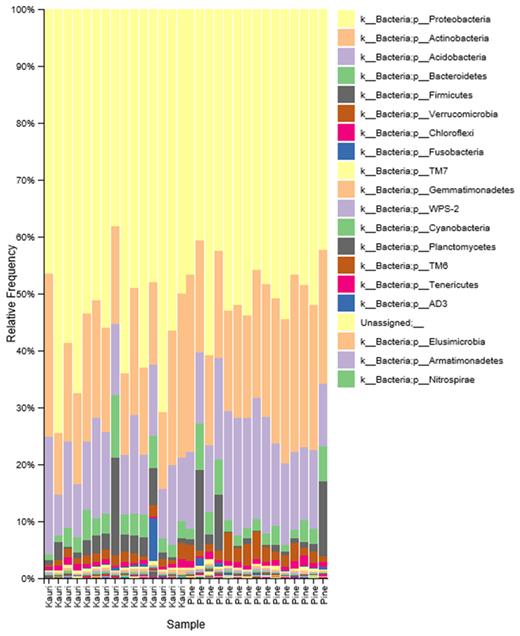
Relative frequency (%) of bacterial phyla across kauri and pine soil samples.
For pine soil, members of the Basidiomycota with significantly higher relative abundances included the class Agaricomycetes (P = 0.008) and its orders Thelophorales (P < 0.001), Cantharellales (P < 0.001) and Atheliales (P < 0.001). Genera within these orders were Sistrotrema (P < 0.001), Amanita (P = 0.002), Inocybe (P = 0.025), Tomentella (P < 0.001), Pseudomentella (P < 0.001), Tylospora (P < 0.001) and Rhizopogon (P < 0.001). Additionally, the orders Tremellales (P < 0.001) and Leucosporidiales (P < 0.001) had significantly higher relative abundance in pine soil. Members of the Ascomycota with significantly higher relative abundance in pine soil included the families Ophiocordycipotaceae (P = 0.008) and Trichocomaceae (P < 0.001) and genera Beauveria (P = 0.029), Aspergillus (P < 0.001), Sagenomella (P < 0.001), Talaromyces (P = 0.005) and Cladophialophora (P = 0.002). The class Leotiomycetes was also significantly higher in pine soil, including the order Helotiales (P < 0.001) and its genera Oidiodendron (P < 0.001), Meliniomyces (P = 0.015), Scytalidium (P = 0.020) and Phialocephala (P < 0.001). The order Venturiales (P = 0.010) and family Venuriaceae (P = 0.010) was also a member of the Ascomycota significantly higher in pine soil. One class belonging to the Mortierellomycota, the Umbelopsidomycetes (P = 0.008), was significantly higher in pine soil, including its order Umbelopsidales (P = 0.008), family Umbelopsidaceae (P = 0.008) and genus Umbelopsis (P = 0.008).
There were 51 bacterial phyla identified in the data set, however, as a large majority of these had very low % relative abundances and only the 20 most abundant phyla are shown in Fig. 4. The majority of % relative abundance came from three phyla, the Proteobacteria (kauri %: 56.33 ± 2.61, pine %: 49.10 ± 1.38), Actinobacteria (kauri %: 18.95 ± 1.4, pine %: 23.07 ± 1.24) and Acidobacteria (kauri %:12.91 ± 0.95, pine %: 15.79 ± 0.93). Kruskal–Wallis tests found that Proteobacteria had a significantly higher % relative abundance in kauri soil (H-value = 4.39, P = 0.036), whereas in pine soil, Actinobacteria (H-value = 4.29, P = 0.026) and Acidobacteria (H-value = 4.05, P = 0.044) had a significantly higher % relative abundance.
In contrast to fungal taxa (Fig. 5), there was a lower number of bacterial taxa that had a significant difference in their relative abundance between kauri and pine soils. The majority of these taxonomic differences were from within the Proteobacteria. The orders Neisseriales (P = 0.048), Pseudomonadales (P = 0.006), Enterobacteriales (P = 0.006) andRhodobacterales (P = 0.016) had significantly higher relative abundances in kauri soil. This included the families Neisseriaceae (P = 0.048), Pseudomonadaceae (P = 0.008), Enterobacteriaceae (P = 0.006), Rhizobiaceae (P = 0.022), Rhodobiaceae (P = 0.022) and Moraxellaceae (P = 0.026). Bacterial genera belonging to the Proteobacteria that were significantly higher in kauri soil included Pseudomonas (P = 0.008), Acinetobacter (P = 0.022), Sphingomonas (P = 0.024), Afifiella (P = 0.022) and Phenylobacterium (P = 0.022). One family belonging to Actinobacteria, Micromonosporaceae (P = 0.022), was significantly higher in kauri soil.
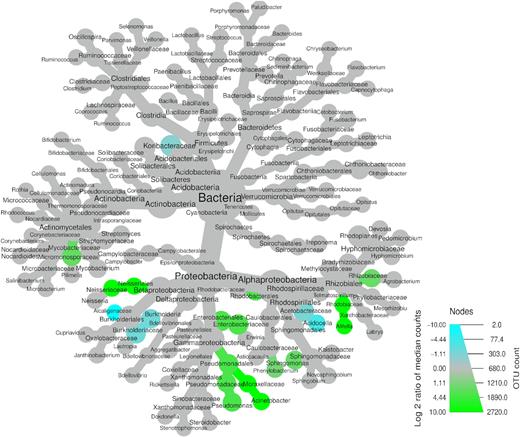
Differential heat tree showing bacterial taxa with significantly different relative abundances (P < 0.05) between kauri and pine soils. Taxa significantly higher in kauri soil are represented by green nodes, while those significantly higher in pine soil are represented by blue nodes.
Three families belonging to the Proteobacteria, the Alcaligenaceae (P = 0.027), Burkholderiaceae (P = 0.032) and Acetobacteraceae (P = 0.006), had significantly higher relative abundance in pine soil, which included the genera Burkholderia (P = 0.022) and Acidocella (P = 0.006). One family belonging to the phylum Acidobacteria, Koribacteraceae (P = 0.020), was in significantly higher relative abundance in pine soil.
Functional attribute profiles of fungal communities in kauri and pine soils
There were differences in trophic modes of fungal communities between kauri and pine soils (Table 3). Kauri soil had a significantly higher relative abundance of saprotrophic fungi and pine soil had a significantly higher relative abundance of symbiotrophic fungi. There were no differences in abundance of pathotrophic fungi between the kauri and pine soils.
The average % and standard error (SEM) of FUNGuild categories in kauri and pine soils. The results of Kruskal–Wallis chi-squared tests are displayed, testing for significant differences in the % relative abundance of each FUNGuild category between kauri and pine soils.
| FUNGuild category | Kauri % | Pine % | Kruskal–Wallis |
|---|---|---|---|
| Trophic mode | |||
| Saprotroph | 70.07 ± 3.59 | 48.33 ± 3.62 | H = 10.43, P < 0.001 |
| Pathotroph | 2.19 ± 0.38 | 2.06 ± 0.24 | H = 0.19, P > 0.05 |
| Symbiotroph | 13.53 ± 2.13 | 28.47 ± 0.84 | H = 15.77, P < 0.001 |
| Ecological guild | |||
| Soil saprophyte | 45.41 ± 5.01 | 6.82 ± 1.39 | H = 20.60, P < 0.01 |
| Litter saprophyte | 0.65 ± 0.4 | 0.34 ± 0.1 | H = 2.33, P > 0.05 |
| Undefined saprophyte | 18.76+/−2.42 | 36.84 ± 4.0 | H = 11.00, P < 0.001 |
| Wood saprophyte | 4.58 ± 2.3 | 2.46 ± 0.72 | H = 0.76, P > 0.05 |
| Animal pathogen | 0.64 ± 0.09 | 0.28 ± 0.06 | H = 8.55, P < 0.01 |
| Plant pathogen | 1.33 ± 0.30 | 1.62 ± 0.18 | H = 3.20, P > 0.05 |
| Ectomycorrhizae | 0.41 ± 0.08 | 11.98 ± 1.33 | H = 21.00, P < 0.001 |
| Endophyte | 12.02 ± 2.03 | 6.46 ± 0.73 | H = 6.19, P < 0.05 |
| Orchid mycorrhizae | 0.02 ± 0 | 0.02 ± 0 | H = 4.03, P < 0.05 |
| Ericoid mycorrhizae | 17.64 ± 0.39 | 12.01 ± 1.57 | H = 11.29, P < 0.001 |
| Growth form | |||
| Agaricoid | 2.44 ± 1.33 | 6.41 ± 1.2 | H = 12.81, P < 0.001 |
| Microfungus | 17.28 ± 2.88 | 22.32 ± 3.92 | H = 1.95, P > 0.05 |
| Macrofungus | 5.05 ± 2.34 | 10.79 ± 1.76 | H = 8.05, P < 0.01 |
| Yeast | 43.62 ± 5.0 | 3.93 ± 0.48 | H = 21.00, P > 0.001 |
| Dark septate fungus | 1.15 ± 0.32 | 11.75 ± 1.61 | H = 10.71, P < 0.001 |
There were also differences in the ecological guilds of fungal communities. Pine soil had a significantly higher relative abundance of ectomycorrhizal fungi and undefined saprophytes. Kauri soil had a significantly higher relative abundance of soil saprophytes, endophytes and ericoid mycorrhizae. There were no significant differences in the relative abundances of wood saprophytes, litter saprotrophs or plant pathogens (Table 3).
In relation to fungal growth forms, kauri soil had a significantly higher abundance of yeasts. Pine soil had a significantly higher abundance of dark septate endophytes, agaricoid fungi and macrofungi. There were no significant differences in the abundance of microfungi between the kauri and pine soils (Table 3).
DISCUSSION
Differences in microbial diversity and composition between kauri and pine soil
When comparing the soil microbial communities between kauri and pine soils, fungal communities displayed the most significant differences in composition, diversity and functional attributes. Although there were significant differences in bacterial communities between kauri and pine soils, differences in forest soil type appear to be exerting a greater influence on fungal communities.
Pine soil had a significantly higher fungal diversity compared to kauri soil. In contrast, fungal communities of kauri soil had a higher dominance index, meaning they were dominated by a few taxonomic groups that had large relative abundances. This is consistent with previous studies that have also observed plantation forests to have higher fungal diversity than primary forests (Zhou, Wang and Luo 2018). The long life histories of kauri trees and properties of their litter layer cause the build-up of acidic podzols in the soil (Steward and Beveridge 2010). Therefore, the high dominance of a few fungal taxa in kauri soil may be a result of this highly selective soil environment that over time acts as an ecological filter, supporting the most well-adapted taxonomic groups (Wyse et al. 2014). Typically, ecosystems with lower resident diversity are more vulnerable to invasion due to limited empty niche space and resources available for invading pathogens (Bonoanomi et al. 2014; van Elsas et al. 2012). This finding now opens up the question as to whether the relatively low fungal diversity of kauri soils (McKenzie, Buchanan and Johnston 2002) could be making them more vulnerable to invasive soil-borne pathogens.
Unlike the fungal communities of kauri soil, bacterial communities of both kauri and pine soils had high diversity and low dominance values. Both kauri and pine soils were dominated by the bacterial phyla Proteobacteria, Actinobacteria and Acidobacteria, all commonly found in acidic coniferous forests (Llado, López-Mondéjar and Baldrian 2017). Soil pH is regarded as being a strong predictor of bacterial community composition (Lauber et al. 2009; Llado, López-Mondéjar and Baldrian 2017). No differences in pH between kauri and pine soils were observed in this study, perhaps explaining the lack of differences in diversity between forest soil types and less obvious differences in bacterial community composition compared to fungal.
The clear differences in fungal community composition and taxonomic profiles between kauri and pine soils can be explained ecologically, as the saprophytic and symbiotic roles of fungal communities in the soil environment mean their composition is often a reflection of tree litter inputs and root exudates (Urbanova, Šnajdr and Baldrian 2015). In fact, these close links have led to fungal biomass and community structure being regarded as more credible indicator of environmental change than organic matter (Wu et al. 2019). In contrast, changes to dominant tree species see smaller, indirect effects on bacterial communities as they occupy niches within the soil environment on a smaller scale and are less directly affected by the roots of trees species (Urbanova, Šnajdr and Baldrian 2015).
The high levels of organic matter in kauri soil could explain the dominance of saprotrophs in this forest soil type, as they play a key role in decomposition of organic matter (Wu et al. 2017). Saprophytic fungi have been observed to be more abundant in high nutrient soils, such as kauri soils, whereas low nutrient soils are typically more diverse in ectomycorrhizal fungi as observed for pine in this study (Wu et al. 2017). Bioavailable nitrogen is often used as an indicator of soil quality and microbial biomass (Wakelin et al. 2013) and was strongly correlated to differences in fungal community composition between kauri and pine soils. The higher values of AMN in kauri soil and its correlation to differences in fungal community composition may indicate higher levels of fungal biomass and community activity in kauri soils, especially for kauri soil's saprophytic fungi.
Potential threats posed by introduced microbial taxa
A common consequence pine plantation establishment is the increase in introduced non-native fungi, which may be contributing to the higher fungal diversity observed in pine soil in this study (Desprez-Loustau et al. 2007). Kauri trees have previously been reported to not form ectomycorrhizal associations (McKenzie, Buchanan and Johnston 2002) and in this study, kauri soil indeed had low abundances of ectomycorrhizal fungi, especially compared to pine soils. Shifts towards higher abundances of ectomycorrhizal fungi following the establishment of pine plantations have previously been observed and their association with pine tree roots often aids plantation establishment (Giachini et al. 2000; Chapela et al. 2001). The ability of P. radiata to form mutualistic associations with mostly non-native ECM fungi has been credited with their invasive success across New Zealand (Dickie et al. 2010). Many fungal taxa that were present in significantly higher numbers in pine soil in this study (such as Inocybe, Pseudotomentella, Rhizopogon, Amanita, Thelephora, Phialocephala (root endophyte), Tylospora and Cantharellales) have previously been reported as non-native ECM associates of P. radiata in New Zealand (Dickie et al. 2010; Walbert et al. 2010).
Historically, New Zealand's kauri forests have been threatened by forest loss from land clearance and forest fragmentation. Their modern day threat is from the spread of kauri dieback disease, caused by the soil-borne pathogen P. agathidicida. Forest ecosystems worldwide are being threatened by both anthropogenic-induced environmental disturbances, such as habitat fragmentation, and the more frequent exposure to new diseases from increasing global trade (Thakur et al. 2019). The unintentional introduction of invasive fungi and oomycetes via introduced tree species is a common invasion pathway, with invasive pathogens being a main driver of emerging infectious diseases in forest ecosystems (Desprez-Loustau et al. 2007; Ghelardini et al. 2016). This risk is particularly high for Phytophthora species, with the plant nursery trade being identified as a vector for introduction and dispersal into new ecosystems globally (Scott, Burgess and Hardy 2013; Jung et al. 2016).
This study compared the microbial communities associated with kauri and pine soils and found significant differences in the soil microbial communities of native kauri soils compared to exotic pine plantations. The differences in soil microbial diversity between forest systems could potentially result in the exposure of kauri fragments to introduced microbial communities that now have kauri within their range. The presence of fungal taxa that have previously been reported as non-native to New Zealand provides early evidence to support this. Compared to plant and animal introductions, the potential ecological consequences of non-native fungi that have not yet begun to cause negative ecological impacts are rarely quantified (Desprez-Loustau et al. 2007). Finding methods to quantify the risks associated with the microbial community shifts presented here would be wise, especially given the already threatened state of the remnant kauri fragments.
Potential role of soil microbial communities to the health of remnant kauri fragments
Characterising the belowground diversity of native forest ecosystems, such as New Zealand's kauri forests, is required to identify microbial indicators of soil quality, which can support long-term tree health (Schloter et al. 2018). This study identified fungal and bacterial taxa that were significantly different between sites (Figs 3 and 5). Taxonomic groups such as Apiotrichum, Tremellomycetes, Trichoderma, Pseudomonas, Enterobacteriaceae, Actineobacter and Rhizobiaceae were significantly higher in kauri soil. Several of these genera, for example Pseudomonas and Trichoderma, are well known for their roles in plant disease suppression and promotion of plant health (Avis et al. 2008). The Rhizobiaceae family contains many nitrogen-fixing endophytes with key roles in plant growth promotion (Gaiero et al. 2013). Additionally, the Enterobacteriacae have been identified as plant growth-promoting bacteria with roles in plant nitrogen and phosphorus uptake and facilitation of glucose decomposition in soils (Kim, Jordan and McDonald 1998; Degelmann et al. 2009; Kumar et al. 2017).
The loss of core microbiota from native soil microbial communities, which may have potential functional roles in soil and plant health, surrounding remnant kauri fragments could be altering the forest's ability to respond to pathogen invasion. Removal of kauri forests and establishment of pine plantations have caused significant shifts in native soil microbial communities across Waipoua Forest. Understanding the ecological impacts of these changes to the soil microbial communities surrounding remaining kauri fragments is important to protect the long-term health and functioning of these fragments.
Pathogen spillover occurs when pathogens have multiple hosts across a landscape. When alternative reservoir hosts have the ability to support higher pathogen inoculum loads, disease transmission can be accelerated across the environment (Beckstead et al. 2010). It is well understood that P. agathidicida is highly pathogenic against kauri and forms an extensive host-pathosystem across remnant kauri forests. A previous study by Lewis et al. (2019) used growth response assays to identify that oospore counts of P. agathidicida cultures were significantly higher when incubated in pine soils than kauri soils. Despite these in vitro studies suggesting pine soil may have the potential to act as a pathogen reservoir, no environmental pine soil samples have yet tested positive for P. agathidicida in this study, nor in the study by Lewis et al. (2019). Furthermore, fungal diversity of pine soils was shown to be significantly higher than kauri soils. Given high fungal diversity has previously shown a negative relationship with pathogen invasion (Bonanomi et al. 2014), this goes against the proposal that pine soils might function as a pathogen reservoir. However, results from this research do show that there are significant differences in the soil microbial communities of kauri and pine soils. Further work is needed to determine how these differences may influence the growth and behaviour of P. agathidicida and health of remnant kauri fragments.
CONCLUSION
This research has shown significant differences in the microbial diversity and composition of soil microbial communities associated with old growth kauri forests and adjacent pine plantations in Waipoua Forest, and the taxonomic groups contributing to these differences have been identified. Considering the current threat posed by kauri dieback disease, further understanding of how these differing communities impact on health of kauri forest fragments and their ability to respond to pathogen invasion is essential. This study acts as a stepping stone for facilitating such future research by being the first to fully characterise the microbial communities of New Zealand's native kauri forests in comparison with those of exotic pine plantations.
Conflicts of interest None declared.
