


ABSTRACT
Soil microbial communities interact with roots, affecting plant growth and nutrient acquisition. In the present study, we aimed to decipher the effects of the inoculants Trichoderma harzianum T-22, Pseudomonas sp. DSMZ 13134, Bacillus amyloliquefaciens FZB42 or Pseudomonas sp. RU47 on the rhizosphere microbial community and their beneficial effects on tomato plants grown in moderately low phosphorous soil under greenhouse conditions. We analyzed the plant mass, inoculant colony forming units and rhizosphere communities on 15, 22, 29 and 43 days after sowing. Selective plating showed that the bacterial inoculants had a good rhizocompetence and accelerated shoot and root growth and nutrient accumulation. 16S rRNA gene fingerprints indicated changes in the rhizosphere bacterial community composition. Amplicon sequencing revealed that rhizosphere bacterial communities from plants treated with bacterial inoculants were more similar to each other and distinct from those of the control and the Trichoderma inoculated plants at harvest time, and numerous dynamic taxa were identified. In conclusion, likely both, inoculants and the rhizosphere microbiome shifts, stimulated early plant growth mainly by improved spatial acquisition of available nutrients via root growth promotion. At harvest, all tomato plants were P-deficient, suggesting a limited contribution of inoculants and the microbiome shifts to the solubilization of sparingly soluble soil P.
INTRODUCTION
Meeting the increasing food demand of a growing world population despite the limited availability of productive agricultural land is a major challenge that will be facing us in the upcoming decades (Carvalho 2006; Yohe et al. 2007). Phosphorus (P) and nitrogen (N) are quantitatively the most important elements for plant growth (Vance 2001), and the low P availability in soils is one of the main reasons for limited agricultural production across the world (Richardson et al. 2011). The intense long-term application of agrochemicals causes environmental and soil health problems (Turan and Sahin 2013; Czarnecki and Düring 2015). Therefore, more environmentally friendly alternatives such as the use of plant growth promoting microorganisms (PGPMs) are discussed to improve the nutrient acquisition of crops, thereby reducing fertilizer requirements (Römheld and Neumann 2006; Turan and Sahin 2013). PGPM inoculants establish positive interactions with plant roots and increase plant growth. Important traits of PGPMs range from the fixation of atmospheric N, N and P mineralization, mobilization of phosphates, production of plant hormones, siderophores to root growth promotion and protection of plants against biotic and abiotic stress factors via induced resistance, stress priming or by suppressing pathogenic microorganisms (Glick 2012; Vacheron et al. 2013; Abbamondi et al. 2016; Venturi and Keel 2016). Many indigenous soil bacteria and fungi are able to promote the growth of plants (Bloemberg and Lugtenberg 2001; Van Loon 2007; Doornbos, van Loon and Bakker 2012; Compant et al. 2019). In various agricultural soils and crops, strains affiliated to Pseudomonas or Bacillus spp. were previously used as inoculants to enhance plant growth and health, but often with variable success (Raaijmakers and Mazzola 2016). Fungal strains such as Trichoderma spp. were also reported to increase plant growth, control plant pathogens, improve plant nutrient uptake and induce systemic resistance in plants (Harman 2006; Mukherjee et al. 2013). An important prerequisite for a successful and broad use of PGPM is a better understanding of the ecology and interactions of PGPMs with the indigenous microbial communities in the rhizosphere and the response of plant to the inoculants. Rhizocompetence, i.e. the ability of inoculants to colonize successfully the rhizosphere, is another prerequisite for inoculant performance (Berg et al. 2017). Root exudates play an important role not only in shaping the microbial community composition in the rhizosphere, but also in influencing the establishment and activity of inoculants (Hartmann, Rothballer and Schmid.2008; Berg and Smalla 2009; Doornbos, van Loon and Bakker 2012; Berg et al. 2017).
In the present study, tomato plants grown in moderate P-limited soils under greenhouse conditions were inoculated with Trichoderma harzianum T-22, Pseudomonas sp. DSMZ 13134, Bacillus amyloliquefaciens FZB42 or Pseudomonas sp. RU47 to allow a comparison of their efficiency. The strains were selected based on their well-documented ability to promote plant growth, P-solubilizing properties, phosphatase activity and arbuscular mycorrhizal helper functions. We hypothesized that the microbial inoculants alter the nutritional status of tomato plants and the mobilization of P in the rhizosphere and might affect the composition of the indigenous bacterial community in the rhizosphere.
MATERIALS AND METHODS
Bacterial and fungal strains
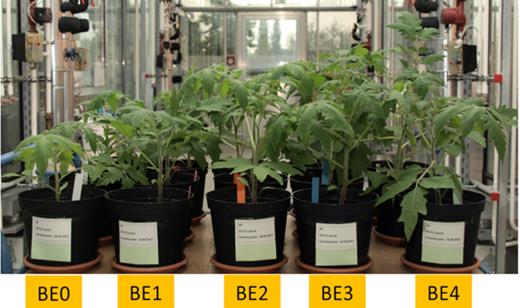
In the greenhouse experiment, four inoculant strains, also termed bioeffectors (Römheld and Neumann 2006) (BE1, BE2, BE3 and BE4), were compared for their effects on the growth of tomato plants growing on a substrate with 50% reduced P fertilization. BE1: Trianum P (Trichoderma harzianum strain T-22; Koppert Biological Systems, Berkel en Rodenrijs, The Netherlands) and BE2: Proradix (Pseudomonas sp. DSMZ 13134; Sourcon-Padena GmbH & Co. KG, Tűbingen, Germany) are commercial products, while BE3: Bacillus amyloliquefaciens FZB42 (FB01 mut1) was a green fluorescent protein-tagged (gfp) strain derived from the commercial product Rhizovital (ABITEP, Berlin, Germany). The preparation procedure of these three strains was previously described by Nebbioso et al. (2016). The final concentrations of the BE1, BE2 and BE3 suspensions were 4.2 × 10⁶ spores, 3.3 × 10⁸ cells and 1 × 10⁹ spores mL−1, respectively. BE4: Pseudomonas sp. RU47 was previously identified based on 16S rRNA gene sequencing as Pseudomonas jessenii RU47 (Adesina et al. 2009), but whole genome sequencing revealed that this strain belongs to the P. koreensis cluster and likely represents a novel distinct species (Kuzmanović et al. 2018). BE4 was red fluorescent protein-tagged (rfp) and obtained by plating the strain on King's B medium (Merck, Darmstadt, Germany) supplemented with 50 µg ml−1 rifampicin, 10 µg ml−1 tetracycline, 100 µg ml−1 ampicillin and 30 µg ml−1 chloramphenicol (M1) and incubated at 28°C for 2 days. The bacterial colonies were collected by resuspending the densely grown colonies with a sterile spatula in sterile NaCl (0.3%). The pellet was centrifuged at 12 000 g for 5 min, washed twice and resuspended in 0.3% sterile NaCl. The cell concentration was adjusted using a spectrophotometer (BioPhotometer plus, Eppendorf, Hamburg, Germany) to an optical density corresponding to 109 cells mL−1.
Soil
The soil used in this experiment was a clay-loam top soil (Luvic Cambisol) of an unfertilized grassland area on the Hohenheim campus (South West Germany) with a low plant-available P content. Soil characteristics were 21.6% clay, 52.2% silt, 26.2% sand; pH (CaCl2): 7.1, Corg: 1.99%, total N: 0.21%, Nmin: 54.8 mg kg−1 soil dry matter/mass (DM); and plant available P (PCAL): 26.6 mg kg−1 soil DM (calcium acetate lactate extraction, VDLUFA 2000). The soil was sieved through a mesh of width 2 mm and mixed with 50% quartz sand (0.2–1.4 mm) weight in weight (W/W) and termed ‘substrate’ in the following. Before establishing the experiment, the substrate was fertilized with Ca(NO3)2, K2SO4, MgSO4 and Ca(H2PO4)2 to reach 100 mg N, 150 mg K, 50 mg Mg and 50 mg P kg−1 substrate dry weight, respectively, which corresponds to ∼50% of the full P fertilization level required for pot experiments with tomatos grown in soils with low P availability (Mpanga et al. 2018). After fertilization, 3-L pots were filled with 2.5 kg of the substrate (dry weight).
Inoculation
Tomato seeds (Lycopersicon esculentum Mill. cv Mobil) were coated by dripping the inoculant suspension onto seeds placed in a 50-mL Falcon tube and vortexing at room temperature. Seeds treated with sterile 0.3% NaCl instead of inoculant suspensions served as the control (BE0). The seeds were directly sown in seedling trays containing the substrate described above. Three seeds per treatment were taken after drying for determining the colony forming units (CFUs) of each BE per seed. Eight days after sowing (DAS), the seedlings were transferred to 3-L pots. Each pot was drenched with 15 mL of the respective inoculant suspensions 10 days after seed inoculation and sowing (2 days after transplanting). Drenching was repeated 17 DAS. Control plants were drenched with the same volume of sterile 0.3% NaCl.
Greenhouse conditions
The greenhouse experiment was performed at 24°C and daylight. If the daylight intensity was below 10 000 lux m−2 between 7 am and 7 pm, plants received an additional 5000 lux m−2 of light (HORTICULTURE MASTER Agro 400W E40 1SL/12, Philips, Hamburg, Germany). Five treatments (BE0, BE1, BE2, BE3, BE4), each with five replicates, were established. Each treatment consisted of 40 pots with 2.5 kg of the substrate. At all sampling times, the DM of roots and shoots was recorded for plants grown in pots planted with one tomato plant (five plants sampled per treatment and time point). Relative growth rates for shoot and root DM production (mg mg−1 d−1) were calculated according to the formula of South (1995): 1/W1 x W2−W1/t2−t1, where W1 and W2 are the DM at the beginning (t1) and end (t2) of the observation period. The remaining 20 pots were planted with three tomato plants and used to investigate the effects of different inoculants on the indigenous rhizosphere bacterial community, mineral uptake by the plant and enzymatic activity in the root-affected soil. Samples were taken 15 (5 days after the first drenching), 22 (5 days after the second drenching), 29 (12 days after the second drenching) and 43 DAS (26 days after the second drenching). At each sampling, destructive sampling of one pot per replicate was done (four replicates per treatment). At the first three sampling times, we used the complete root system of the three plants after vigorous shaking, and processed the samples as described below. At the last sampling time, the first 5 cm of each tomato plant stem was used for the detection of endophytes by selective plating. For nutrient analyses, the aboveground part was dried at 60°C. The soil loosely adhering to the root, removed by vigorous shaking, was used for enzyme analysis, while, per replicate, the complete root system of the three plants with tightly adhering soil was used to obtain the rhizosphere pellet for the extraction of total community (TC) DNA, as described below.
Sampling and sample processing
After removing the soil loosely adhering to the root by vigorous shaking, the root was cut into pieces of length ∼1 cm and carefully mixed, and 5 g was transferred into a Stomacher bag. After adding 15 mL of sterile 0.3% NaCl, the microbial cells were detached from the roots by means of a Stomacher 400 Circulator treatment (Seward Ltd, Worthing, UK) for 1 min at a high speed. The supernatants were collected in Falcon tubes, and the Stomacher treatment step was repeated twice and the combined supernatants (45 mL) of the three Stomacher treatment steps were used for obtaining the rhizosphere microbial pellet by centrifugation after taking an aliquot of 1 mL for plate counts.
Rhizosphere competence determined by plate counts
Serial dilutions of the aliquots of the rhizosphere suspension were immediately plated onto selective media as follows: The CFU of the fungal inoculant (BE1) were determined by plating on potato dextrose agar (Merck, Darmstadt, Germany) supplemented with 1.1 ml L−1 IGEPAL® CA-630 (octylphenoxypolyethoxyethanol) (Sigma, Steinheim, Germany) and 50 µg mL−1 chlortetracyclin (M2). CFU counts for BE2 were determined on King's B medium (Merck, Darmstadt, Germany) supplemented with 100 µg ml−1 cycloheximide, 30 µg mL−1 chloramphenicol and 100 µg mL−1 ampicillin (M3), for BE3 on R2A medium (Merck, Darmstadt, Germany) supplemented with 100 µg mL−1 cycloheximide, 5 µg mL−1 erythromycin and 50 µg ml−1 rifampicin (M4) and for BE4 on M1 (described above) but supplemented with 100 µg mL−1 cycloheximide. Serial dilutions of BE0 were plated onto all selective media (M1, M2, M3 and M4) to determine background growth. CFU counts of the inoculants were determined after two days of incubation at 28°C.
Bacterial internalization
Stem samples between 0 and 5 cm above the soil level were collected at harvest and stored for 2 days at 0–4°C. Samples were surface-sterilized and peeled by rinsing in tap water, 30 s; submergence in 96% ethanol, 1 min; and short flaming, 30 s to remove alcohol, followed by an aseptical peeling of the outside (epidermis) layer using a sterilized scalpel to remove microbial cells and spores adhering to the surface layers. Peeled samples were aseptically transferred to BIOREBA bags with 2 mL water + 0.02% DIECA [N, N-diethyldithiocarbamidacid, sodium salt (to circumvent the oxidative stress of bacterial cells)]. Peeled samples in BIOREBA bags were carefully smashed with a plastic hammer. The extracts obtained were used for serial (10-fold) dilution. Samples from each treatment were plated on their specific media and incubated at 27 °C for maximum two weeks to count the CFU numbers.
Mycorrhizal infection rate
For an analysis of mycorrhization, a modified staining method after Vierheilig et al. (1998) was used. At the final harvest time (43 DAS), roots were cut into segments of 1–2 cm and incubated at 90°C for 45 min in 10% (w/v) KOH. Bleached roots were acidified with 1–3% HCl and then stained in a 5% ink-vinegar solution [5% (v/v) ink in 5% (v/v) acetic acid] at 90°C for 10 min. Destaining was performed with acidified tap water. The grid–line intersection method of Giovanetti and Mosse (1980) was employed to determine the rate of mycorrhization.
Analysis of P, K, Ca, Mg and micronutrients in shoots
For mineral nutrient analysis, oven-dried (60°C) shoot material from the final harvest time (43 DAS) was ground to fine powder (Scheibenschwingmühle TS-100A, Sieb Technik GmbH, Mühlheim-Ruhr, Germany) and ashed in a muffle furnace at 500°C for 4 h. After cooling, the samples were extracted twice with 1 mL of 3.4 M HNO3 and evaporated until dryness to precipitate SiO2. The ash was dissolved in 1 mL of 4 M HCl, subsequently diluted 10 times with hot deionized water and boiled for 2 min to convert meta- and pyrophosphates into orthophosphates. After the addition of 0.1 mL Cs/La buffer (Merck, Darmstadt, Germany) to a 4.9 mL ash solution, Mg2+, Fe2+, Mn2+ and Zn2+ concentrations were determined by atomic absorption spectroscopy (ATI Unicam Solaar 939, Thermo Electron, Waltham, MA, USA). A spectrophotometrical determination of orthophosphate was performed after the addition of molybdate–vanadate color reagent after the method by Gericke and Kurmis (1952). The determination of K+ and Ca2+ was conducted by flame photometry (ELEX 6361, Eppendorf, Hamburg, Germany).
Enzymatic activities
Activities of alkaline phosphomono- and alkaline phosphodiesterase
The activity of phosphomonoesterase (EC 3.1.3.1) in the soil shaken off from the root at harvest time was measured spectroscopically using phenylphosphate (EC 3279-54-7) as the substrate and 2,6-dibromoquinone-4-chloroimide (EC 208-667-1) as the phenol color reagent (Öhlinger 1996). The enzyme activity was calculated in µg phenol g−1 h−1. The activity of alkaline phosphodiesterase (EC 3.1.4.1) was measured spectroscopically using p-nitrophenol phosphate (EC 223-739-2) as the substrate and Tris (hydroxymethyl) aminomethane as the buffer (pH 8) using a modified procedure of Margesin (1996). The enzyme activity was calculated in µg p-nitrophenol g−1 h−1.
Enzymes involved in C-, N- and P-cycling using MUF substrates
The same soil was used to determine the activities of four enzymes involved in C-, N- and P-cycling. Fluorescent 4-methylumbelliferone substrates (4-MUF; Sigma-Aldrich, St. Louis, MO, USA): β-glucosidase (EC 3.2.1.21), β-xylosidase (EC 3.2.1.37), β-N-acetylglucosaminidase (EC 3.2.1.52) and acid phosphomonoesterase (EC 3.1.3.1) were used according to Marx, Wood and Jarvis (2001). The enzyme activities corresponded to an increase in fluorescence and were calculated in nmol MUF g−1 h−1.
Total community DNA extraction
For the cultivation-independent analyses, the remaining rhizosphere microbial fraction was harvested by centrifugation at 15 000 g for 15 min. After discarding the supernatants, the cell pellets were stored frozen at −20°C. TC-DNA was extracted from the rhizosphere pellets using the Bio101 extraction kit (Qbiogene, Carlsbad, CA, USA) after a harsh lysis step using a bead beater Fast prepTM-24 machine (MP Biomedical, Solon, USA). The TC-DNA was purified by the GENECLEAN Spin kit (Qbiogene). DNA yields were estimated after electrophoresis in 1% agarose gels stained with ethidium bromide under UV light in comparison with the 1 kb gene-rulerTM® DNA ladder (Fermentas, St Leon-Rot, Germany) run on the same agarose gel and quantified by a Nanodrop (ND-1000 spectrophotometer, PEQLAB Biotechnologie GmbH, Bayern, Germany). The TC-DNA was diluted with sterile milliQ water 1:10 and then used as a template for the PCR amplification of bacterial 16S rRNA gene fragments, which were analyzed by denaturing gradient gel electrophoresis and 454 sequencing.
Denaturing gradient gel electrophoresis (DGGE)
16S rRNA gene fragments were amplified from 1:10 diluted TC-DNA from rhizosphere samples taken at all sampling times using the bacterial primers F984-GC and R1378, as described by Heuer et al. (1997). PCR amplicons were analyzed by DGGE with the Ingeny PhorU system (Ingeny, Goes, The Netherlands), as described by Weinert et al. (2009), and silver-stained according to Heuer et al. (2001). Fingerprints of samples were compared pairwise, and dendrograms were constructed based on pairwise Pearson correlation coefficients by the unweighted pair group method using arithmetic averages (UPGMA) and GelCompar II 6.5 software (Applied Maths, Sint-Martens-Latem, Belgium). Pearson indices were used to test for significant differences between bacterial community compositions of the rhizosphere of inoculated tomato plants and the control using the PERMTEST software (10 000 simulations), according to Kropf et al. (2004).
Amplicon sequencing by 454
Based on the DGGE analysis, the TC-DNA from tomato rhizosphere samples obtained 29 (BE0, BE4) and 43 DAS (BE0, BE1, BE2, BE3 and BE4) was sent to the Biotechnology Innovation Center (BIOCANT, Cantanhede, Portugal) for barcoded pyrosequencing of the V3/V4 region. PCR reactions, sequencing and prefiltering of the raw data were performed by BIOCANT, as described by Schreiter et al. (2014a). The following analysis of the prefiltered pyrosequence data provided by BIOCANT was done according to Ding, Heuer and Smalla (2012). Only those sequences matching the barcode and primer were selected for BLASTN analysis against the SILVA 16S rRNA gene database. Unpaired regions for each sequence were truncated and sequences of <200 bp were filtered out. In the following analysis, an operational taxonomic unit (OTU)-based approach was used. The sequences were grouped into OTUs based on 97% sequence identity, which is lower than the stated 99% of accuracy of 454 sequencing. OTUs were generated by carrying out the following steps: Sequences were assigned to OTUs using Mothur 1.32 Software based on the SILVA 16S rRNA gene database for alignment and classified with the Naïve Bayesian Classifier (Wang et al. 2007) version 9. Here, we used relative abundance (% of each taxon to mitigate the biases potentially caused by different reads per sample) for community composition analysis. For the identification of responding taxa, we used a generalized linear model for binary data, which considered the error distribution.
Furthermore, ‘R’ (version 2.14) with the add-on package ‘vegan’ was used to analyze the bacterial community composition in the samples from the rhizosphere of tomato plants on 29 and 43 DAS using a nonmetric multidimensional scaling (NMDS) based on the Bray–Curtis similarity. Permanova tests were performed on Bray–Curtis dissimilarity values between each treatment and the control using 10 000 permutations in order to assess the significance of tested factors. Based on the phylogenetic distances, a redundancy analysis (RDA) using seven factors: plant growth, accumulation of macronutrients (P, Mg, K and Ca), activities of alkaline and acid phosphomonoesterases was performed according to Nunes et al. (2016). A Tukey's honestly significant difference test under a generalized linear model via a logistic function for binomial data with the package multcomp (Hothorn, Bretz and Westfal 2008) was performed to identify the discriminative taxa between the corresponding bulk soil and rhizosphere samples, as well as between inoculated and control samples. Bonferroni adjustment was used for the P value < 0.05. Pyrosequence data were deposited at the NCBI Sequence Read Archive under the study accession number PRJNA386582.
Statistical analysis
Levene's test was used to test the homogeneity of variance. Data were analyzed using ANOVA (SPSS version 19.0, IBM). Means and standard deviations of the means were separated using Tukey's HSD test at a significance threshold of P ≤ 0.05.
RESULTS
Tomato seed and rhizosphere colonization by BEs under greenhouse conditions
Seed coating with different inoculants resulted in comparably high CFU counts per seed for all inoculants (log107.8–8.9 CFU seed−1; Table 1). The highest rhizosphere competence measured as the inoculant’s CFU counts was observed for BE4, BE3 followed by BE2 at all sampling times (except for BE4, 43 DAS; Table 1). Only the CFU of BE1 in the rhizosphere decreased with time. The root colonization by BE3 was most stable over time, with about 106 CFU g−1 fresh root. The highest CFU counts were observed for BE4 on 29 DAS, with 107 CFU g−1, and moderately declined on 43 DAS (Table 1). Consistently at all sampling times, no background growth was observed on the four selective media for noninoculated plants (BE0). The fluorescently labeled BE3 (gfp) and BE4 (rfp) were also detected by confocal laser scanning microscopy on 15 DAS, and patchy colonization patterns for both BEs were observed (Fig. S1, Supporting Information).
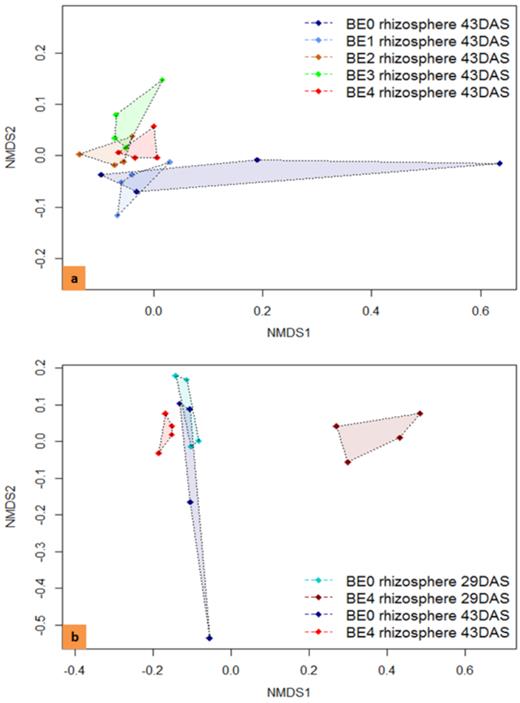
NMDS based on the Bray–Curtis similarity used to analyze the bacterial community composition according to pyrosequencing data. (A) The effect of different BEs on the bacterial community in the rhizosphere of tomato plants on 43 DAS (stress 0.068). (B) The effect of BE4 on 29 and 43 DAS (stress 0.063). BE0: control, BE1: Trianum P (Trichoderma harzianum strain T-22), BE2: Proradix (Pseudomonas sp.), BE3: Bacillus amyloliquefaciens FZB42 (FB01 mut1) derived from Rhizovital, BE4: Pseudomonas sp. RU47 and DAS: days after sowing.
Colonization by different inoculants on tomato seeds and roots. Data in the form of mean log10 CFU ± s.d. (standard deviation).
| Treatments | log10 CFU seed−1 | log10 CFU g−1 fresh root | |||
|---|---|---|---|---|---|
| 15 DAS | 22 DAS | 29 DAS | 43 DAS | ||
| BE1 | 8.4 ± 0.08 | 6.1 ± 0.16 a | 5.3 ± 0.17 b | 4.6 ± 0.07 c | 4.3 ± 0.12 d |
| BE2 | 8.4 ± 0.05 | 5.8 ± 0.09 a | 4.8 ± 0.14 b | 5.7 ± 0.19 a | 4.7 ± 0.53 b |
| BE3 | 7.8 ± 0.12 | 6.5 ± 0.10 b | 6.6 ± 0.07 ab | 6.8 ± 0.14 a | 6.7 ± 0.16 ab |
| BE4 | 8.9 ± 0.01 | 6.9 ± 0.08 b | 6.9 ± 0.11 b | 7.2 ± 0.05 a | 5.8 ± 0.10 c |
BE0: control, BE1: Trianum P (Trichoderma harzianum strain T-22), BE2: Proradix (Pseudomonas sp. DSMZ 13134), BE3: Bacillus amyloliquefaciens FZB42 (FB01 mut1) derived from Rhizovital, BE4: Pseudomonas sp. RU47 and DAS: days after sowing. Data in the same row followed by the same letter(s) were not significantly different according to Tukey's HSD test (P ≤ 0.05). 15 DAS = 5 days after first drenching, 22 DAS = 5 days after second drenching, 29 DAS = 12 days after second drenching and 43 DAS = 26 days after second drenching.
Bacterial internalization
The presence of the inoculants in the endophytic compartment of tomato stems was analyzed by quantifying their recovery after extraction from stems and plating on selective media. While BE1, BE2 and BE4 were not recovered from tomato stems on 43 DAS, BE3 was robustly detected in all five replicate samples with CFUs varying between log10 2.25±0.23 and 3.05±0.34 CFU g−1 fresh weight.
Massive plant growth promotion by bacterial inoculants
The growth of young tomato plants was substantially promoted by the application of the bacterial inoculants used in this study, whereas only a trend for growth improvement was measured for the fungal inoculant BE1 (Fig. 1). Fifteen days after sowing, the root DM of tomato plants was already increased by all inoculants. Forty-three DAS, the root DM was 4- to 5-fold larger in BE3- and BE4-treated plants, while BE2 was less effective and the root DM of BE1-treated plants was not significantly increased compared to BE0. Shoot mass production was stimulated by the BE inoculants in a similar way (Fig. 2), and during the first four weeks, the root-to-shoot DM ratio, which is rapidly changed in response to nutrient limitations (Marschner 2012), was similar for all treatments and ranged between 0.09 and 0.14 (Table S1, Supporting Information). The only exception was recorded for BE1 with a root-to-shoot DM ratio of 0.23 on 15 DAS, indicating a significantly higher root DM production of BE1 compared with the noninoculated control (BE0). In accordance with an increased BE-induced shoot mass production, the relative shoot growth rates between 15 and 29 DAS increased in the order BE0 < BE2 < BE1 < BE4 < BE3 with a similar trend for increased relative root growth (Table S1, Supporting Information).
The effect of different inoculants on the growth of tomato plants grown under reduced P supply at the final harvest time (43 DAS). BE0: control, BE1: Trianum P (Trichoderma harzianum strain T-22), BE2: Proradix (Pseudomonas sp.), BE3: Bacillus amyloliquefaciens FZB42 (FB01 mut1) derived from Rhizovital and BE4: Pseudomonas sp. RU47.
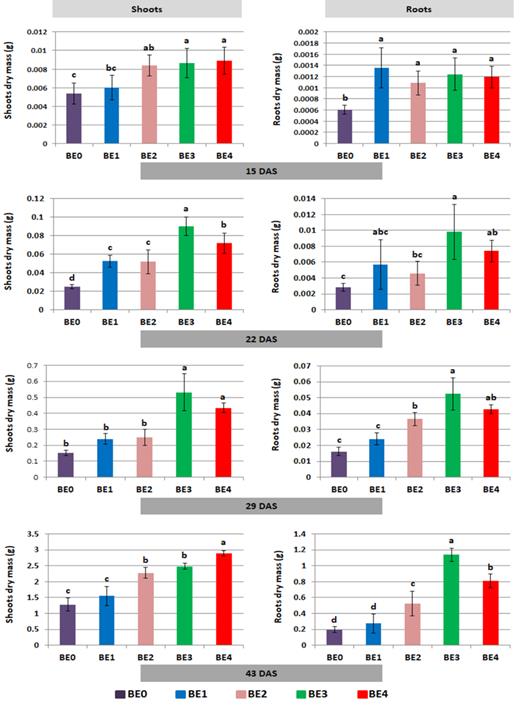
Effect of different inoculants on dry mass (DM) in g of tomato plants on 15, 22, 29 and 43 DAS. BE0: control, BE1: Trianum P (Trichoderma harzianum strain T-22), BE2: Proradix (Pseudomonas sp. DSMZ 13134), BE3: Bacillus amyloliquefaciens FZB42 (FB01 mut1) derived from Rhizovital, BE4: Pseudomonas sp. RU47 and DAS: days after sowing. Data in the same bar graph followed by the same letter(s) were not significantly different according to Tukey's HSD test (P ≤ 0.05). 15 DAS = 5 days after first drenching, 22 DAS = 5 days after second drenching, 29 DAS = 12 days after first drenching and 43 DAS = 26 days after first drenching.
Forty-three DAS, compared with the earlier sampling dates, the root-to-shoot ratio was increased in all treatments but particularly in the BE2–BE4 variants with a significantly higher root mass production (Table S2, Supporting Information). In contrast to the 15–29 DAS sampling period, relative root growth was higher than relative shoot growth and this was particularly pronounced for BE2, BE3 and BE4 treatments (Table S2, Supporting Information). However, the shoot growth rates of the inoculated treatments were similar or even lower as compared with BE0, indicating a shift to the stimulation of root growth and inhibition of shoot growth on 43 DAS. In all treatments, the relative growth rates declined compared to the 15–29 DAS sampling period (Table S2, Supporting Information). At all time points, the DMs were positively correlated with the CFU of the inoculants (Table S3, Supporting Information).
Analysis of P, K, Ca, Mg and micronutrients in shoots
Analysis of the mineral nutrient concentrations in the shoot tissue of the tomato plants 43 DAS revealed no significant treatment-dependent differences (Table 2). However, for the macroelement P and the micronutrients Zn, Fe and Mn, the control plants (BE0) showed a tendency for higher mineral concentrations in the shoot DM. In all treatments, P was below the deficiency threshold of 2.5 mg g−1 DM, while all other nutrients were sufficient (Bergmann 1988) (Table 2), in agreement with the moderately low P soil characteristics and the fact that all other nutrients were fertilized at sufficient levels. However, with respect to the shoot accumulation per plant, the treatments BE2, BE3 and BE4 increased the P, Mg, Ca and K content in comparison to the untreated control BE0 (Table 2). For the micronutrients (Zn, Mn and Fe), only the Mn accumulation in treatment BE4 was significantly higher compared to the control BE0 (Table 2). Overall, the nutrient shoot content per plant was increased in the order BE0 < BE1 < BE2 < BE3 < BE4, which was closely correlated with the inoculant-induced promotion of plant DM production.
Mineral nutrient concentrations in tomato shoots for different treatments on 43 DAS. Data in the form of mean nutrient concentrations ± s.d. (standard deviation).
| Treatments | mg/ | BE0 | BE1 | BE2 | BE3 | BE4 | Status* |
|---|---|---|---|---|---|---|---|
| Nutrients | |||||||
| P | g shoot DM | 2.05 ± 0.46 a | 1.87 ± 0.13 a | 1.79 ± 0.20 a | 1.89 ± 0.07 a | 1.73 ± 0.24 a | Low |
| Plant | 2.60 ± 0.60 b | 2.94 ± 0.76 b | 4.05 ± 0.47 a | 4.70 ± 0.27 a | 4.98 ± 0.66 a | ||
| Mg | g shoot DM | 8.23 ± 1.18 a | 8.76 ± 0.61 a | 7.51 ± 1.08 a | 7.53 ± 0.34 a | 7.75 ± 0.60 a | Sufficient |
| Plant | 10.66 ± 2.90 d | 13.63 ± 2.76 cd | 17.10 ± 3.13bc | 18.68 ± 1.11ab | 22.43 ± 2.06 a | ||
| Ca | g shoot DM | 21.67 ± 3.69 a | 22.10 ± 1.49 a | 20.72 ± 2.23 a | 20.01 ± 1.46 a | 22.06 ± 3.95 a | Sufficient |
| Plant | 28.16 ± 8.99 c | 34.43 ± 7.44 bc | 47.20 ± 7.31b | 49.63 ± 4.24 ab | 63.95 ± 12.72 a | ||
| K | g shoot DM | 36.67 ± 4.73 ab | 32.75 ± 1.35 b | 36.70 ± 3.36 ab | 38.66 ± 3.08 a | 38.26 ± 1.67 ab | Sufficient |
| Plant | 46.42 ± 5.40 c | 51.10 ± 11.40 c | 83.11 ± 4.78 b | 95.94 ± 9.20 ab | 110.70 ± 7.06 a | ||
| Mn | g shoot DM | 0.06 ± 0.02 a | 0.06 ± 0.01 a | 0.05 ± 0.01 a | 0.04 ±0.01 a | 0.05 ±0.01 a | Sufficient |
| Plant | 0.08 ± 0.04 b | 0.09 ± 0.02 ab | 0.11 ± 0.03 ab | 0.10 ± 0.02 ab | 0.14 ± 0.02 a | ||
| Fe | g shoot DM | 0.31 ± 0.28 a | 0.28 ± 0.26 a | 0.18 ± 0.07 a | 0.19 ± 0.15 a | 0.13 ± 0.02 a | Sufficient |
| Plant | 0.39 ± 0.36 a | 0.43 ± 0.40 a | 0.40 ± 0.13 a | 0.46 ± 0.36 a | 0.38 ± 0.05 a | ||
| Zn | g shoot DM | 0.04 ± 0.02 a | 0.04 ±0.01 a | 0.04 ± 0.01 a | 0.03 ± 0.01 a | 0.03 ± 0.00 a | Sufficient |
| Plant | 0.06 ± 0.03 a | 0.06 ± 0.01 a | 0.09 ± 0.03 a | 0.07 ± 0.02 a | 0.09 ± 0.01 a |
Nutritional status according to Bergmann (1988).
DM: dry mass, BE0: control, BE1: Trianum P (Trichoderma harzianum strain T-22), BE2: Proradix (Pseudomonas sp. DSMZ 13134), BE3: Bacillus amyloliquefaciens FZB42 (FB01 mut1) derived from Rhizovital, BE4: Pseudomonas sp. RU47 and DAS: days after sowing. Data in the same row followed by the same letter(s) were not significantly different according to Tukey's HSD test (P ≤ 0.05).
Mycorrhization
A relatively high arbuscular mycorrhization was detected across all samples at 43 DAS. The percentage of root length infected with arbuscular mycorrhizal fungi (AMF) ranged between 38.6 ± 6.8, 41.9 ± 5.7, 46.0 ± 7.3, 51.2 ± 6.5 and 46.3 ± 6.3% for BE0, BE1, BE2 BE3 and BE4, respectively.
Enzymatic activities in the rhizosphere
Whether the plant growth promotion by the inoculants can be explained by higher activities of enzymes involved in P-cycling, such as alkaline phosphomono-, phosphodiesterase and acid phosphomonoesterase, was tested in root-affected soil at final harvest. Furthermore, activities of enzymes involved in nitrogen and carbon cycling, such as N-acetyl-glucosaminidase, β-xylosidase and β-glucosidase, were measured (Table 3). The rhizosphere enzyme activities for alkaline phosphomonoesterase increased in BE1, BE2 and BE3 compared to control. Acid phospomonoesterase activity was higher in the rhizosphere of the BE3 and BE4 treatments (Table 3).
Activities of enzymes in root-affected soil of different treatments at the final harvesting time (43 DAS). Data in the form of mean enzymatic activity ± s.d. (standard deviation).
| Enzyme activity | Treatment | ||||
|---|---|---|---|---|---|
| BE0 | BE1 | BE2 | BE3 | BE4 | |
| Alkaline phosphomonoesterase (µg phenol g−1 DM 3h−1) | 645 ±63 c | 869 ±56 a | 805 ±26 ab | 822 ±61 ab | 744 ±65 bc |
| Alkaline phosphodiesterase (µg p-nitrophenol g−1 DM h−1) | 94 ±19 a | 112 ±22 a | 114 ±27 a | 113 ±19 a | 112 ±38 a |
| Acid phosphomonoesterase (nmol MUF g−1 DM h−1) | 101 ±63 b | 151 ±29ab | 208 ±115 ab | 262 ±76 a | 246 ±73 a |
| β-glucosidase (nmol MUF g−1 DM h−1) | 215 ±16 a | 329 ±49 a | 301 ±103 a | 299 ±70 a | 293 ±48 a |
| β-Xylosidase (nmol MUF g−1 DM h−1) | 20 ±4 a | 35 ±7 a | 36 ±17 a | 37 ±8 a | 33 ±7 a |
| N-acetyl-glucosaminidase (nmol MUF g−1 DM h−1) | 44 ±13 b | 62 ±13 ab | 60 ±21 ab | 73 ±16 ab | 75 ±12 a |
BE0: control, BE1: Trianum P (Trichoderma harzianum strain T-22), BE2: Proradix (Pseudomonas sp.), BE3: Bacillus amyloliquefaciens FZB42 (FB01 mut1) derived from Rhizovital, BE4: Pseudomonas sp. RU47 and DAS: days after sowing.
Data in the same row followed by the same letter(s) were not significantly different according to Tukey's HSD test (P ≤ 0.05).
Effects of inoculant-dependent differences on the bacterial community composition revealed by DGGE
The effect of the inoculants on the bacterial community composition in the tomato rhizosphere was initially assessed for all sampling times by DGGE of 16S rRNA gene fragments amplified from TC-DNA. Significant differences between the fingerprints of the controls and the treatments at all sampling times were revealed. Data are shown for 29 DAS (Fig. 3A and B) and 43 DAS (Fig. S2A and B, Supporting Information), while data for 15 and 22 DAS were not shown. Twenty-nine DAS, the DGGE fingerprints of the bacterial community of rhizosphere samples showed several bands specific for the BE4 treatment (Fig. 3A), while most of the bands were shared among all treatments 43 DAS (Fig. S2A, Supporting Information). Cluster analysis (UPGMA of Pearson's correlation indices) of the bacterial DGGE profiles on 29 DAS revealed a strong transient shift caused by BE4 in the composition of the rhizosphere bacterial community, visible as a separate cluster sharing only 44% similarity with the other samples (Fig. 3B). In addition, the fingerprints of the BE3 treatment formed a distinct cluster, while the fingerprints of all others shared higher similarities and did not form treatment-dependent UPGMA clusters. Twenty-nine DAS, significant differences between the DGGE fingerprints of the rhizosphere of control plants (BE0) and those of inoculated plants by BE1, BE2, BE3 and BE4 were found, with d-values of 10.7, 18.6, 14.1 and 40.9, respectively.
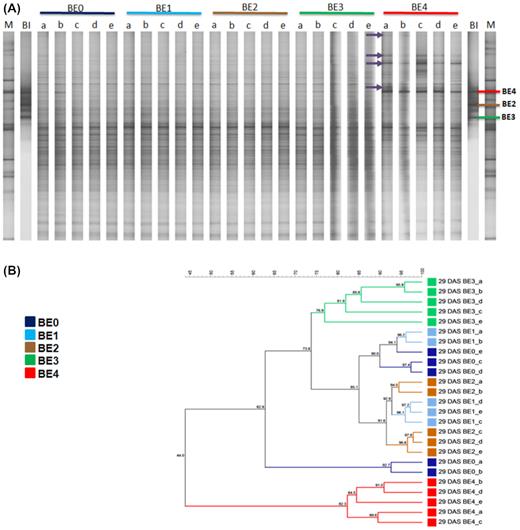
DGGE fingerprints (A) of bacterial 16S rRNA gene fragments from total community DNA obtained from the tomato rhizosphere 29 DAS. The corresponding UPGMA dendrogram (B) is based on Pearson’s similarity matrix. The five replicates of treatments BE0, BE1, BE2, BE3 and BE4 are indicated by a, b, c, d and e. BE0: control, BE1: Trianum P (Trichoderma harzianum strain T-22), BE2: Proradix (Pseudomonas sp.), BE3: Bacillus amyloliquefaciens FZB42 (FB01 mut1) derived from Rhizovital, BE4: Pseudomonas sp. RU47, DAS: days after sowing, BI: bacterial inoculants and M: marker (Heuer et al. 1997). Purple arrows indicating to bands were increased in the rhizosphere of inoculated tomato plants with BE4.
In contrast, the UPGMA analysis of the DGGE fingerprints for samples taken 43 DAS revealed that treatments with bacterial BEs (BE2, BE3, BE4) were distinct from the clusters of the BE0 and BE1 treatments that shared about 75% similarity (Fig. S2B, Supporting Information). The permutation test of the bacterial community fingerprints revealed highly significant differences between the fingerprints of BE0 and treatments BE2, BE3 or BE4, with d-values 18.32, 15.21 and 12.76, respectively. In contrast, the fingerprints of the BE0 and BE1 treatments revealed only low, but still significant differences with d-value 6.37. The calculated d-values indicated highest, but transient differences in the rhizosphere bacterial communities of tomato plants inoculated with BE4, compared to control (BE0) plants 29 DAS. These differences were lower in the case of inoculation with BE1, BE2 and BE3 compared to the control at this time point. Twenty-nine and 43 DAS, the effect of the fungal BE1 on the bacterial community composition was the weakest. Interestingly, despite the striking effects of BE4 on 29 DAS, the difference between the fingerprints of BE4 and BE0 was small again on 43 DAS.
Amplicon sequencing of 16S rRNA gene fragments amplified from TC-DNA from rhizosphere samples
The 16S rRNA gene amplicons from TC-DNA from the rhizosphere and bulk soil samples taken at two different time points were sequenced to get further information on the changes in the bacterial community composition. Altogether, 297 223 sequences from 36 samples were affiliated to 21 phyla, 65 classes, 104 orders, 202 families, 425 genera and 10 401 OTUs, at a level of 97% sequence identity. Dominant phyla, defined as those with more than 1% relative abundance, were at both time points Proteobacteria, Actinobacteria, Firmicutes, Acidobacteria and Bacteriodetes, both in the bulk soil (BE0) and the rhizosphere of all treatments.
The sequence analysis of rhizosphere samples on 43 DAS revealed diverse effects of each inoculant on the relative abundance of dominant phyla and classes. In general, these effects were not pronounced, but statistically significant. At the phylum level, Proteobacteria were increased by the BE1 treatment, while all BEs increased the relative abundance of Bacteroidetes (Table 4). In contrast, the relative abundance of Actinobacteria was reduced by all BEs (Table 4). At the class level, all inoculants increased the relative abundance of Betaproteobacteria and Sphingobacteria (Bacteriodetes). Moreover, the bacterial inoculants BE2, BE3 and BE4 increased the relative abundance of Deltaproteobacteria, while Gammaproteobacteria were increased by BE1 (Table 4).
Effect of different inoculants on the relative abundance (in %) of dominant phyla and classes in the rhizosphere of tomato plants on 43 DAS obtained by pyrosequencing. Data in the form of relative abundance ± s.d. (standard deviation).
| Phyla | Class | Relative abundance (in %) | ||||
|---|---|---|---|---|---|---|
| BE0 | BE1 | BE2 | BE3 | BE4 | ||
| Proteobacteria | 37.3±3 b | 42.1±4 a | 37.9±2 b | 38.8±1 b | 37.9±1 b | |
| Alphaproteobacteria | 21.3±2 a | 20.7±0 a | 19.1±2 b | 18.4±3 b | 18.3±0 b | |
| Betaproteobacteria | 4.9±1 c | 6.7±0 a | 6±1 b | 7.3±2 a | 6.7±1 a | |
| Gammaproteobacteria | 6.9±1 b | 9.7±4 a | 7.2±0 b | 7.3±1 b | 6.6±1 b | |
| Deltaproteobacteria | 3.1±0 c | 3.6±1 c | 4.3±0 a | 4.4±0 a | 4.9±1 b | |
| Actinobacteria | 28.8±2 a | 23.6±2 b | 24.6±3 b | 20.2±3 c | 24±2 b | |
| Firmicutes | 4.9±1 b | 6±1 a | 5.7±1 ab | 5.3±1 b | 6.1±1 a | |
| Acidobacteria | 6.4±1 b | 6.2±1 b | 7.5±1 a | 6.9±1 b | 7.4±0 a | |
| Bacteroidetes | 5.4±1 d | 6.9±1 c | 8.2±1 b | 9.9±2 a | 7.3±1 c | |
| Sphingobacteria | 2.7±0 b | 3.7±1 a | 4.5±0 a | 4.2±1 a | 4±1 a | |
BE0: control, BE1: Trianum P (Trichoderma harzianum strain T-22), BE2: Proradix (Pseudomonas sp. DSMZ 13134), BE3: Bacillus amyloliquefaciens FZB42 (FB01 mut1) derived from Rhizovital, BE4: Pseudomonas sp. RU47 and DAS: days after sowing. Significant taxa in the rhizosphere samples identified by Tukey's test under a generalized linear model via logistic function for binomial data. 43 DAS = 26 days after first drenching. Bold indicates significantly higher values.
Genera with an increased or decreased relative abundance compared to the control belonged to all major phyla (Table 5). Overall, common increases of certain phyla, especially driven by the bacterial inoculants, as well as genus-specific changes were detected. Interestingly, the genus Paenibacillus was enriched in the BE1, BE2 and BE4 treatments (Table 5), while Azospirillum, Acidovorax, Pseudomonas, SphingobiumandArthrobacter were increased by the fungal BE1. In contrast, Acquicella, Lysobacter and GP5 were significantly enhanced in all treatments with bacterial BEs (Table 5). Interestingly, despite the repeated inoculation with Pseudomonas and Bacillus strains, these genera were not more abundant in the respective treatments on 43 DAS. Among the acidobacterial genera, only Gp3 revealed a significantly increased relative abundance in all inoculated treatments (Table 5). Moreover, BE4-specific sequences were identified on 29 DAS and a few on 43 DAS. Also, a few BE3 were detected on 43 DAS (Table S5, Supporting Information).The NMDS revealed that the bacterial community composition in the BE2, BE3 and BE4 rhizospheres was distinct from BE0 and BE1 on 43 DAS (Fig. 4A). This is consistent with the individual PERMANOVA results: BE1 was not significant (P = 0.1035), while BE2, BE3 and BE4 had significant effects with P = 0.0379, 0.0209 and 0.07189, respectively (Table 6). In addition, the NMDS analyses showed that the bacterial community composition in the rhizosphere of BE4 inoculated plants was surprisingly distinct 29 and 43 DAS (Fig. 4B), indicating a transient effect of the inoculation with BE4. This was also confirmed by the PERMANOVA analysis, as the effect of BE4 on 29 DAS was significant with P = 0.0237 (Table 6).
Relative abundance (RA) in % of bacterial genera and fold increase or decrease on 43 DAS obtained by pyrosequencing. Data in the form of relative abundance ± s.d. (standard deviation).
| Phyla | Genus | BE0 | BE1 | BE2 | BE3 | BE4 | ||||
|---|---|---|---|---|---|---|---|---|---|---|
| RA % | F | RA % | F | RA % | F | RA % | F | |||
| Proteobacteria | Azospirillum | 0.1±0 b | 0.5±0 a | 5 | 0.5±1 a | 5 | 0.1±0 b | 1 | 0.2±0 b | 2 |
| Acidovorax | 0.4±0 b | 0.9±0 a | 2.3 | 0.6±0 b | 1.5 | 0.6±0 b | 1.5 | 0.6±0 b | 1.5 | |
| Aquicella | 0.1±0 c | 0.2±0 bc | 2 | 0.3±0 b | 3 | 0.5±0 a | 5 | 0.3±0 b | 3 | |
| Lysobacter | 1.1±0 b | 1±0 b | 0.9 | 1.7±0 a | 1.5 | 1.3±0 a | 1.2 | 1.5±0 a | 1.4 | |
| Peredibacter | 0.1±0 b | 0.2±0 b | 2 | 0.3±0 b | 3 | 0.2±0 b | 2 | 0.6±0 a | 6 | |
| Pseudomonas | 0.3±0 c | 3.1±4 a | 10.3 | 0.5±0 b | 1.7 | 0.3±0 c | 1 | 0.6±0 b | 2 | |
| Pseudoxanthomonas | 0.2±0 b | 0.3±0 b | 1.5 | 0.3±0 ab | 1.5 | 0.5±0 a | 2.5 | 0.2±0 b | 1 | |
| Rheinheimera | 1±1 a | 0.6±1 b | 0.6 | 0.1±0 c | 0.1 | 0.1±0 c | 0.1 | 0.1±0 c | 0.1 | |
| Sphingobium | 1.7±1 b | 2.5±0 a | 1.5 | 1.4±1 c | 0.8 | 2±1 b | 1.2 | 1.2±0 d | 0.7 | |
| Actinobacteria | Agromyces | 1±0 a | 0.3±0 b | 0.3 | 0.5±0 b | 0.5 | 0.3±0 b | 0.3 | 0.4±0 b | 0.4 |
| Arthrobacter | 1.7±1 b | 3.1±1 a | 1.8 | 1.7±1 b | 1 | 0.7±0 d | 0.4 | 1.1±0 c | 0.6 | |
| Mycobacterium | 0.6±0 a | 0.1±0 b | 1.7 | 0.1±0 b | 0.2 | 0.1±0 b | 0.2 | 0.1±0 b | 0.2 | |
| Firmicutes | Bacillus | 2.4±1 ab | 2.8±1 ab | 1.2 | 2.8±1 ab | 1.2 | 2.7±1 b | 1.1 | 3.2±0 a | 1.3 |
| Paenibacillus | 0.6±0 b | 1.2±0 a | 2 | 1±0 a | 1.7 | 0.7±0 ab | 1.2 | 1±0 a | 1.7 | |
| Acidobacteria | Gp3 | 0.5±0 c | 0.7±0 b | 1.4 | 1±0 a | 2 | 0.7±0 ab | 1.4 | 0.9±0 a | 1.8 |
| Gp4 | 0.7±0 b | 1.1±0 a | 1.6 | 1.2±0 a | 1.7 | 1±0 ab | 1.4 | 1.2±0 a | 1.7 | |
| Gp5 | 0.3±0 b | 0.3±0 b | 1 | 0.5±0 a | 1.7 | 0.7±0 a | 2.3 | 0.5±0 a | 1.7 | |
| Gp6 | 1.8±1 a | 1.4±0 b | 0.8 | 1.7±0 ab | 0.9 | 1.8±0 a | 1 | 1.6±0 ab | 0.9 | |
| Gp16 | 1.4±0 a | 1±0 b | 0.7 | 1.1±0 ab | 0.8 | 0.8±0 b | 0.6 | 1±0 b | 0.7 | |
| Bacteroidetes | Pedobacter | 0.1±0 b | 0.2±0 b | 2 | 0.5±0 a | 5 | 0.1±0 b | 1 | 0.2±0 b | 2 |
| Gemma-timonadetes | Gemmatimonas | 0.7±0 b | 0.7±0 ab | 1 | 0.9±0 a | 1.3 | 0.9±0 a | 1.3 | 0.8±0 ab | 1.1 |
| Nitrospira | Nitrospira | 0.5±0 b | 0.5±0 b | 1 | 0.6±0 ab | 1.2 | 0.6±0 ab | 1.2 | 0.8±0 a | 1.6 |
BE0: control, BE1: Trianum P (Trichoderma harzianum strain T-22), BE2: Proradix (Pseudomonas sp. DSMZ 13134), BE3: Bacillus amyloliquefaciens FZB42 (FB01 mut1) derived from Rhizovital, BE4: Pseudomonas sp. RU47, RA: relative abundance, F: fold increased or decreased (increased RA is >1; decrease < 1) and DAS: days after sowing. Significant genera in the rhizosphere samples identified by Tukey's test under a generalized linear model via logistic function for binomial data. Bold indicates significantly higher.
PERMANOVA on Bray–Curtis dissimilarity profiles of the rhizosphere bacterial communities.
| Factors tested | r2 | P | Significant | |
|---|---|---|---|---|
| BE1 43 DAS | 1: B1 effect | 0.18712 | 0.1035 | – |
| 2: Replicate effect | 0.13595 | 0.3846 | – | |
| 1:2 | 0.16258 | 0.2080 | – | |
| Residual | 0.51435 | |||
| BE2 43 DAS | 1: B2 effect | 0.21449 | 0.0379 | * |
| 2: Replicate effect | 0.14735 | 0.2699 | – | |
| 1:2 | 0.14406 | 0.2801 | – | |
| Residual | 0.49410 | |||
| BE3 43 DAS | 1: B3 effect | 0.21424 | 0.02090 | * |
| 2: Replicate effect | 0.19113 | 0.09029 | . | |
| 1:2 | 0.12026 | 0.43316 | – | |
| Residual | 0.47437 | |||
| BE4 43 DAS | 1: B4 effect | 0.18612 | 0.07189 | . |
| 2: Replicate effect | 0.16512 | 0.19718 | – | |
| 1:2 | 0.13836 | 0.35986 | – | |
| Residual | 0.51040 | |||
| BE4 29 DAS | 1: B4 effect | 0.42487 | 0.0237 | * |
| 2: Replicate effect | 0.08890 | 0.4917 | – | |
| 1:2 | 0.08072 | 0.5876 | – | |
| Residual | 0.40552 |
Significant codes (***: P < 0.001; **: P < 0.01; *: P < 0.05; .: P < 0.1; –: P > 0.1).
0 < P< 0.1: significant effect and P > 0.1: no significant effect.
Finally, the variation within bacterial communities, enzyme activities, macronutrient contents and total plant DM on 43 DAS is shown in a redundancy analysis plot. This confirmed that the BE0 and BE1 rhizosphere samples were more similar, while the rhizosphere communities after bacterial inoculations were distinct. The plant DM, nutrient content and the activities of alkaline phosphomonoesterase and acid phosphomonoesterase were positively correlated with bacterial BE treatments (Fig. 5).
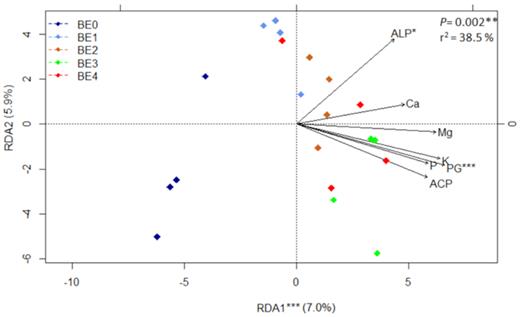
Redundancy analysis (RDA) biplot of bacterial diversity and seven parameters (PG: plant growth, concentration P, Mg, K, Ca, per plant; ALP: activity of alkaline phosphomonoesterase and ACP: activity of acid phosphomonoesterase) at the last sampling time (43 DAS). BE0: control, BE1: Trianum P (Trichoderma harzianum strain T-22), BE2: Proradix (Pseudomonas sp.), BE3: Bacillus amyloliquefaciens FZB42 (FB01 mut1) derived from Rhizovital and BE4: Pseudomonas sp. RU47. The significance of the model, axes and factors was determined by ANOVA. Stars stand for the level of significance according to the code: (*) 0.05 ≤ P< 0.01; (**) 0.01 ≤ P < 0.001; (***) P ≤ 0.001.
DISCUSSION
The present study compared the growth promotion of tomato plants grown in a soil with moderate P fertilization by four different BEs affiliated to Trichoderma (BE1), Bacillus (BE3) and Pseudomonas (BE2, BE4). In these greenhouse experiments, the different bacterial inoculants massively, but similarly promoted plant growth, especially in a most sensitive phase after around three weeks of growth, while the fungal strain was less efficient.
Rhizocompetence of the selected inoculants
High rhizocompetence, as also reported in previous studies (BE1: Harman 2000; Ozbay, Newman and Brown 2004; Sofo, Milella and Tataranni 2010, BE2: Buddrus-Schiemann et al. 2010; Fröhlich et al. 2012, BE3: Fan et al. 2012; Chowdhury et al. 2013; Borriss 2015, BE4: Schreiter et al. 2014b, 2018), was confirmed for all bacterial inoculants in the rhizosphere of tomato plants grown on the substrate with moderate P supply (Table 1). The inoculant CFU counts in the rhizosphere were positively correlated with the plant growth-promoting effects. Interestingly, BE3 was the only BE that was detected internally in the stem of tomato plants, although endophytic colonization was previously reported for many Trichoderma and Pseudomonas strains (Harman et al. 2004; Ryan et al. 2008). The detection of BE3 cannot be explained by the ethanol and heat resistance of spores present on the outside of the stems because all stem samples were peeled. These data show that BE3 cells were capable to create or find openings in tomato roots from where they further invaded the interior tissue of tomato plants.
Mechanisms of inoculant-induced plant growth promotion
Potential mechanisms through which these inoculants improve plant growth, including volatile production, with plant growth-promoting potential, were reported for B. amyloliquefaciens FZB42 (Borriss 2011) and also for strains of Pseudomonas and Trichoderma (Kuzmanoviv et al. 2018; Sharifi and Ryu 2018). An increase in indole acetic acid (IAA) and in the auxin/cytokinin ratios in leaves and roots was previously shown for BE1 inoculation (Sofo, Milella and Tataranni 2010), and IAA production has been reported also for BE2, BE3 and BE4 (Kuzmanovic et al. 2018). Moreover, a high P solubilizing activity on artificial growth media was reported for BE1, BE2, BE3 and BE4 (Nkebiwe, Neumann and Müller 2017; Kuzmanovic et al. 2018).
Growth promotion via phytohormonal effects rather than P solubilization appears to be the most reasonable mechanism for the DM increase, as the shoot P concentrations on 43 DAS were not recovered above the deficiency threshold by any BE (Bergmann 1988). The BE3- and BE4-treated plants tended to be even more severely P deficient than the control (Table 2) at final harvest, although the total accumulation of P and all other macronutrients in the shoot tissue was significantly increased. This general inoculant effect on nutrient accumulation, correlated with increased root DM production (Fig. 2), points to an improved spatial acquisition of available soil nutrients via inoculant-induced plant growth promotion. However, any surplus of nutrient uptake was immediately transformed into DM production, finally leading to the dilution of the P tissue concentrations supplied in a suboptimal dosage (50% reduction). A limited P-mobilizing potential in the rhizosphere has also been similarly reported for BE1, BE2 and BE3 used as inoculants for wheat (Lekfeldt et al. 2016) and maize (Thonar et al. 2017) supplied with sparingly soluble P sources on low-P soils.
AMF also improve spatial P acquisition by expanding the root–soil interception area (Marschner 2012). The AMF colonization of plant roots was reported to be promoted by mycorrhizal helper bacteria (MHB), such as various Pseudomonas sp. and P. fluorescens strains (Frey-Klett, Garbaye and Tarkka 2007), and this property has been previously demonstrated also for BE2 (Proradix) and BE3 (Thonar et al. 2017). In the present study, although the percentage of AMF-infected root length ranging from 40–50% was not significantly increased by the inoculants, the massive 4–5-fold increase in root growth of inoculated tomato plants (Fig. 2) obviously provided numerous additional AMF infection sites, finally leading to a better soil exploitation and improved nutrient acquisition with a larger AMF-infected root system.
As extracellular enzymes of plant and microbial origins contribute to the availability of nutrients to the plant, we measured the respective enzyme activities in root-affected soil on 43 DAS. The increased alkaline phosphomonoesterase activity for BE1, BE2 and BE3 compared to BE0 (Table 3) suggests an accelerated excretion of P-cycling enzymes by the microbial community in the respective BE treatment, e.g. the increased relative abundance of the genus Paenibacillus (Table 5). The direct identification of the source of alkaline phosphomonoesterase activity, however, would require the analysis of the functional gene expression of phosphomonoesterases (e.g. Bergkemper et al. 2016). At least in the BE3 and BE4 treatments, the activity of acid phosphomonoesterase was increased, potentially also due to an additional release of acid phosphomonoesterases by the larger root system in the BE3- and BE4-treated tomato plants (Table 3), as also reported for P-limited tomato plants by Suen, Zhang and Sun (2015). This release of plant-derived acid phosphatases might be specifically important under conditions of P limitation for the acquisition of organic soil P (Table 3; Wang et al. 2016), but the effect was obviously not sufficient to overcome the P limitation at the last sampling date. No significant differences were recorded for enzymes involved in C- and N-cycling of plant-derived organic compounds. Interestingly, inoculation with the two Pseudomonas strains BE2 and BE4 revealed the highest Mn accumulation in the plant tissue. This may reflect bacterial Mn mobilization, as Mn3+ reduction in soils is a widespread feature particularly of plant growth-promoting Pseudomonas strains (Rengel, Ross and Hirsch 1998).
Inoculant-induced shifts of the bacterial community in the rhizosphere
Amplicon-sequencing data of 16S rRNA gene fragments amplified from TC-DNA identified specific and common effects of BEs on the bacterial community composition on 43 DAS.
At the last sampling date (43 DAS), the rhizosphere bacterial communities of tomato plants treated with bacterial inoculants (BE2, BE3, BE4) showed a separate clustering by UPGMA for DGGE fingerprints and NMDS for amplicon sequences distinct from the BE1 and BE0 treatments, which correlated with plant growth promotion, macronutrient accumulation, alkaline and acid phosphomonoesterases. Amplicon sequencing and DGGE analysis confirmed that the inoculant strains did not belong to the dominant bacterial populations except for BE4 on 29 DAS. Here, selective plating, DGGE and amplicon sequencing revealed a high abundance of BE4 in the tomato rhizosphere and that the bacterial community compositions of BE4 were significantly different from those of BE0. Forty-three DAS, significant differences were detected for BE2 vs BE0, BE3 vs BE0 and BE4 vs BE0. Thus, the pronounced BE4-induced shifts observed on 29 DAS were clearly transient (Table S4, Supporting Information). Very interestingly, all inoculants increased the relative abundance of the genus Paenibacillus 43 DAS. In addition, also the relative abundance of Bacillus was increased in the rhizosphere of BE4-treated tomato plants. Strains belonging to both genera are often plant-beneficial bacteria that can enhance plant growth and health by different mechanisms, such as improved plant-nutrient supply, root growth promotion and antagonism against soil-borne diseases, or induction of systemic resistance (Van Loon 2007; Govindasamy et al. 2010; Shafi, Tian and Ji 2017). It is possible that the increased relative abundance of Paenibacillus has contributed to the plant growth promoting effect observed. Schreiter et al. (2014c) reported soil-type-dependent effects of RU47 on the rhizosphere microbiome of lettuce under field conditions, and, remarkably, also in their study, the genus Paenibacillus was significantly enhanced in relative abundance in the rhizosphere of RU47-inoculated lettuce plants grown in an alluvial loam. In the present study, although not only a different plant species, but also a different soil was used, Paenibacillus and Bacillus were stimulated in response to BE4 (RU47) inoculation.
CONCLUDING REMARKS
In conclusion, our greenhouse study revealed that three different bacterial inoculants caused similar, massive growth promotion and overlapping rhizosphere community changes of tomato plants. This was largely correlated with the ability of the inoculants to colonize the rhizosphere of tomato plants (rhizocompetence), as determined by selective plating. Although DNA fingerprints indicated that the inoculants did not belong to the dominant bacterial community populations (except BE4 on 29 DAS), the inoculants improved root and shoot growth and shoot nutrient accumulation. These effects were obviously independent of the plant nutritional status and already promoted seedling establishment during the first four weeks after sowing. At this stage, plant growth was limited by root development for the exploitation of the available soil volume but not by nutrient limitations, as indicated by constant root-to-shoot ratios and the analysis of the nutritional status. During the last two weeks of the culture period, P limitation emerged as a growth-limiting factor due to the reduced P supply. Now, the bacterial inoculants promoted natural plant adaptations to P deficiency, such as a preferential stimulation of root growth and secretion of acid phosphatases with impact on soil microbial communities, as indicated, e.g. by an increased recruiting of native AMF for the colonization of the larger root system.
The limitations related to P availability at the end of the culture period should not represent an issue under real production conditions, when inoculated nursery plants are transplanted to the greenhouse or the open field without any limitation of the rooting space. Accordingly, in recent large-scale tomato greenhouse and open field production trials, using the same inoculants (BE1–BE3) and the same inoculation schemes (easily applicable under practice conditions by the use of fertigation systems) in combination with organic fertilizers revealed significant and reproducible effects on tomato yield and fruit quality (Neumann 2017; Bradacovaet al. 2019).
FUNDING
This work was supported by the European Community's Seventh Framework Program 662 (FP7/2007–2013) under Grant Agreement no 312117 (BIOFECTOR). NE, LvO, DN and NW were financed by BIOFECTOR.
ACKNOWLEDGEMENTS
We acknowledge Dr. Christin Zachow, TU Graz, for labeling RU47 with rfp and Mrs I-M Jungkurth for carefully checking the manuscript.
Conflicts of interest. None declared.
