


ABSTRACT
Heterotrophic bacteria are important drivers of nitrogen (N) cycling and the processing of dissolved organic matter (DOM). Projected increases in precipitation will potentially cause increased loads of riverine DOM to the Baltic Sea and likely affect the composition and function of bacterioplankton communities. To investigate this, the effects of riverine DOM from two different catchment areas (agricultural and forest) on natural bacterioplankton assemblages from two contrasting sites in the Baltic Sea were examined. Two microcosm experiments were carried out, where the community composition (16S rRNA gene sequencing), the composition of a suite of N-cycling genes (metagenomics) and the abundance and transcription of ammonia monooxygenase (amoA) genes involved in nitrification (quantitative PCR) were investigated. The river water treatments evoked a significant response in bacterial growth, but the effects on overall community composition and the representation of N-cycling genes were limited. Instead, treatment effects were reflected in the prevalence of specific taxonomic families, specific N-related functions and in the transcription of amoA genes. The study suggests that bacterioplankton responses to changes in the DOM pool are constrained to part of the bacterial community, whereas most taxa remain relatively unaffected.
INTRODUCTION
Marine heterotrophic bacterioplankton process dissolved organic matter (DOM), thereby mineralizing nutrients that are essential for the growth of phytoplankton and affecting overall productivity in marine waters (Azam et al. 1983). Among nutrients, nitrogen (N) is a primary constituent of various cellular macromolecules, and the availability of N is commonly a limiting factor for primary and secondary production in diverse marine systems (Ryther and Dunstan 1971; Bristow et al. 2017). In marine coastal systems, the release of dissolved inorganic N (DIN) through the degradation of dissolved organic N (DON) can be of orders of magnitude higher than the input of DIN from land (Knudsen-Leerbeck et al. 2017). Hence, N released or acquired through microbial degradation of nitrogenous DOM is an important N source for bacterioplankton and phytoplankton growth (Bronk et al. 2007).
Bacterioplankton control not only the accessibility of N through DOM processing, but also regulate the oxidative state of N present in the environment through a series of oxidative and reductive processes. Consortia of microorganisms mediate key steps in the marine N cycle (Falkowski, Fenchel and Delong 2008), including, e.g. ammonification, N fixation, nitrification and denitrification (Zehr and Ward 2002), and ultimately determine the availability of N for higher trophic levels, e.g. phytoplankton. For instance, the form and oxidation level, e.g. whether inorganic N is available as ammonia or nitrate, may affect both the productivity and the composition of the phytoplankton community (Glibert, Wilkerson and Dugdale 2016).
In estuarine environments, riverine DOM is an important source of highly labile N (Seitzinger et al. 2005). The characteristics of the riverine DOM may depend on the catchment area and on the season. Consequently, it is conceivable that the riverine input, particularly in N-limited environments, selects for bacterioplankton capable of hydrolyzing nitrogenous DOM and for taxa involved in N-cycling processes. Moreover, the bacterial community response would likely be affected by the availability and nature of the nitrogenous DOM and depend on bacterioplankton community composition and contemporary environmental conditions. Hence, responses are expected to differ between localities. While these assumptions appear logical, they have to our knowledge not been experimentally verified.
The Baltic Sea is the second largest estuarine system in the world and encompasses separate sub-basins with a unique geology and a strong north-south salinity gradient driven by river outlets (Rönnberg and Bonsdorff 2004). The north is characterized by high DOM concentrations and phosphorous (P)-limited plankton production whereas the south has lower DOM concentrations and N-limited plankton productivity (Bernes 2005; Rowe et al. 2018). Further, catchment characteristics vary from primarily forest in the north to agricultural landscapes in the south. The gradient in biogeochemistry and salinity is also reflected in extensive changes in microbial community composition from north to south (Herlemann et al. 2011). Climate change is predicted to increase precipitation and the allochthonous DOM input via rivers to the Baltic Sea (Andersson et al. 2015). The loading and characteristics of the DOM will likely affect the future microbial community composition, activity, DOM utilization and nutrient biogeochemistry in the Baltic Sea (Traving et al. 2017; Rowe et al. 2018). However, responses will conceivably vary between north and south due to differences in catchments, characteristics of the incoming DOM and composition of the recipient microbial communities.
In the present study we examined the effects of riverine DOM loading in incubation experiments in two contrasting environments: the southern Baltic Sea (Øresund) after the spring bloom and in the northern Baltic Sea (Storfjärden) in summer (Fig. S1). After the spring bloom, Øresund surface water is typically N-depleted whereas the surface water at Storfjärden typically has higher N and DOM concentrations during the summer. We tested the effects of allochthonous DOM loads at both sites by additions of river water from an agricultural and a forest (humic) catchment area, and examined the microbial community composition (16S rRNA genes), the abundance of N-cycling genes (reflecting the metabolic capacities) and the activity of ammonia oxidizers. Effects on community composition and the composition of functional genes may not be detectable during short-time incubation. We, therefore, chose to examine changes in functional gene transcription (as a proxy for activity), namely, quantifying the transcription of amoA genes (coding for ammonia monooxygenase)—genes involved in nitrification—known to facilitate N loss through coupled nitrification-denitrification in the Baltic Sea coastal zone (Hietanen et al. 2012). Nitrification is considered a critical N-cycling process with elevated levels in river plumes and estuaries stimulated by high ammonium and particulate matter availability (e.g. Bianchi, Feliatra and Lefevre 1999; Damashek, Casciotti and Francis 2016). We, consequently, anticipated that the river water, rich in DOM and inorganic N, would cause successions in the functional response and treatment-specific responses in our experiments, stimulate nitrification (measured as amoA gene expression), and further, that effects would differ between the two localities with a more modest response in the relatively DOM and N-rich northern locality.
MATERIALS AND METHODS
Experimental setup for Exp I and Exp II
The setup described here was part of a larger experiment reported elsewhere (Markussen et al. 2018). Microcosm experiments with the same setup were conducted at the Marine Biological Section (University of Copenhagen, Denmark) using Øresund water (Exp I) and at the Tvärminne Zoological Field station (University of Helsinki, Finland) using water from Storfjärden, Gulf of Finland (Exp II). The experiments consisted of three treatments in triplicate (control in six replicates) including control, addition of water from a humic river (hereafter DOMhum) and an agricultural river (DOMagri). Water (~300 L) was collected from surface waters (0–10 m depth) on 20 April 2015, at Øresund (56°3' 26.4'N, 12°38'44.9'E) and on 27 July 2015, at Storfjärden, Gulf of Finland (59°51'11.9‘N 23°16'19.2’E) (Fig. S1). Since the purpose of the experiment was to examine microbial responses to riverine DOM we sought to minimize effects of phyto- and zooplankton by prefiltering the inoculum (10 µm) and incubating the microcosms in the dark. Moreover, to remove a potential salinity effect caused by the addition of river water, and to allow for comparisons to the control incubation without river water, the salinity of the river water was adjusted with muffled NaCl to in situ levels of 13.4 (Øresund) and 6 (Storfjärden) prior to addition to the microcosms.
The water was prefiltered through a 10 µm plankton net, filtered through a 0.22 µm capsule filter (Optical XL, Millipore, Burlington, Massachusetts, USA), pooled to ensure homogeneity and filled into microcosms (acid-rinsed 10 L polycarbonate bottles, Nalgene) to represent 60% of the final volume, except for the controls, which were filled to represent 80% of the final volume. The river water was collected 2 days prior to the start of the experiments from the rivers Lapväärti (62°14'20.6‘N 21°34'37.5’E, Finland) and Lielupe (56°48'41.6‘N 23°35'04.9’E, Latvia; Fig. S1), filtered through a 0.22 µm capsule filter (Optical XL, Millipore) and stored at 4°C until use. River water was added to the microcosms representing 20% of the final volume. A plankton inoculum (<10 µm) was added to each batch, representing 20% of the final volume, to initiate the experiments. The microcosms were incubated in a temperature-controlled room at an in situ temperature of ±3°C. Exp I and Exp II had a duration of 5 and 4 days, respectively. Daily samplings at 9 a.m. and 9 p.m. covered a variety of environmental parameters and DNA/RNA sampling (see below).
Bacterial abundance and production, and nutrients
Samples for bacterial abundance and production, and nutrients, were obtained at 6–12 h intervals. Data were obtained from Markussen et al. (2018). Briefly, samples for bacterial enumeration were fixed with glutaraldehyde (1% final conc.), stored at -80°C and later enumerated using SYBR green I (Invitrogen, Carlsbad, California, USA) and flow cytometry. Bacterial production was measured by 3H-thymidine incorporation (Fuhrman and Azam 1982). Ammonium (NH4+) concentrations were determined directly from fresh samples using ortho-phthalaldehyde (Holmes et al. 1999) and a rapid flow analyzer (Turner Designs Trilogy Laboratory Fluorometer). Nitrate (NO3−) and phosphate (PO43−) were measured on an auto-analyzer according to Wood, Armstrong and Richards (2009) and Murphy and Riley (1962), respectively. Dissolved organic carbon (DOC) and DON were measured on a Shimadzu TOC-L Total Organic Carbon Analyzer (Shimadzu Corporation, Kyoto, Japan) as previously described (Paulsen et al. 2017).
DNA and RNA sampling and extraction
Samples for DNA and RNA were obtained at T0 after 44–45 h and at Tend (78 h for Exp I and 96 h for Exp II). One liter of water was collected in 1 L PC bottles (Nalgene, Rochester, New York, USA), immediately mixed with 100 ml stop-solution (5% phenol in 99.8% ethanol (Khodursky, Bernstein and Peter 2003)) and stored for <24 h at room temperature (RT) in the dark. Fixed samples were then filtered onto 0.22 µm membrane filters (Durapore GVWP04700, Milipore) and stored at -80°C. Nucleic acids were extracted from the filters using the AllPrep DNA/RNA Mini Kit (Qiagen, Hilden, Germany), and then purified and concentrated using the RNA Clean & Concentrator (Zymo, Irvine, California, USA) and Genomic DNA Clean & Concentrator (Zymo). DNA and RNA extracts were quantified using Quant-IT RiboGreen and PicoGreen (Invitrogen), respectively.
rRNA gene amplicon sequencing and metagenomics
Bacterial community composition analyses and metagenomics were carried out with samples from Tend. Detailed procedures are described in Markussen et al. (2018) but are outlined below. For determining the community composition, 16S rRNA gene fragments were amplified from total DNA using the primers Bakt_341F and Bakt_805R (Herlemann et al. 2011) and products were sequenced on a MiSeq paired-end (PE250) multiplex platform (Illumina, San Diego, California, USA). Amplicon reads were quality trimmed (Trimmomatic version 0.32) and chimeras were removed and reads assigned into operational taxonomic units (OTUs) using 97% cut-off in cd-hit-otu (Li et al. 2012). SINA 1.2 (Pruesse et al. 2012) was used against the SILVA database (version 115) to classify unique OTUs and the relative abundance of each OTU was estimated using an in-house Python script. Sequences were deposited in NCBI SRA (Bioproject number 542 PRJNA435478).
Total DNA (2–10 ng) from each sample were prepared for metagenomics sequencing with the Rubicon ThruPlex kit (Rubicon Genomics, Ann Arbor, MI, USA). Libraries were sequenced on an Illumina HiSeq 2500. On average, 18 million paired-end reads (PE125) per sample were quality trimmed with Cutadapt (Martin 2011) from both read ends and duplicate reads were removed with FastUniq (Xu et al. 2012). High quality reads were mapped on the BARM database (Alneberg et al. 2018) with Bowtie2 using default parameters (Langmead and Salzberg 2012). The raw counts were calculated from Bedtools histogram output (Quinlan 2014) and quantitative abundance of reads were annotated using Clusters of Orthologous Groups (COG) (Galperin et al. 2015).
Reverse transcription and quantification of amoA genes and transcripts
cDNA was synthesized using ammonia oxidizing archaea (AOA) and bacteria (AOB) (Betaproteobacteria) gene-specific reverse primers (see below) and the TaqMan Reverse transcription kit (Life Technologies, Carlsbad, California, USA) according to the manufacturer's protocol. The RT products from each sample were quantified using PicoGreen and used to calculate the efficiency of the RT reactions (RT factor; conversion factor of RNA to cDNA). PCR amplification using universal 16S rRNA gene primers was tested on RNA extracts to confirm complete DNAse digestion.
Next, amoA genes and gene transcripts from AOA and AOB were quantified from extracted DNA and RNA (cDNA) from time points T0 after 44–45 h and at Tend according to Happel et al. (2018) using a BioRad ddPCR system and the primer sets Arch-amoAF (5 -STAATGGTCTGGCTTAGACG-3) and Arch-amoAR (5 -GCGGCCATCCATCTGTATGT) (Francis et al. 2005), and amoA-1F (5-GGGGTTTCTACTGGTGGT-3) and amoA-2R (5-CCCCTCKGSAAAGCCTTCTTC-3) (Rotthauwe, Witzel and Liesack 1997), respectively. Each reaction mixture (25 µl) consisted of 10 µl Evagreen ddPCR mix (Bio-Rad, Hercules, California, USA), 200 nM of each primer, BSA (0.5 µg µl−1) and ~20 ng of template. The mixture was loaded with 70 µl Evagreen droplet generation oil into a droplet generator. PCR was performed in a T100 thermal cycler using a profile of 95°C for 10 min, followed by 40 cycles of 94°C for 30 s and 60°C (AOA) or 53°C (AOB) for 60 s, one cycle of 98°C for 10 min and ending at 4°C. Droplets were read on the droplet reader and data were analyzed using QuantaSoft software (Bio-Rad). Quantification was presented as the number of target molecules per µl of PCR mixture and converted to copy number per liter seawater using the volume of water filtered. RNA sample quantifications were corrected using the RT factor of each sample. Equal extraction efficiencies for all samples are assumed.
Statistical analysis
To compare the bacterial communities, the taxonomic richness (calculated as abundance-based coverage estimator) and the Shannon diversity index were estimated (Markussen et al. 2018). Significant differences (P < 0.05) between bacterial abundance and production data were tested using Dunnett´s test (Markussen et al. 2018). Raw counts of EC/PFAM/COGs were normalized to counts per million using EdgeR (Robinson, McCarthy and Smyth 2010) to test for significant differences in COG abundances between control samples and treatments. Only COGs with an false discovery rate (FDR) <0.05 and P < 0.005 were considered significant. Generalized linear models (GLM) were investigated to test for significant correlations between the relative abundances of EC/COG/PFAMs and environmental parameters using the mvabund (Wang et al. 2012) package in R. 16S rRNA gene OTU count data were normalized using DESeq2 (Love, Huber and Anders 2014) and principal component analysis (PCA) was performed using the R package vegan. ANOSIM was performed in vegan to test if community composition differed between sites. ANOVA was used to test if amoA gene and transcript abundances differed between treatments. Pearson's product moment coefficients were used to test for correlations between environmental parameters and amoA gene and transcript abundances.
RESULTS AND DISCUSSION
The effect of agricultural and humic river water DOM on microbial communities
In both experiments, there was a general increase in concentrations of DOC, DON, ammonium (NH4) and nitrate (NO3) in the DOMhum and DOMagri treatments relative to the controls. In particular, high DON (104 µM) and NO3 (62 µM) concentrations were found in the DOMagri treatment in Exp I, whereas both river treatments had high DOC concentrations (711 and 756 µM, respectively; Table 1) in Exp II.
Concentrations of dissolved organic carbon (DOC), dissolved organic nitrogen (DON), ammonium (NH4), phosphate (PO4) and nitrate (NO3) in the treatments at the beginning of the experiments for the control, the agriculture river water treatment (DOMagri) and the humic river water treatment (DOMhum). Standard deviations in parentheses. Time evolution of inorganic nutrients can be found in Markussen et al. (2018; Figure S4).
| Exp I (Øresund, southern Baltic Sea) | Exp II (Storfjärden, northern Baltic Sea) | |||||
|---|---|---|---|---|---|---|
| Treatment | Control | DOMhum | DOMagri | Control | DOMhum | DOMagri |
| DOC (µM) | 381.50 (13.66) | 552.67 (51.43) | 481.67 (78.23) | 555.50 (80.77) | 711.33 (66.98) | 756.00 (59.43) |
| DON (µM) | 47.37 (0.37) | 51.97 (1.34) | 103.57 (15.97) | 48.05 (2.16) | 51.77 (1.27) | 57.10 (0.90) |
| NH4 (µM) | 0.57 (0.02) | 0.94 (0.12) | 1.03 (0.04) | 0.35 (0.03) | 0.54 (0.03) | 1.12 (0.01) |
| PO4 (µM) | 0.06 (0.03) | 0.20 (0.02) | 0.19 (0.08) | 0.09 (0.04) | 0.08 (0.02) | 0.09 (0.10) |
| NO3 (µM) | 1.74 (0.19) | 3.63 (0.66) | 61.87 (9.35) | 0.27 (0.08) | 2.60 (0.66) | 0.56 (0.08) |
Bacterial abundance (BA, Fig. 1) and production (BP, shown in Markussen et al. 2018) increased significantly over time in both experiments, but with large differences between the experiments. BA (both experiments) and BP (Exp II) were significantly higher in both the DOMagri (Dunett's test, BA, Exp I: P = 0.03, Exp II: P < 0.01, BP, Exp II: P < 0.01) and DOMhum (BP, Exp II: P = 0.03) treatments compared with the controls, while BP was not significantly stimulated by either of the treatments in Exp I (DOMhum: P = 0.62, DOMagri: P = 0.86). The observed growth responses were anticipated to be accompanied by community dynamics mirrored in composition (16S rRNA genes) and function (composition and transcription of N-cycling genes), based on earlier studies reporting that DOM can shape bacterioplankton community composition (McCarren et al. 2010; Landa et al. 2015; Traving et al. 2017). However, a PCA revealed that community composition at the end of the experiments clustered into site rather than treatment (Fig. 2a), with significant differences between communities in Exp I and II (ANOSIM, r2 = 0.44, P < 0.001) but not between treatments (ANOSIM, Exp I: r2 = 0.10, P = 0.69, Exp II: r2 = 0.49, P = 0.09). Similarly, Shannon diversity (r2 = 0.67, P < 0.001) and taxonomic richness was significantly higher in Exp II compared with Exp I (r2 = 0.24, P < 0.001); however, no significant differences in alpha diversity were observed between treatments from the same experiment (Markussen et al. 2018). Hence, the changes in bacterial growth were only accompanied by limited shifts in community composition. For instance, there were several responses within Proteobacteria (Fig. 3a); e.g. Alteromonadaceae was more abundant in the DOMagri treatment relative to control in Exp I (DOMagri: 58%; control: 25%). This selection for Alteromonadaceae is puzzling given their preference for saline waters in the Baltic Sea region (Herlemann et al. 2016). Consistent with earlier studies (e.g. Riemann et al.2008, Herlemann et al. 2011), Bacteroidetes was among the prominent phyla (Markussen et al. 2018) found in the Baltic bacterioplankton; however, responses to the treatments were limited (Fig. 3b). This is surprising given that taxa within Bacteroidetes are often linked to the degradation of high molecular weight organic matter (Covert and Moran 2001) and extensive responses to riverine DOM have earlier been observed, particularly within the Flavobacteriaceae family (Traving et al. 2017). Overall, some differences were observed in composition between treatments (Fig. 3), but changes were considerably less than the difference between environments (Fig. 2). There are examples of resistant microbial composition withstanding disturbance (e.g. Bowen et al. 2011); however, it may also be that DOC manipulations, as in the current study, only select for some taxa whereas the relative abundance of most taxa remain unchanged. Hence, it appears that overall community structure is a relatively poor predictor of the bacterial growth response, as also suggested by others (Dinasquet et al. 2013). It should, however, be kept in mind that biases associated with our experimental design (e.g. filtration and confinement) may have influenced results and caution should consequently be applied when attempting to generalize results obtained from our experiment. For instance, it may be speculated that our removal of particles >10 µm could explain the lack of a treatment response within Bacteroidetes, as many taxa within this phylum are thought to be adapted to particle hydrolysis (e.g. Riemann, Steward and Azam 2000; Kirchman 2002).
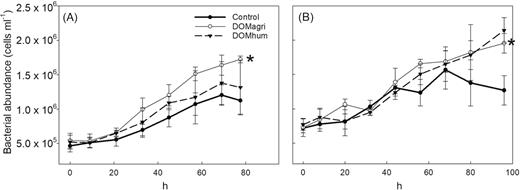
Bacterial abundance during Exp I (Øresund; A) and Exp II (Storfjärden; B) for the controls and the agriculture (DOMagri) and the humic (DOMhum) river water treatments. Original data are from Markussen et al. (2018). Asterisks indicate significant difference (SD). Error bars indicate SD of biological triplicates (six replicates in control samples).

Principal component analysis (PCA) of community composition at the end of the experiments (based on 16S rRNA sequencing; A) and nitrogen-related genes (EC/eggNOG/PFAM) (metagenomics sequencing; B) at the end of Exp I (Øresund) and Exp II (Storfjärden) for the controls and the agriculture (DOMagri) and humic (DOMhum) river water treatments. For separate PCA of each experiment, see Figure S2.
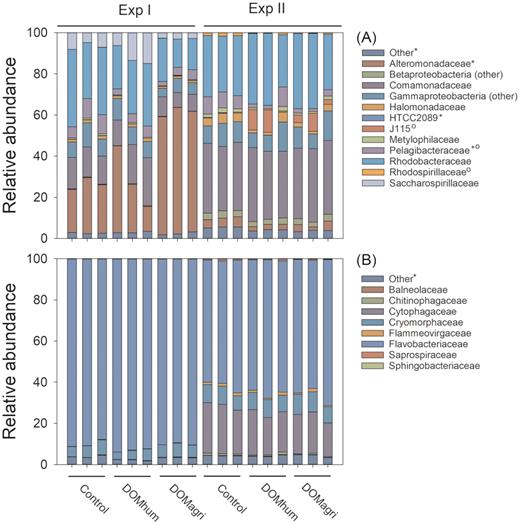
Relative abundance of Proteobacteria families (A) and Bacteriodetes families (B) at the end of Exp I (Øresund) and Exp II (Storfjärden) for the controls and the agriculture river water (DOMagri) and the humic river water (DOMhum) treatments. Significant differential abundances for each group between treatments were tested using EdgeR and are indicated for Exp I (*) and Exp II (°).
Relative abundance of N-cycling genes
It has been suggested that the key level at which to address the assembly and structure of bacterial communities is not ‘species’ (by means of 16S rRNA gene taxonomy) but rather the functional level of genes (Burke et al. 2011; Krause et al. 2014). Moreover, since riverine input has been shown to affect expression of N-cycling genes in marine bacteria (e.g. in the Amazon River Plume; Satinsky et al. 2017), we hypothesized that the high N and DOM concentrations in the added river water would elicit extensive and differential responses in the relative abundance of N-cycling genes at the two sites. Nevertheless, as in the amplicon-based compositional analysis, a PCA of the relative abundance of N-cycling genes (EC/EggNOG/PFAM; see Table S1) revealed a clustering according to site (ANOSIM, r2 = 0.1944, P = 0.003). A treatment effect was observed for Exp II (ANOSIM, r2 = 0.51, P = 0.037) but not for Exp I (r2 = 0.15, P = 0.50; Fig. 2b) despite the exceptionally high concentration of NO3 in DOMagri in Exp I (Table 1). GLM showed that the relative abundances of all N-cycling genes did not correlate with any environmental parameters in Exp I. In Exp II, on the other hand, there were significant correlations with NH4 (LR = 1438.8, P = 0.026), DOC (LR = 1592.3, P = 0.011), DON (LR = 1508.8, P = 0.012) and treatment (LR = 2665.3, P = 0.018). Interestingly, pooling data from both experiments yielded significant correlations with DOC (LR = 1498, P = 0.001), PO4 (LR = 1746, P < 0.001) and site (LR = 1224, P < 0.001). This indicates that addition of river water with a high DOC content affected the abundance of N-cycling genes, but also that responses were site-specific, possibly reflecting that the initial natural communities had a significant impact on the functional response. Moreover, surprisingly, the high NO3 levels in Exp I apparently had no significant effect. It should be noted, however, that results based on correlations with relative abundance of genes as reported here, can sometimes be misleading (Lovell et al. 2015) and that the GLM analysis was based on a small dataset (biological triplicates for each treatment and six replicates for controls, 24 samples in total).
Despite the community analysis of N-cycling genes not revealing a clustering according to treatment (Fig. 2b), the relative abundance of some specific genes differed significantly between controls and treatments (see below). In line with the above GLM results, more genes were over- or under-represented in Exp II than Exp I (Fig. 4). This suggests that a universal response (across sites) in N-cycling genes due to treatment alone was not the case, but rather that the summer community of the northern Baltic Sea (Exp II; Storfjärden), against our initial expectations, was more responsive to DOM addition than that of the southern Baltic Sea in spring (Exp I; Øresund). Reasons for this may include multiple site characteristics, seasonality (sampling in April vs. July) or the difference in N:P ratios between the two sites, with N limitation in the north (N:P = 7; Table 1). Moreover, it is noteworthy that DOC levels naturally, and in our experiment, are highest in the northern Baltic (Table 1) (Sandberg et al. 2004; Rowe et al. 2018). Bacterioplankton in this environment may, therefore, be particularly adaptable and responsive to pulses of riverine DOM. In addition, the higher diversity and taxonomic richness of Storfjärden could possibly have benefited the responsiveness of this community.
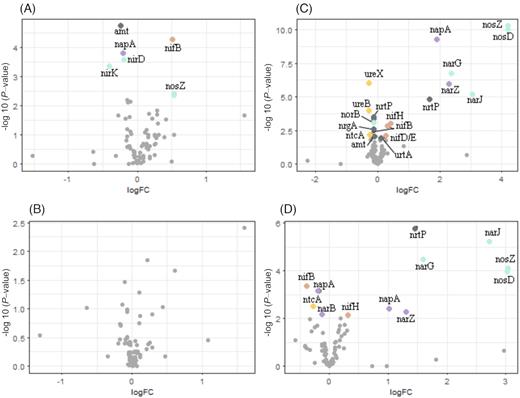
Volcano plots showing up- and down-represented N-related genes as log fold change (logFC) in Exp I (A, B) and Exp II (C, D) for the controls and the humic (DOMhum) (A, C) and the agriculture (DOMagri) (B, D) river water treatments at the end of the experiment. Significantly differentially abundant genes are marked with colored dots matching categories (Table S1). Brown = nitrogen fixation, green = denitrification, purple = nitrate reduction, dark gray = transporters, yellow = other.
In Exp I, a N2 fixation-related gene (nifB, COG0535) and a nitrous oxide reduction gene (nosZ, PF13473) were over-represented in the DOMhum treatment relative to the control. Further, both ammonia transporters (COG0004, PF00909) and nitrite/nitrate reductases (PF07732, PF00394 and PF04879) were under-represented (Fig. 4a). The DOMagri treatment did not have any significant effect on the relative abundance of N-related genes (Fig. 4b). In Exp II, several EC/COG/PFAMs (DOMhum: 20; DOMagri: 13) differed significantly in relative abundance between treatments and controls (Fig. 4c and d). Among these, some of the N2 fixation-related genes were significantly over-represented in the DOMhum treatment (nifH; COG1348, PF00142, EC 1.18.6.1 and nifD; PF00148) (Fig. 4c). Most ammonia and nitrite/nitrate transporters were under-represented (PF00909, COG0004, PF07690) along with two urease genes (PF07969, PF01979). Both nitrate reductase (EC 1.7.99.4) and nitrous oxide reductases (COG4263, EC 1.7.2.4) were over-represented. In the DOMagri treatment, a single N2 fixation gene was under-represented (COG0535) while both nitrite/nitrate transporters (COG2223) and nitrous oxide reductases (COG4263, EC 1.7.2.4, EC 1.7.1.14) were over-represented (Fig. 4d).
The under-representation of ammonia channel gene amtB and over-representation of N2 fixation genes in the DOMhum treatments both point to possible N limitation (Carini, Dupont and Santoro 2018). There were, however, no indications of N limitation when looking at the N:P ratios (calculated as (NH4+NO3)/PO4). Surprisingly, the availability of inorganic N does not always inhibit N fixation (Knapp 2012), and examples exist of correlations between N2 fixation and DOM (e.g. in a Danish estuary; Bentzon-Tilia et al. 2015) and increased N2 fixation upon DOM amendment in coastal waters (Rahav, Giannetto and Bar-Zeev 2016). Hence, it is tempting to speculate that carbon and energy derived from the riverine DOM stimulated N2 fixation, seen as over-represented N2 fixation genes. Interestingly, the over-representations of nitrate reductases (Exp I) and nitrous oxide reductases (both experiments) could indicate a promotion of some steps of the denitrification pathway by the addition of DOMhum. Denitrification in the Baltic Sea is known from anoxic zones of the water column (Dalsgaard, De Brabandere and Hall 2013) where it can be stimulated by DOM addition (Bonaglia et al. 2016); however, how this relates to conditions in oxic waters, where we sampled, is to our knowledge not known. In summary, even though the community analysis of N-cycling genes did not respond systematically according to treatment, the metagenomics suggest that riverine DOM can affect key N-cycling processes, such as N2 fixation and nitrification, in the Baltic Sea.
Abundance and activity of AOA and AOB
To quantitatively assess the impact of the treatments on functional gene abundance and transcription, digital droplet PCR (ddPCR) was used to enumerate amoA genes and transcripts of AOA and AOB in each experiment initially, after 44–45 h and at the end of each experiment (Fig. 5). The ddPCR method was chosen because of its documented ability to quantify amoA genes from Baltic Sea waters (Happel et al. 2018). For principles and details of the ddPCR methodology, please see the recent study by Happel et al. (2018). Although amoA gene and transcript abundances of both AOA and AOB were dynamic over time, there was no significant treatment effect on amoA gene abundances. There were, however, significant differences between the amoA transcript abundances of DOMhum and control treatments in Exp I for both AOA (one-way ANOVA; F = 11.7, P = 0.011 and one-way ANOVA on ranks; F = 2.6, P = 0.014) and AOB (one-way ANOVA on ranks; F = 2.32, P = 0.024 and F = 2.55, P = 0.032, respectively) at the beginning of the experiment. In both experiments, we found abundances of AOA (3.9 × 10³–7.3 × 10⁴ copies L−1) and AOB (4.2 × 10³–5.4 × 10⁴ copies L−1) in similar ranges, whereas amoA gene transcription was dominated by AOB (up to 1.5 × 10⁹ copies L−1 for AOB and 1.5 × 10⁸ copies L−1 for AOA). Concentrations of AOA and AOB were remarkably low compared with some coastal environments (Beman, Popp and Francis 2008; Hollibaugh et al. 2011), but similar to the Yangtze River estuary (Zhang et al. 2014) and to our previous study on ammonia oxidizers in the south and north of the Baltic Sea (Happel et al. 2018). Moreover, the dominance of amoA transcripts from AOB also matches our previous Baltic Sea study (Happel et al. 2018). Surprisingly, in contrast to an earlier observation of elevated nitrification in river plumes (Bianchi, Feliatra and Lefevre 1999), there was no stimulation of amoA gene abundances from AOA or AOB by the addition of riverine DOM in either experiment and amoA gene transcription was in fact reduced in the DOMhum treatments relative to controls. This could be interpreted as a sign of ammonia limitation (Carini, Dupont and Santoro 2018) and indeed ammonium concentration was generally ≤1.0 µM (Markussen et al. 2018). However, our analyses did not firmly identify correlations between the measured environmental factors and amoA gene transcription in our datasets (Pearson's correlation analysis, Fig. S3). Nutrient availability (e.g. P limitation of the nitrifiers; Herfort et al. 2007) or competition between nitrifiers and heterotrophic bacteria and phytoplankton rapidly taking up ammonium (Tworney, Piehler and Paerl 2005; Taylor and Townsend 2010) could possibly blur any such coupling. Additionally, it may be that the removal of particles (>10 µm) in our experiments could have negatively influenced nitrification, as nitrification is sometimes linked to particulate matter in the Baltic Sea (Bartl et al. 2018) as well as in other estuaries (e.g. Damashek, Casciotti and Francis 2016). However, an alternative experimental setup is needed to decipher the relative or synergetic effects of ammonium and particles on pelagic nitrification in the Baltic Sea and elsewhere.

Archaeal (AOA) and bacterial (AOB) amoA gene and transcript abundances at the start of the experiments (A, D), after 44–45 h (B, E) and at the end of the experiments (C, F) for Exp I (left) and Exp II (right) for the controls and the agriculture (DOMagri) and humic (DOMhum) river water treatments. Note the different scales in (B). Error bars indicate SD of biological triplicates (six replicates for control samples).
Concluding remarks
Despite the addition of river water causing an increase of several folds in bacterial growth in both the Øresund and Storfjärden experiments, only specific sub-populations and N-cycling processes were affected by the treatments, whereas overall community composition and the collective pool of examined N-cycling genes remained relatively unaffected. This may support the notion that many bacterioplankton species are generalists and less responsive to transient changes in the DOC pool (Mou et al. 2008), and that the linkage between identity and specialized DOC utilization is valid only within some phyla or among specific sub-populations (Dinasquet et al. 2013). Interestingly, treatment effects on nitrification were only observed at the transcription level and not the gene level. This observation underlines that functional responses in key N-cycling processes in bacterioplankton may not always be accompanied by selection affecting community composition. Our study included several experimental variables, like seasons and use of different river waters, which prevent firm comparisons between the two localities, south and north in the Baltic Sea. Nevertheless, the higher responsiveness of the community in Storfjärden to riverine DOM sources is noteworthy. Based on the experimental approach reported here, we speculate that microbial communities will be rather resilient to the future increases in precipitation and outlet of allochthonous DOM projected for the Baltic Sea area (Andersson et al. 2015), but that the coastal zones in the northern Baltic Sea will undergo larger future changes in microbial N-cycling than the Øresund. Focused studies are, however, needed in order to validate this hypothesis.
ACKNOWLEDGEMENTS
We kindly thank Tvärminne Zoological Station, University of Helsinki and its personnel for providing infrastructural support.
FUNDING
This work was supported by the BONUS Blueprint project supported by BONUS Baltic Organisation's Network for Funding Science EEIG (Art 185), funded jointly by the EU and the Danish Council for Independent Research, Estonian Research Council, Swedish Research Council FORMAS and Academy of Finland.
Conflict of interest
The authors declare that they have no conflict of interest.
