


ABSTRACT
Biological nitrogen fixation plays an important role in nitrogen cycling by transferring atmospheric N2 to plant-available N in the soil. However, the diazotrophic activity and distribution in different types of soils remain to be further explored. In this study, 152 upland soils were sampled to examine the diazotrophic abundance, nitrogenase activity, diversity and community composition by quantitative polymerase chain reaction, acetylene reduction assay and the MiSeq sequencing of nifH genes, respectively. The results showed that diazotrophic abundance and nitrogenase activity varied among the three soil types. The diazotrophic community was mainly dominated by Bradyrhizobium, Azospirillum, Myxobacter, Desulfovibrio and Methylobacterium. The symbiotic diazotroph Bradyrhizobium was widely distributed among soils, while the distribution of free-living diazotrophs showed large variation and was greatly affected by multiple factors. Crop type and soil properties directly affected the diazotrophic ɑ-diversity, while soil properties, climatic factors and spatial distance together influenced the diazotrophic community. Network structures were completely different among all three types of soils, with most complex interactions observed in the Red soil. These findings suggest that diazotrophs have various activities and distributions in the three soil types, which played different roles in nitrogen input in agricultural soil in China, being driven by multiple environmental factors.
INTRODUCTION
Biological nitrogen fixation (BNF) is one of the most important processes of the nitrogen cycle, in which atmospheric N2 is converted into biologically available ammonium (Galloway et al. 2008). BNF, catalyzed only by bacteria and archaea, is an important nitrogen source for an agricultural ecosystem, as it contributes 40–100 Tg N to the terrestrial ecosystem every year (Vitousek et al. 2013). Depending on whether they form symbiotic structures with plants or not, nitrogen-fixing bacteria have been recognized as symbiotic diazotrophs or free-living diazotrophs. The well-known mutualistic (symbiotic) diazotrophs include rhizobia (van Rhijn and Vanderleyden 1995) associated with leguminous plants (e.g. various members of the pea family) and frankia (Benson et al. 1993) associated with certain dicotyledonous species (actinorhizal plants). The majority of non-symbiotic diazotrophs are able to live freely, for example cyanobacteria (or blue-green algae) Anabaena (Allen and Arnon 1955) and Nostoc (Potts 2000), or grow associated with grass plants but do not form a symbiotic structure, for example Azotobacter (Jiménez, Montaña and Martínez 2011), Beijerinckia (Becking and Subclasses 2006) and Azospirillum species (Bashan and Holguin 1997). Although an estimated 60% of BNF in terrestrial ecosystems is mainly carried out by symbiotic diazotroph association with plants, non-symbiotic diazotrophs in soils have also been shown to be important contributors to the N budgets in a number of ecosystems (Gupta, Roper and Roget 2006; Reed, Cleveland and Townsend 2011). For example, it is estimated that about 24% of nitrogen in the crop biomass originated from non-symbiotic N2 fixation in the agricultural ecosystem (Ladha et al. 2016). Therefore, determining the abundance, nitrogenase activity, diversity and community composition of soil diazotrophs is very important for the understanding of agricultural ecosystem nitrogen cycling.
Diazotrophs perform nitrogen fixation using nitrogenases, whose multiple subunits are encoded by the genes nifH, nifD and nifK. Of the three, nifH (encoding the nitrogenase reductase subunit) is the most sequenced and has become the principal marker gene for researchers studying the phylogeny, diversity and community of nitrogen-fixing microorganisms (Rösch, Mergel and Bothe 2002; Wartiainen et al. 2008; Tu et al. 2016; Che et al. 2018; Fan et al. 2018). Previous efforts on optimizing the polymerase chain reaction (PCR) primer for the nifH gene have facilitated the study on the diversity and ecology of nitrogen-fixing bacteria and archaea. A wide range of environments have been sampled for nifH gene diversity, such as marine (Moisander et al. 2007), natural soil (Tu et al. 2016; Meng et al. 2019) and agricultural soil (Wakelin, Gupta and Forrester 2010; Chakraborty et al. 2018, Fan et al. 2018; Feng et al. 2018; Li, Pan and Yao 2019; Liao et al. 2018). Previous studies have revealed that proteobacteria and cynobacteria were the abundant diazotrophs in soil (Gaby and Buckley 2012). However, the activity, abundance and community structure of diazotrophs in soil are strongly variable and are affected by multiple environmental factors, such as soil pH (Shade et al. 2013; Fan et al. 2018), soil type (Pereira e Silva et al. 2011), soil moisture (Nelson and Mele 2006) and soil C content (Wakelin, Gupta and Forrester 2010; Collavino et al. 2014) and soil N content (Hsu and Buckley 2009; Hayden et al. 2010; Li, Pan and Yao 2019). Based on literature review, we found that many studies were related to diazotrophic distribution and the influence of environmental factors, but very few studies focused on how the environmental factors affected the relationship between diazotrophs and nitrogen inputs from BNF in different soil types across large-scale agricultural ecosystems.
Here we chose three main agricultural areas corresponding to three different soil types in China, including the Northeast Plain (Black soil, Mollisol in the United States Department of Agriculture (USDA) Soil Taxonomy), the North China Plain (Fluvo-aquic soil, Ustochrept in the USDA Soil Taxonomy) and southern China (Red soil, Paleudults in the USDA Soil Taxonomy). Maize, soybean and peanuts are the main crops in the three agricultural areas. The purpose of this study was to determine if the different types of soils contain different types of diazotrophs, if a relationship exists between rates and the community composition and which factors control rates and the community composition. This knowledge is critical in evaluating the contribution of BNF to nitrogen input in agricultural soil in China.
MATERIALS AND METHODS
Soil sample collection
A total of 152 soil samples were collected from three main agricultural areas across eight cities in six provinces (Fig. 1), including 61 Black soil samples from Gongzhuling (GZL), Changchun (CC) and Haerbin (HEB) on the Northeast Plain, 26 Fluvo-aquic soil samples from Luancheng (LC) and Fengqiu (FQ) on the North China Plain, and 65 Red soil samples from Qiyang (QY), Taoyuan (TY) and Yingtan (YT) in southern China. The soils were collected in July 2015 and 2016. At each site, three replicate soil samples were collected from three separated 10 m × 10 m plots, by pooling five upper 10 cm soil cores randomly taken from each plot, and then soils were transported at 4°C back to the laboratory. Each soil sample was homogenized and sieved (2 mm), and divided into two sub-samples. One sub-sample, after freeze-drying, was stored at −80°C for DNA extraction, while the other was stored at 4°C for physicochemical analyses.
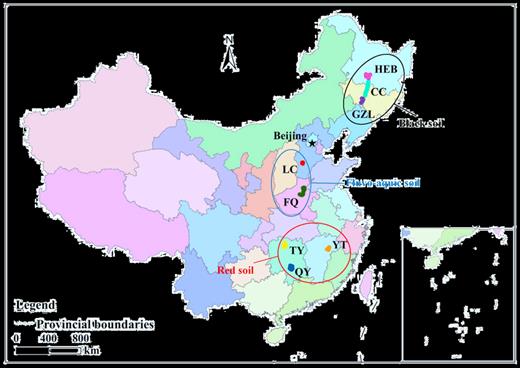
The farmland soil sampling sites in a regional map of China. Abbreviation in the map: TY, Taoyuan; QY, Qiyang; YT, Yingtan; FQ, Fengqiu; LC, Luancheng; GZL, Gongzhuling; CC, Changchun; HEB, Haerbin.
Soil physiochemical properties and nitrogenase activity
All samples were subjected to physical and chemical analyses to determine their major soil characteristics (Table S1, Supporting Information). Soil pH and electrical conductivity (EC) were determined at a ratio of 1:5 (soil to water, w/w). Soil organic carbon (SOC) was determined using the K2Cr2O7 oxidation method (Sparks et al. 1996), while total nitrogen (TN) was measured using a Vario EL III analyzer (Elementar Analysensysteme GmbH, Hanau, Germany). Soil ammonium (NH4+-N) and nitrate (NO3−-N) were extracted with 2 M KCl and determined by a continuous flow analyzer (SAN++; Skalar, Breda, Holland). Soil available phosphorus (AP) was determined using the Olsen method (Olsen 1954), and soil available potassium (AK) was extracted with 0.5 M ammonium acetate and determined by an atomic absorption spectrophotometer (ZEEnit700P, Analytik Jena AG, jena, Germany). All these analyses were carried out in triplicate.
Acetylene reduction assay was used to determine soil nitrogenase activity. Fresh soil (10 g) was weighed and put into a 120 mL serum vial. Glucose and a citric acid solution (1 mg C g−1 soil) were added to the vial as carbon source. The vials were sealed with rubber stoppers and 10 ml acetylene (C2H2) was injected into each vial before they were incubated in the dark at 28°C. After incubation for 48 h, 200 |$\mu$|L headspace gas was taken out to determine the concentration of ethylene (C2H4) by Agilent gas chromatograph (HP7890B, agilent, USA).
Quantitative PCR analysis of nifH gene
Total DNA was extracted from 0.25 g soil samples using a MoBio Powersoil® DNA Isolation Kit (MoBio Laboratories, Carlsbad, CA, USA) according to the manufacturer's protocol. Quantitative PCR was used to determine the nifH gene abundances with primers PolyF (5′-TGCGAYCCSAARGCBGACTC-3′) and PolyR (5′-CCATCATYTCRCCGGA-3′) according to Poly et al. (Poly et al. 2001). The reactions were performed on an iQTM5 Thermocycler (Bio-Rad, USA) in a volume of 25 |$\mu$|L that contained 2 |$\mu$|L of extracted DNA (1–10 ng), 12.5 |$\mu$|L of Power SYBR green master mix (Takara Biotechnology, Dalian, China) and 0.5 |$\mu$|L (10 |$\mu$|M) of each primer. The following thermal program was used for amplification: 95°C for 3 min, 40 cycles of 95°C for 20 s, 58°C for 30 s and 72°C for 30 s, followed by a plate read at 83°C for 10 s. The specificity of the amplification products was confirmed by melting curve analysis, and the expected sizes of the amplified fragments were checked in a 1.5% agarose gel stained with GoldView (GV). The standard curve was prepared according to He et al. (2007).
Barcoded pyrosequencing and processing of the pyrosequencing data
The PCR amplification of the nifH gene was conducted with barcoded primer sets PolyF–PolyR (Poly et al. 2001), and the barcode sequences (5–8 bp) were added to the 5′-end of the forward primers. A 50 |$\mu$|L PCR mixture contained 25 |$\mu$|L premix (Takara Biotechnology, Dalian, China), 1 |$\mu$|L of each primer (10 |$\mu$|M), 2 |$\mu$|L DNA template (about 10 ng) and 21|$\mu$|L ddH2O. The thermal cycling parameters for PCR were the same as those mentioned above. These PCR products were purified using a Wizard SV Gel and PCR Clean-up system (Promega, Madison, WI, USA), after which all the samples were pooled together with equal molar for each sample. The sequencing samples were prepared using the TruSeq DNA kit, as described by suppliers. The purified products were diluted, denatured, rediluted, mixed with PhiX (equal to 30% of the final DNA amount), following the Illumina library preparation protocols, and sequenced with the Reagent Kit v3 (2 × 300 bp) in an Illumina MiSeq system PE250 platform (Illumina, San Diego, CA, USA) at Novogene, Beijing, China (Che et al. 2018). Sequences obtained from this research were submitted in the NCBI Sequence Read Archive (SRA) with accession number PRJNA541768.
A 94% similarity was used in the operational taxonomic unit (OTU) definition for estimating the alpha and beta diversity (Tu et al. 2016; Che et al. 2018). The Shannon index was calculated as the ɑ-diversity. The community composition dissimilarities were calculated based on Bray-Curtis methods at the OTU level. An unweighted pair group method with arithmetic mean clustering based on the Bray-Curtis distances was performed in the Quantitative Insights into Microbial Ecology (QIIME) software to compare the pair-wise community similarity (Smit et al. 1999).
Statistical analysis
Statistical significance was assessed using SPSS 19.0 software (SPSS Inc., Chicago, IL, USA). One-way analysis of variations was conducted to reveal the differences in the nifH gene abundance and nitrogenase activity of diazotrophs among different soil types. The relationships of the nifH gene abundance, nitrogenase activity and Shannon diversity of diazotrophs with the environmental factors were determined using Pearson correlation, respectively. The relationships between soil diazotrophic community compositions and environmental factors were calculated by the “envfit” based on Redundancy analysis (RDA) (permutation = 999) on the R platform (R Development Core Team 2008). Bipartite network analysis was further performed to display the shared diazotrophic genera among three different soil types, as well as the exclusively detected diazotrophic genera only existing in a specific soil type. The graph was displayed by the Gephi version 9.0.2.
We constructed structural equation modeling (SEM) to determine the direct and indirect effects of soil properties, climatic conditions (mean annual precipitation, MAT, and mean annual temperature, MAP), spatial factors (sampling site coordinates) and crops (maize, peanut and soybean) on the diazotrophic ɑ-diversity (richness) and community composition. SEM can partition direct and indirect effects that one variable might have on another, estimate the strengths of multiple effects and ultimately provide mechanistic information on the drivers of a diazotrophic pattern (Grace 2006). Only those variables are included as statistically significant predictors of the diazotrophic patterns from the random forest analysis. The data used for the model construction were classified into several groups, including climate, spatial factors, soil properties, crop, ɑ-diversity and community. The variation was calculated based on 5000 trees and 1000 iterations.
A network analysis was performed with a CoNet Cytoscape plug-in (Becklin, Hertweck and Jumpponen 2012) for each sample type (Red soil, Fluvo-aquic soil and Black soil), based on 94% OTU identity, with the relative abundance of nifH OTUs as nodes, and correlation between relative abundances based on Spearman rank with P-values adjusted with false discovery rate (FDR) (Benjamini, Krieger and Yekutieli 2006).
RESULTS
nifH gene abundance and nitrogenase activity
The abundance of thenifH gene in different soil samples varied from 4.0 × 10⁵ to 7 × 10⁷ copies g−1 soil (Fig. S1a and Table S1, Supporting Information), and were significantly different among the three soil types (F = 6.57, P < 0.005). Red soil had the most abundant nifH gene with an average of 5.0 × 10⁶ copies g−1 soil, followed by Fluvo-aquic soil (3.7 × 10⁶ copies g−1 soil) and then by Black soil (2.0 × 10⁶ copies g−1 soil). Soil nitrogenase activities varied from 0.04 to 9.72 nmol g−1 soil h−1 (Fig. S1b and Table S1, Supporting Information), and showed significant difference among the three soil types (F = 13.46, P < 0.005). Fluvo-aquic soil had the highest nitrogenase activity, with an average of 3.70 nmol g−1 soil h−1, followed by Black soil, with an average of 1.48 nmol g−1 soil h−1, and Red soil had the lowest nitrogenase activity, with an average of 1.33 nmol g−1 soil h−1.
The Pearson correlation analyses showed that the abundance of the nifH gene was positively correlated with TC (R = 0.249, P < 0.005), TN (R = 0.501, P < 0.005) and MAT (R = 0.255, P < 0.05), but negatively correlated with AP (R = −0.387, P < 0.005), AK (R = −0.235, P < 0.005) and sand content (R = −0.241, P < 0.005) (Table 1). Among all the soil physical and chemical parameters measured, TN had the strongest correlation with nifH gene abundance. Soil nitrogenase activity showed significantly positive correlation with soil pH (R = 0.501, P < 0.005), TC (R = 0.285, P < 0.005), C/N (R = 0.313, P < 0.005) and TP (R = 0.272, P < 0.005), and the correlation between pH value and nitrogenase activity was the strongest (Table 1).
The correlations between environmental factors and soil diazotrophic indices.
| nifH gene abundance | Nitrogenase activity | Shannon diversity | Community composition | |||||
|---|---|---|---|---|---|---|---|---|
| R | P | R | P | R | P | R2 | P | |
| pH | 0.144 | 0.078 | 0.501 | 0.000 | 0.139 | 0.088 | 0.286 | 0.001 |
| SOC (g kg−1) | 0.164 | 0.044 | 0.063 | 0.488 | 0.164 | 0.043 | 0.027 | 0.140 |
| TC (g kg−1) | 0.249 | 0.002 | 0.285 | 0.001 | 0.193 | 0.017 | 0.023 | 0.185 |
| TN (g kg−1) | 0.501 | 0.000 | 0.145 | 0.106 | 0.326 | 0.000 | 0.039 | 0.061 |
| NH4+-N (mg kg−1) | 0.050 | 0.544 | 0.012 | 0.893 | 0.024 | 0.766 | 0.209 | 0.001 |
| NO3−-N (mg kg−1) | −0.170 | 0.036 | 0.051 | 0.570 | −0.207 | 0.010 | 0.123 | 0.001 |
| C/N | 0.060 | 0.463 | 0.313 | 0.000 | −0.004 | 0.959 | 0.184 | 0.001 |
| TP (g kg−1) | 0.051 | 0.534 | 0.272 | 0.002 | −0.021 | 0.800 | 0.031 | 0.099 |
| TK (g kg−1) | 0.219 | 0.012 | 0.095 | 0.293 | 0.029 | 0.727 | 0.010 | 0.467 |
| AP (mg kg−1) | −0.387 | 0.000 | 0.100 | 0.265 | −0.270 | 0.001 | 0.130 | 0.001 |
| AK (mg kg−1) | −0.235 | 0.004 | 0.046 | 0.612 | −0.021 | 0.799 | 0.052 | 0.022 |
| Sand (g kg−1) | −0.241 | 0.003 | 0.044 | 0.624 | −0.186 | 0.022 | 0.068 | 0.005 |
| Silt (g kg−1) | 0.163 | 0.045 | 0.120 | 0.181 | 0.127 | 0.118 | 0.003 | 0.819 |
| Clay (g kg−1) | 0.143 | 0.079 | −0.251 | 0.005 | 0.107 | 0.188 | 0.107 | 0.001 |
| MAP (mm) | 0.111 | 0.174 | −0.203 | 0.023 | 0.082 | 0.316 | 0.263 | 0.001 |
| MAT (°C) | 0.255 | 0.002 | 0.025 | 0.785 | 0.150 | 0.065 | 0.235 | 0.001 |
SOC: soil organic C content; TC: soil total C content; TN: soil total N content; C/N: soil TOC/TN; AK: available potassium; AP: available phosphorus; TK: total potassium; TP: total phosphorus; MAP: mean annual precipitation; MAT: mean annual temperature; the relationships of the nifH gene abundance, nitrogenase activity and Shannon diversity of diazotrophs with these environmental factors were determined using Pearson correlation, respectively. The relationships between soil diazotrophic community compositions and environmental factors were determined using the ‘envfit’ based on RDA. The bold numbers represent significant correlations with P < 0.005.
Diazotrophic community structure in three typical upland soils
A total of 5338 OTUs at 94% nucleotide identity level were clustered from 6 134 881 high-quality nifH clean reads across 152 soil samples. At the genus level, Bradyrhizobium (29.15%), Azospirillum (9.95%), Myxobacter (6.95%), Desulfovibrio (5.22%) and Methylobacterium (4.42%) (Fig. 2a) dominated in all soil type samples. Among them, the symbiotic diazotroph Bradyrhizobium was the most abundant group in all three soil types, with a relative abundance of 30.6% in Red soil, 22.9% in Fluvo-aquic soil and 34.0% in Black soil. In addition, the free-living diazotrophs Methylobacterium (11.5%), Desulfovibrio (8.6%) and Myxobacter (6.2%) were predominant in Red soil, Azospirillum (18.2%), Skermanella (6.1%) and Myxobacter (5.2%) were present in greater percentages in Fluvo-aquic soil and Myxobacter (9.5%) and Azospirillum (7.5%) were rich in Black soil.
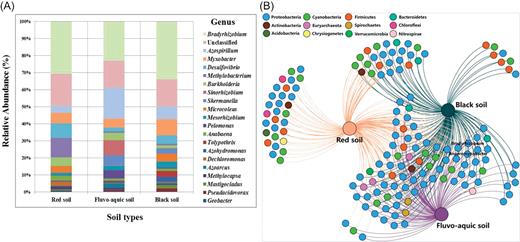
The relative abundance of the dominant diazotrophic genera in three typical upland soils (A). The rare OTUs with relative abundances less than 0.01% of the total number of nifH sequences were not shown. Bipartite network analysis was used to display the shared nifH genes among the three different soil types (at the genus level) (b).
Bipartite network analysis further showed that 83 genera were common among the three soil types, while 25 genera only existed in Red soil and Black soil, 6 genera existed in Fluvo-aquic soil and Black soil and only 3 genera commonly existed in Red soil and Fluvo-aquic soil. On the other hand, we found that 30 genera were unique in Red soil, 8 genera were special in Black soil, while there was no specific diazotrophic genus in Fluvo-aquic soil (Fig. 2b), and the result with genus names was also shown in Fig. S2 (Supporting Information).
Direct and indirect factors affecting diazotrophic ɑ-diversity and community composition
The Shannon index of soil diazotrophs ranged from 2.17 to 6.10, but was not significantly different among the three soil types. The Pearson correlation analyses showed that it had a significantly positive correlation with TN (R = 0.326, P < 0.005), and significantly negative correlations with AP (R = −0.270, P < 0.005) (Table 1). Based on RDA analysis, the diazotrophic community composition was significantly affected by many environmental factors, including pH (R2 = 0.286, P < 0.005), NH4+-N (R2 = 0.209, P < 0.005), NO3−-N (R2 = 0.123, P < 0.005), C/N (R2 = 0.184, P < 0.005), AP (R2 = 0.130, P < 0.005), AK (R2 = 0.052, P < 0.005), Clay (R2 = 0.107, P < 0.005), MAP (R2 = 0.263, P < 0.005) and MAT (R2 = 0.235, P < 0.005) (Table 1).
The SEM further quantified the relative contribution of potential factors to the diversity and community structure of diazotrophs, and the results indicated that soil properties (including pH, TN, AP and NO3−) and crop type together explained the 20.7% variation of diazotrophic ɑ-diversity (Fig. 3a and Fig. S3a, Supporting Information), while soil properties (including pH, TK and NH4+), space distance and climate factors (MAT and MAP) together explained the 83.5% variation of diazotrophic community composition (Fig. 3b and Fig. S3b, Supporting Information).
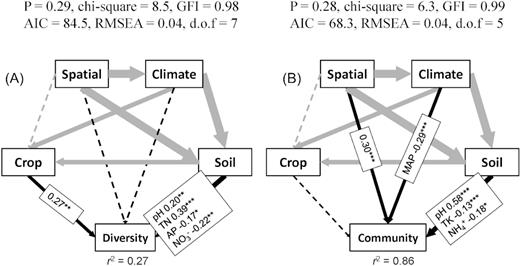
Structural equation modeling of the direct and indirect effects of space, climate, crop types and soil properties on the nifH gene diversity (A) and diazotrophic communities (B). Arrows indicate the hypothesized direction of causation. The solid line represents a significant correlation between two linked variables, while the dashed line represents no significant correlation. The width of arrows is proportional to the strength of the path coefficients. The numbers adjacent to arrows are standardized path coefficients and indicative of the effect size of the relationship. The R2 value alongside the response variable indicates the proportion of variance explained by the variable. Spatial: the sampling site coordinates. Climate: MAT and MAP. Only significant path coefficients are displayed. *P < 0.05, **P < 0.01, ***P < 0.001. (TN, soil total N content; AP, available phosphorus; TK, total potassium; GFI: goodness-of-fit index; AIC: Akaike information criterion; RMSEA: root mean square error of approximation)
Interaction relationships and network analysis of diazotrophic community in three typical upland soils
A network was constructed for each soil type, with the relative abundance of diazotrophic OTUs at the genus level as nodes (Fig. 4). In the network of Red soil, 225 nodes and 2013 links were detected, and the number was significantly higher than those for Fluvo-aquic soil (160 nodes and 508 links) and Black soil (92 nodes and 265 links).
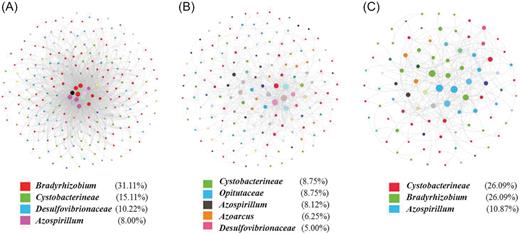
The network structure of the diazotrophic community in three different types of soil at the genus level. (A) Red soil. (B) Fluvo-aquic soil. (C) Black soil. The number below the network represents the proportion of OTUs (nodes) within a genus in the total OTUs, and the size of each node reflects the degree of connectivity. The genus with a percentage less than 5% is not shown.
In the network analysis, a module is a group of OTUs that are highly connected among themselves but have much fewer connections with OTUs outside the group. Network hubs are defined as OTUs that are highly connected both in general and within a module, and module hubs are OTUs that are highly connected only within a module. OTUs that link modules are known as connectors, while peripherals have few links to other species (Poudel et al. 2016; Fan et al. 2018). The proportion of network hubs (4.9%) and connector nodes (32.4%) was the greatest in Red soil, suggesting that there were much more connections among diazotroph OTUs in Red soil (Fig. S4a, Supporting Information). The highest proportion of module hubs (2.5%) was observed in Fluvo-aquic soil, which meant more interactions within modules but less outside modules (Fig. S4b, Supporting Information). The lowest proportion of network hubs (1.1%), and no module hub, were detected in Black soil, which means diazotroph OTUs had very loose connections in Black soil (Fig. S4c, Supporting Information). All these together suggest that the interactions between diazotrophs in Red soil were more complex compared to those in Fluvo-aquic soil and Black soil.
In the network, the nodes were mainly represented by Bradyrhizobium (31.11%), Cystobacterineae (15.11%) and Desulfovibrionaceae (10.22%) in Red soil and by Bradyrhizobium (26.09%), Cystobacterineae (26.09%) and Azospirillum (10.87%) in Black soil (Fig. 4), while the nodes in Fluvo-aquic soil were represented by multiple genera like Cystobacterianeae, Opitutaceae, Azospirillum, Azoarcus and Desulfovibrionaceae with the proportion less than 10% for each genus (Fig. 4b). These results suggest that the interactions of the diazotrophic community in Red soil and Black soil were mainly dominated by Bradyrhizobium and Cystobacterineae while they were commonly played out by multiple diazotrophic groups in Fluvo-aquic soil.
DISCUSSION
In this study, typical agricultural soil samples were collected from three major agricultural production areas across six provinces and three different soil types to characterize the diversity and biogeographic characteristics of nitrogen-fixing microflora. The results showed that nifH gene abundance and nitrogenase activity were significantly different among the three different soil types. The abundance of thenifH gene showed significantly positive correlation with TC, TN and MAT, but negative correlation with AP, AK and sand content, with the strongest correlation between nifH gene abundance and TC. Normally, carbon, nitrogen and phosphorus were widely recognized as crucial factors affecting soil diazotrophic abundance (Che et al. 2017a; Reed, Cleveland and Townsend 2011; Reardon, Gollany and Wuest 2014). Generally, it was assumed that high available nitrogen content would negatively affect soil diazotrophs as the nitrogenase enzyme is sensitive to ammonia (Che et al. 2017; Reed, Cleveland and Townsend 2011). However, soil total nitrogen content showed a strong positive correlation with nifH gene abundance in this study. It could be attributed to the fact that soils with high TN may sustain better growth of plants and thus provide more carbon substrate from plants to nourish diazotrophs, as diazotrophs are highly dependent on the availability of carbon (Reed, Cleveland and Townsend 2011). It also might be partly attributed to BNF substantially contributing to the nitrogen input. Soil texture was also an important factor affecting the abundance of diazotrophs. It played an important role in the formation of special soil physical structure and microaggregates, which could provide an anaerobic environment for the nitrogen-fixing process of diazotrophs (Gupta and Roper 2010; Pereira e Silva et al. 2011). Previous research showed that about 70% of the diazotrophs in the soil were mainly concentrated in the clay part (Chotte et al. 2002). This might well explain the negative correlation between the sand content and nifH gene abundance in this study. Particularly, high nifH gene abundance was observed in the Red soil samples from Taoyuan (TY) and Qiyang (QY), which had low sand content and high clay content (Table S1, Supporting Information). However, though the highest nifH genes were recorded in Red soil, the nitrogenase activity was lowest in Red soil. The possible reason could be that part of the nifH genes came from symbiotic diazotrophs, and thus required symbiotic nitrogen fixation with legumes. Moreover, the correlation analysis further showed that soil nitrogenase activity was positively correlated with soil pH, TC, C/N and TP, and the correlation between pH value and nitrogenase activity was the strongest. Low pH was not conducive to the activity of nitrogenase (Limmer and Drake 1996; Nelson and Mele 2006; Roper and Smith 1991), which might be another reason why Red soil (low pH) had higher nifH gene abundance but lower nitrogenase activity while Fluvo-aquic soil (high pH) had lower nifH gene abundance but highest nitrogenase activity. Black soil (low pH) had both relatively low nifH gene abundance and nitrogenase activity, which could be attributed to the low mean temperature in the Black soil area, which is located in northeast China, and has the lowest mean temperature among the three areas. Phosphorus is also one of the key factors limiting nitrogen fixation due to the high adenosine triphosphate demand of BNF (Hill 1988; Reed, Cleveland and Townsend 2011; Vitousek et al. 2002), which well explains the significant positive correlations between soil total phosphorus and diazotrophic nitrogenase activity. Relatively high TP may be another reason for the high nitrogenase activity in Fluvo-aquic soils. Collectively, these findings suggest that non-symbiotic diazotrophs may have greater nitrogenase activity in the North China Plain than in southern China and the Northeast Plain.
In the three types of upland soils, the diazotrophic community was mainly composed of Bradyrhizobium, Azospirillum, Myxobacter, Desulfovibrio and Methylobacterium, and the symbiotic diazotroph Bradyrhizobium accounted for 22.9–34.0% of the diazotrophic community and showed slight variation among soil types. In contrast, the distribution of the free-living diazotrophs is distinctly different among the three soil types. Methylobacterium, Desulfovibrio and Myxobacter were predominant in Red soil, while Azospirillum, Myxobacter and Skermanella had higher percentages in Fluvo-aquic soil and Myxobacter and Azospirillum were rich in Black soil. The results were different from those of some previous studies showing that Polaromonas, Burkholderia and Opitutaceae dominated in the rhizosphere and the bulk soils of wheat fields on the North China Plain (Fan et al. 2018), and that Leptolyngbya and Burkholderia dominated in fertilization treatment fields in Mengcheng, Anhui Province, China (Feng et al. 2018). The symbiotic diazotroph Bradyrhizobium was enriched in all three types of soils. Except for nitrogen fixation with leguminous plants, it also acted as plant growth promoting rhizobacteria on non-legumes (Antoun et al. 1998). Similar results were found in wheat fields of the North China Plain (Fan et al. 2018), natural and revegetated forest soils (Meng et al. 2019) and fertilization treatment fields in Mengcheng (Feng et al. 2018). These results suggest that the symbiotic diazotroph Bradyrhizobium was widely distributed in China, while the distribution of free-living diazotrophs might be affected by multiple factors.
Many studies have found that diazotrophic diversity and community composition are affected by a variety of driving factors. However, the relative contribution of these environmental factors to the structuring of the diazotrophic community is still unclear. In this study, soil properties (including pH, TN, AP and NO3−-N) and crop type explained 27% of the variance in the diazotrophic ɑ-diversity (Fig. 3a), and spatial distance, climate and soil properties (including pH, TK, and NH4+) explained 86% on driving the variation of the diazotrophic community (Fig. 3b). As crop types of maize, peanut and soybean were assigned 1, 2 and 3 in the correlation analysis, respectively, the positive correlation between a crop and diazotrophic diversity showed that a higher number (‘3’ for soybean) represented a greater impact, namely that planting soybean can increase the diversity of diazotrophs (Fig. 3a and Table 1).
For the diazotrophic community, the pH value played a more important role than other soil properties (Table 1 and Fig. 3b). The optimal pH value for the growth of diazotrophs is between 7.5 and 8.0 (Roper and Gupta, 2016). Although low soil pH affects the growth of diazotrophs, the mechanism of the influence of the pH value is still unclear. One possible explanation is that changes in pH may affect the bioavailability of C or N sources in soil (Lauber et al. 2009), driving the shift of diazotrophic communities. In our soil samples, the pH value varied between 4.3 and 8.0, and the concentration of hydrogen ions in the soil changed dramatically, resulting in substantial differences in the bioavailability of both C and N sources. Many studies have also found that the similarity of bacterial communities between two sites decreases as the geographical distance between the two sites increases (Martiny et al. 2011; Xiong et al. 2012). A similar result was observed in this study: the community composition of diazotrophs was significantly correlated with spatial distance. Climate factors, including MAT and MAP, were also important. Due to the high temperature and rainy local climate, the soil parent material in the Red soil areas like TY, QY and YT suffered from strong physical, chemical and biological factors during the development process, and a large amount of Al3+ and Fe3+ was enriched but nutrient was lost with strong leaching under the high temperature and rainy local climate, resulting in low pH and soil fertility in this area (Jiang et al. 2014). The Fluvo-aquic soil of FQ and LC mainly developed from the sediments of the Yellow River. Due to the relatively low temperature and rainfall in this area, chemical leaching is not very serious and soil erosion is less likely to occur, and the soil is moderately nutritive and slightly alkaline. Differently, in the Black soil areas of GZL, CC and HEB, low temperature and a large amount of organic matter input has resulted in high soil fertility. Thus, different space distances, climatic conditions and soil properties formed different diazotrophic communities.
Network analyses could provide us with more detailed information about the interactions between diazotrophs in the three typical upland soils. In this study, the divergent response of a diazotrophic co-occurrence network was observed in different soil types. The highest network hub showed that interactions between diazotrophs in Red soil were most complex, followed by those in Fluvo-aquic soil, with those in Black soil being the loosest (Fig. 4). One possible explanation could be that the increased competition for resources could promote the interactions between different microbial members (Giovannoni, Thrash and Temperton 2014). Consistently, microorganisms tended to coexist for survival when the surrounding energy resources were limited based on the first principles of thermodynamics models (Grosskopf and Soyer 2016; Yu et al. 2018). This is exactly consistent with more complex interactions in low-fertility Red soil, while in Black soil a large amount of organic matter input resulting in high soil fertility reduced the interactions between diazotrophs. Bradyrhizobium was identified as a core diazotroph in both Red and Black soils (Fig. 4). As mentioned above, Bradyrhizobium was suggested to be capable of acting as plant growth promoting rhizobacteria on non-legumes except for driving nitrogen fixation (Antoun et al. 1998). This study further demonstrated that Bradyrhizobium not only provided a nitrogen source for soil through symbiotic nitrogen fixation, but also was a core microorganism acting with others.
In conclusion, the nifH gene abundance and nitrogenase activity were significantly different among the three different soil types. Non-symbiotic diazotrophs may have higher nitrogenase activity in Fluvo-aquic soil than in Red and Black soils. The symbiotic diazotroph Bradyrhizobium was widely distributed in China, while the distribution of free-living diazotrophs might be affected by multiple factors. Soil TN and pH were important factors affecting the abundance and activity of diazotrophs, respectively. Crop type plus soil properties directly affected the ɑ-diversity of diazotrophs, and soil properties, climatic factors and spatial distance together influenced the community composition of diazotrophs. Network structure differed among all three types of soils and the most complex interactions existed in Red soil, and Bradyrhizobium was the core diazotroph group in soils and commonly interacted with other diazotrophs. Future research should combine with a stable isotope labeling method to systematically examine the symbiotic and non-symbiotic nitrogen-fixing contributions to Chinese agricultural soil and the relationship between nitrogen fixation rates and diazotrophic community composition.
ACKNOWLEDGEMENTS
We thank Drs Rong Sheng, Zhi Quan, Haijun Hou, Feifei Zhu, Shanglong Li, Peipei Li and Jian Zhang for their generous help in soil sampling and laboratory work, and Dr. An Yan for improving English expression and Li Bi for Bipartite network analysis.
FUNDING
This work was supported by the Strategic Priority Research Program of the Chinese Academy of Sciences (grant number: XDB15020200), National Key R&D Program (grant number: 2017YFD0200600) and the China Scholarship Council.
Conflicts of interests. None declared.
