


ABSTRACT
Aerobic anoxygenic phototrophs (AAPs) are a group of photoheterotrophic bacteria common in natural waters. Here, AAP abundance and contribution to total bacterial abundance and biomass were investigated to test whether the trophic status of a lake or content of coloured dissolved organic matter (CDOM) play a role in determining AAP distribution and abundance in shallow inland lakes, with special focus on hypertrophic and polyhumic waters. Twenty-six different shallow lakes in Hungary were monitored. AAP abundance and biomass were determined by epifluorescence microscopy. The lakes exhibit a broad range of CDOM (2–7000 mg Pt L−1) and phytoplankton biomass (2–1200 μg L−1 chlorophyll a concentration). Very high AAP abundance (up to 3 × 10⁷ cells mL−1) was observed in polyhumic and hypertrophic shallow lakes. AAP abundance was influenced by phytoplankton biomass and CDOM content, and these effects were interrelated. As determined, 40 μg L−1 chlorophyll a and 52 mg Pt L−1 CDOM are threshold levels above which these effects have a synergistic relationship. Hence, the observed high AAP abundance in some soda pans is a consequence of combined hypertrophy and high CDOM content. AAP contribution was influenced by total suspended solids (TSS) content: the success of AAP cells could be explained by high TSS levels, which might be explained by the decrease of their selective grazing control.
INTRODUCTION
Aerobic anoxygenic phototrophs (AAPs) are bacteriochlorophyll a (BChl a)-containing aerobic bacteria (for definition and recent reviews, see Koblížek 2015; Yurkov and Hughes 2017). They are classified as facultative photoheterotrophs since members of this taxonomically diverse group can both utilise organic substrates in darkness and conduct anoxygenic photosynthesis in the presence of light. Because of BChl a, AAPs absorb light with a wavelength of up to 900–950 nm. The absorbed additional energy provides AAPs with a competitive advantage over purely heterotrophic microbes (Koblížek 2015). Wide distribution of AAP bacteria in the ocean was first reported by Kolber et al. (2000). Since then, AAPs have been identified in many different aquatic habitats. Nevertheless, most studies focus on marine systems (Koblížek 2015). Indeed, AAPs play an important role in aquatic ecosystems and nutrient cycling. They usually account for 10–20% of bacterioplankton biomass in marine environments (Mašín et al. 2006; Salka et al. 2008; Cottrell and Kirchman 2009; Chen, Zhang and Jiao 2011) and for 1–60% of bacterioplankton biomass in inland environments (Mašín et al. 2008; Medová et al. 2011; Čuperová et al. 2013; Fauteux, Cottrell and Kirchman 2015).
A positive correlation exists between AAP abundance and total phytoplankton biomass [deduced from chlorophyll a (Chl a) concentration] in marine waters (Jiao et al. 2007), inland salt lakes (Medová et al. 2011), glacial lakes (Mašín et al. 2012) and estuaries of the Adriatic Sea (Šantić et al. 2017). Furthermore, nutrient levels also correlate with AAP abundance in freshwater lakes (Mašín et al. 2012; Fauteux, Cottrell and Kirchman 2015). Koblížek (2015) proposed that this correlation either reflects a direct association with the primary producers or the same dependence on limiting nutrients (i.e. forms of nitrogen or phosphorus). However, this correlation is not always apparent. For example, no significant correlation is observed between AAP abundance and Chl a concentration in brown-water peat-bog lakes and northern lakes (Fauteux, Cottrell and Kirchman 2015; Lew, Lew and Koblížek 2016). Further, Mašín et al. (2008) reported low AAP abundance in highly productive lakes and, in turn, high AAP biomass in oligotrophic waters.
The effect of organic substances—i.e. dissolved organic matter including its coloured fraction, coloured dissolved organic matter (CDOM)—on AAP abundance is unclear. According to Fauteux, Cottrell and Kirchman (2015), (facultative) photoheterotrophy might provide a pronounced ecological advantage in highly coloured lakes with low Chl a concentration. Such systems feature a shallow photic zone and a higher proportion of red/infrared light available for AAPs (Eiler et al. 2009). Light-derived energy might also provide an additional driving force to incorporate complex organic molecules such as CDOM, which are hard to metabolise, and which are the main fraction of DOC in many freshwater lakes (Mašín et al. 2008). Accordingly, these authors found a pronounced positive correlation between AAP abundance and DOC (unfortunately, CDOM was not measured). In temperate freshwater lakes, however, a strong negative relationship was observed between AAP contribution and DOC, suggesting that low DOC concentration is beneficial for AAPs (Mašín et al. 2008). Similarly, a weak negative correlation between these two parameters was described in peat-bog lakes (Lew, Lew and Koblížek 2016). By contrast, no correlation was observed between AAP and DOC in glacial lakes (Mašín et al. 2012).
Based on the above, AAPs appear to be influenced by both Chl a concentration and CDOM levels, with a possible synergy between these effects. However, the majority of studies on AAP occurrence and ecology are conducted in oligo-mesotrophic aquatic environments (Medová et al. 2011; Mašín et al. 2012; Fauteux, Cottrell and Kirchman 2015; Lew, Koblížek and Lew 2015; Cepáková et al. 2016). Only scarce information is available about AAP occurrence and distribution in highly productive (i.e. hypertrophic) waters. The same is true for CDOM content, with a study on polyhumic peat-bog lakes as an exception (Lew, Koblížek and Lew 2015). Hence, AAP distribution should be explored further in terms of both the trophic status and CDOM levels (in hypertrophic and/or polyhumic lakes, respectively). Consequently, the main goal of the current study was to test whether the trophic status (Chl a concentration) and/or CDOM levels play a role in determining AAP distribution and abundance in shallow inland lakes, focusing on hypertrophic and polyhumic waters. We also aimed to compare the behaviour of AAPs and heterotrophic bacteria (HB) along the observed trophic and CDOM ranges.
MATERIALS AND METHODS
Study stations and sampling
AAP occurrence and distribution in Hungarian shallow lakes (central Europe) were investigated during the summer of 2014. Overall, 45 sampling stations were established at 26 different lakes (Supplementary Table 1) representing wide trophic and CDOM ranges (large oligotrophic lakes and small hypertrophic fishponds, and oligohumic lakes and polyhumic soda pans, respectively). Several sampling stations were established at the two largest lakes, Lake Balaton and Lake Fertő/Neusiedler See, to account for their size and spatial heterogeneity. Lake Balaton is the largest shallow lake in central Europe, with a surface area of 596 km2 and a mean water depth of ~3 m. Due to its shallowness and frequent mixing, the water column is well oxygenated (Herodek, Laczkó and Virágh 1988). Lake Fertő/Neusiedler See straddles the Austrian/Hungarian border, with a surface area of ~309 km2 and 1 m average depth. More than half of its surface is covered by reed (Phragmites australis), among which small, brown-water inner lakes have formed. Similar to Lake Balaton, the water of Lake Fertő is well oxygenated (Löffler 1979). Our samples was taken at well-oxygenated sites (open water, inner lakes). The other 24 lakes were represented by only one sampling station each. These were: 18 fishponds at the southern catchment area of Lake Balaton, with an average water depth of 1 m and a mostly hypertrophic nature; and six hypertrophic waters with soda and soda-saline-type pans (Boros and Kolpakova 2018) located in the Danube-Tisza Interfluve. The studied fishponds are active fish farms, where sufficient aeration is essential. During sampling, sign of any anoxic condition was not observed. The mean depth of the intermittent soda pans is only 30 cm. Some of them are surrounded by macrophytes (Bolboschoenus maritimus and P. australis) and they have a polyhumic character.
Water temperature, depth, Secchi-disk transparency, pH, electrical conductivity (EC) and dissolved oxygen concentration were determined on-site at the time of sampling. The latter three were determined using a multiline P8211 portable meter (WTW, Weilheim, Germany).
Analytical methods
The total suspended solid (TSS) content was measured gravimetrically. Water samples (10–150 mL) were filtered through a pre-dried and pre-weighed GF-5 glass fibre filter (Whatman; pore size: 0.4 μm), dried at 105°C for 2 h and weighed again. The TSS content was calculated based on the volume of the filtered sample (Eaton, Clesceri and Greenberg 1995).
The CDOM content was expressed as platinum (Pt) units (mg Pt L−1). Water samples were filtered through a cellulose acetate filter (0.45-μm pore size) and buffered with borate buffer (pH = 8.0). Buffered Milli-Q ultrapure water was used as a blank, and sample absorbance was measured at 440 nm and 750 nm (Kirk 1996) using a Shimadzu 160A UV-Vis (Japan) spectrophotometer. CDOM content was calculated according to Cuthbert and Del Giorgio (1992).
The DOC concentration was measured in water samples filtered through a pre-combusted GF-5 filter. Samples for DOC analysis were acidified to pH 2.0 using HCl and bubbled with air to remove dissolved inorganic carbon (3 replicates). DOC was measured using a High-TOC analyser (Elementar Analysensysteme, Hanau, Germany) according to V.-Balogh, Németh and Vörös (2009).
To determine the total nitrogen (TN) concentration, samples were digested in the presence of NaOH and K2S2O8 (3 replicates) in an autoclave at 110°C for 2 h. Such treatment converts most nitrogen forms to nitrate (D'Elia, Steudler and Corwin 1977). Nitrate concentration was then determined via reduction to nitrite according to the method of Elliott and Porter (1971).
Concentration of total phosphorus (TP) was measured according to Menzel and Corwin (1965). First, all phosphorous forms were converted to PO43– by digesting the samples in the presence of 5% K2S2O8 (3 replicates). Phosphate concentration was then determined using a stannous chloride method (Murphy and Riley 1962).
Chl a concentration was determined in freshly collected samples. Depending on the optical density of the sample, 10–1000 mL of lake water was filtered through a GF-5 filter, from which Chl a was subsequently extracted using a hot methanol method. Chl a concentration was determined spectrophotometrically according to Iwamura, Nagai and Ichimur (1970).
Epifluorescence microscopy
AAP cells were counted using an Olympus BX51 epifluorescence microscope according to Jiao, Zhang and Chen (2006). Briefly, fresh water samples were filtered through a 0.2-μm white polycarbonate filter (Millipore). AAPs were detected upon excitation at 350–550 nm (excitation of BChl a) using a 780 nm long-pass filter and a monochrome CCD camera (Olympus XM10) at 1000x magnification. To detect picophytoplankton cells, the same field of view was also photographed using a colour CCD camera (Olympus DP71) upon violet-blue (400–440 nm) and green (520–550 nm) excitation at 1000x magnification. Upon violet-blue excitation, picoeukaryotes emit vivid red autofluorescence, while the autofluorescence of phycoerythrin-rich and phycocyanin-rich picocyanobacteria is bright yellow and weak red, respectively. By contrast, upon green excitation, picoeukaryotes emit no or only weak fluorescence, while picocyanobacteria exhibit enhanced red fluorescence (MacIsaac and Stockner 1993). Ten fields of view were photographed in total and cells were counted on the images to avoid fluorescence fading.
Total bacteria were detected by 4′,6-diamidino-2-phenylindolestaining (DAPI; Porter and Feig 1980). Briefly, formaldehyde-fixed water samples were filtered onto 0.2-μm polycarbonate Millipore filters and the cells were identified after 350–450-nm excitation by a colour Olympus DP71 CCD camera (see above).
AAP and total bacterial abundance and biomass were determined using Yet Another Bacterial Biovolume Algorithm (YABBA) software (Zeder et al. 2011). YABBA calculates bacterial cell volume in microscopic images based on the cell contours and without any a priori geometrical assumptions besides the rotational symmetry. The algorithm was numerically validated using geometrical models of 22 different bacterial morphotypes (Zeder et al. 2011). The total biovolume (biomass) was calculated based on cell volume and abundance assuming specific gravity of 1.0 g cm−3.
Statistical analysis
To satisfy the assumptions of linear regression, some of the variables were log-transformed. Variance inflation factors (VIF) were used to test for collinearity among explanatory variables. VIF for electrical conductivity was 9.114, suggesting a high collinearity of EC with other explanatory variables. Therefore, EC was omitted from further analyses. Redundancy analysis (RDA) was used to explain the abundance of AAP and HB, as well as the percentage of AAP by the different explanatory variables. ANOVA-like permutation test was performed to assess the significance of explanatory variables.
Based on the results of RDA, our hypothesis that CDOM content and Chl a concentration both influence AAP and HB abundance, and that they interact non-linearly, was tested by model-based recursive partitioning (MOB; Zeileis, Hothorn and Hornik 2008). MOB fits a model tree using the following steps: (i) fitting of a linear regression model for all observations; (ii) assessment of the stability of the model parameters with respect to the partitioning variable and searching for the locally optimal split [if the Bonferroni-corrected p-value of the optimal split is smaller than the significance level (α = 0.05), data are divided into two sets, otherwise the calculation is concluded]; (iii) re-fitting of the model to both datasets, and repeating (ii) onward. Either CDOM content or Chl a concentration was used as a partitioning variable. All analyses were performed in a R 3.5.0 environment (R Core Team 2018) using the party and vegan package. Besides this, Pearson correlation was used to analyse the relationship between percentage of AAPs (AAP%) and total suspended solids (TSS). To estimate the upper and lower bounds of the AAP%—TSS relationship, we used quantile regression to find the scaling of the quantiles describing the inner 95% of the AAP% values (i.e. the 0.025 and 0.975 quantiles). We evaluated AAP% scope as the interval between the fitted 2.5 and 97.5% quantiles of AAP%. Quantile regression was performed by the quantreg package (Koenker 2017).
RESULTS
Physicochemical variables
Various physical and chemical parameters were determined in the investigated lakes (see Table 1 and Supplementary Table 1). These parameters varied substantially depending on the study site. Lake Balaton was nutrient poor, i.e. characterised by the lowest content of inorganic nutrients, DOC, CDOM and phytoplankton biomass. Lake Fertő had a similar character in terms of inorganic nutrients, DOC and phytoplankton biomass; however, it had considerably higher CDOM values (Table 1). Compared with Lake Fertő, similar DOC concentrations and much lower CDOM were found in the studied fishponds. Moreover, these fishponds were more productive habitats than the above mentioned systems (having ~10-fold higher nutrient and 20-fold higher Chl a content). Soda pans exhibited the highest values of the measured physical, chemical and biological parameters with DOC, CDOM and Chl a concentrations of up to 1000 mg L−1, 7000 mg Pt L−1 and 1200 μg L−1, respectively.
Concentration of various substances in the studied shallow lakes. Abbreviations: EC (electrical conductivity), TSS (total suspended solids), CDOM (coloured dissolved organic matter), DOC (dissolved organic carbon), TN (total nitrogen), TP (total phosphorous), Chl a (chlorophyll a), n.d. (no data). Minimum and maximum values are represented by simple numbers. Mean values are highlighted in bold.
| pH | t (°C) | O2 (mg L−1) | O2 (%) | EC (µS cm−1) | TSS (mg L−1) | CDOM (mg Pt L−1) | DOC (mg L−1) | TN (mg L−1) | TP (mg L−1) | Chl a (µg L−1) | |
|---|---|---|---|---|---|---|---|---|---|---|---|
| Lake Balaton | 8.4–8.8 | 20–27 | n.d. | n.d. | 724–888 | 4–14 | 2–12 | 8–10 | 0.7–1 | 0.02–0.1 | 2–17 |
| 8.6 | 23 | 794 | 8 | 6 | 9 | 0.8 | 0.035 | 8 | |||
| Lake Fertő | 8.5–9.0 | n.d. | n.d. | n.d. | 2000–2440 | 3–61 | 18–247 | 16–41 | 0.9–2 | 0.045–0.06 | 8–24 |
| 8.7 | 2238 | 35 | 112 | 27 | 1 | 0.05 | 13 | ||||
| Fishponds | 7.9–8.9 | 22–27 | n.d. | n.d. | 154–860 | 21–104 | 26–83 | 10–30 | 1–12 | 0.1–0.5 | 73–1170 |
| 8.4 | 24 | 623 | 45 | 47 | 16 | 3 | 0.3 | 249 | |||
| Soda pans | 8.9–10.1 | 18–31 | 7–25 | 76–222 | 2560–16 100 | 89–4173 | 90–6943 | 36–988 | 3–32 | 0.3–18 | 7–1220 |
| 9.5 | 26 | 13 | 140 | 7266 | 1311 | 1220 | 147 | 8 | 6 | 151 |
AAPs and HBs in hypertrophic and polyhumic waters
As all of the studied lakes were supposed to be well oxygenated, the detected BChl-containing microorganisms were considered to AAPs. In Lake Balaton and Lake Fertő, 80% of AAPs exhibited in the vibrio form (i.e. curved rod), while in the fishponds and soda pans the proportion was between 50 and 60% (Fig. 1A and B). Curved filaments and cocci were also below 10% (Fig. 1C, D, F). Of note, the most diverse AAP communities were found in the fishponds (data not shown).
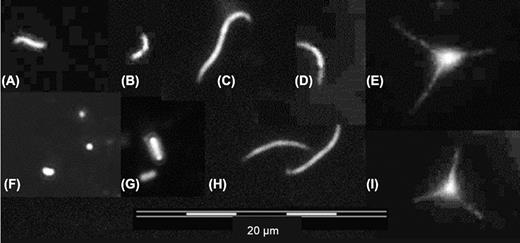
(A)-(I) Major aerobic anoxygenic phototroph (AAP) morphotypes in the studied shallow lakes.
AAP cells have proven to be larger than HB cells, except in Lake Fertő (Fig. 2). The largest AAP cells were detected in Lake Balaton and the fishponds, while the smallest ones were observed in Lake Fertő (Fig. 2).
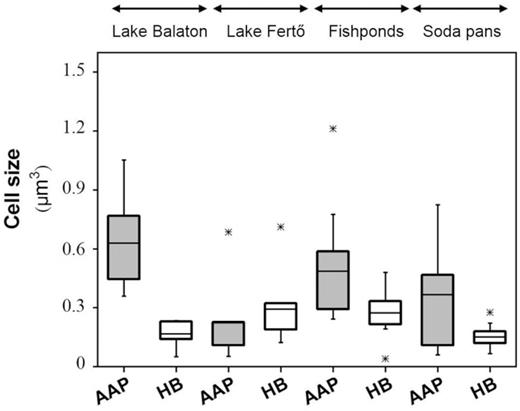
Distribution of aerobic anoxygenic phototroph (AAP) and heterotrophic bacterial (HB) cell volumes in the studied shallow lakes. The average values are represented as black lines. Out-of-range values are shown as stars.
AAP abundance in the studied lakes varied over a wide range. AAPs were least abundant with lowest biomass values in Lake Balaton. Values higher by over one order of magnitude were noted for Lake Fertő and in the fishponds. More than an order of magnitude higher values were observed in the studied soda pans (Table 2).
Abundance and biomass of aerobic anoxygenic phototrophs (AAP) and heterotrophic bacteria (HB) and AAP contribution to total bacteria (TB). Average values are highlighted in bold.
| AAP abundance (104 cells mL−1) | HB abundance (104 cells mL−1) | AAP abundance contribution to HB (%) | AAP biomass (µg L−1) | HB biomass (µg L−1) | AAP biomass contribution to HB (%) | ||
|---|---|---|---|---|---|---|---|
| Lake Balaton | min-max | 2–19 | 148–3080 | 1–7 | 30–168 | 469–4349 | 1–15 |
| mean | 10 | 1198 | 2 | 84 | 1856 | 7 | |
| Lake Fertő | min-max | 72–349 | 579–1962 | 6–34 | 59–492 | 1715–7022 | 1–28 |
| mean | 151 | 995 | 17 | 253 | 3632 | 12 | |
| Fishponds | min-max | 88–415 | 923–5946 | 3–14 | 282–4780 | 1860–15 527 | 3–31 |
| mean | 214 | 2897 | 8 | 1042 | 8007 | 12 | |
| Soda pans | min-max | 92–3064 | 2963–95 171 | 1–28 | 90–14 507 | 9004–128 526 | 1–65 |
| mean | 1015 | 18 290 | 10 | 3961 | 27 758 | 22 |
In general, HB abundance and biomass were higher (by an order of magnitude) than those of AAPs (Table 2). Similar to AAPs, the lowest heterotrophic bacterial abundance was detected in Lake Balaton. Again, higher HB abundances were observed in Lake Fertő and in the fishponds than in Lake Balaton and very high values were observed in the studied soda pans (Table 2).
AAP contribution to HB abundance varied from 1 to 34%, while their contribution to the corresponding biomass was usually higher, ranging between 1 and 65% (Table 2). Again, the lowest percentage of AAPs was noted for Lake Balaton. Higher values were observed in Lake Fertő, while the highest ones were found in the fishponds and in the soda pans (Table 2).
Factors influencing the abundance of AAPs and HBs
RDA showed that the abundance of AAP and HB, as well as the percentage of AAP, was explained by Chl a concentration, CDOM, pH, TP, DOC and TSS (global ANOVA-like permutation test, F = 14.814, P = 0.001, Fig. 3). We also performed significance tests for each explanatory variable. The results showed that Chl a concentration had the strongest effect (ANOVA-like permutation test, F = 34.535, P = 0.001) followed by CDOM (ANOVA-like permutation test, F = 43.307, P = 0.001), DOC (ANOVA-like permutation test, F = 3.996, P = 0.026) and TSS (ANOVA-like permutation test, F = 3.298, P = 0.043); (Fig. 3).
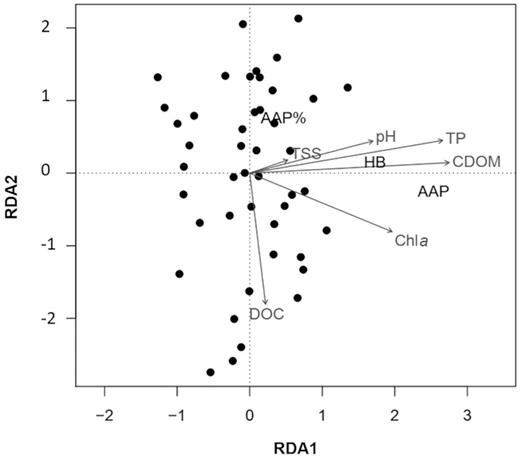
Ordination biplot of redundancy analysis (RDA). Filled circles represent sampling stations, text in black represents response variables (AAP—abundance of aerobic anoxygenic phototrophs; HB—abundance of heterotrophic bacteria), while grey texts and arrows represent explanatory variables (pH, TP—total phosphorus, CDOM—coloured dissolved organic matter, Chl a—chlorophyll a).
A significant positive relationship was noted both between AAP abundance and Chl a concentration, and between AAP abundance and CDOM content (Fig. 4A and B). AAP abundance increased with Chl a concentration at both low and high CDOM content; however, this relationship highly depended on CDOM content (Fig. 4A, Supplementary Table 2). Using MOB analysis (see Materials and Methods), we determined a CDOM content threshold of 51.81 Pt mg L−1 and divided the investigated water samples into two groups (i.e. representing values below and above this threshold). In waters below the threshold, a significant positive relationship was apparent between the AAP abundance and Chl a concentration, while above the threshold (i.e. in polyhumic waters), the relationship was not significant (Fig. 4A and Supplementary Table 2).
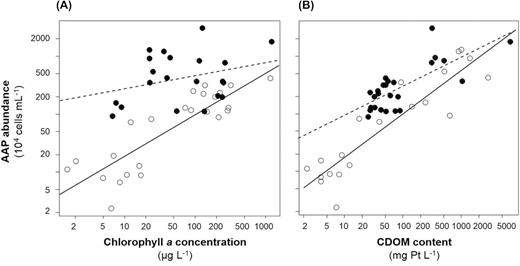
(A) Relationship between aerobic anoxygenic phototroph (AAP) abundance and chlorophyll a (Chl a) concentration. Open and filled circles represent sampling stations with coloured dissolved organic matter (CDOM) content below and above 51.81 Pt mg L−1, respectively. (B) Relationship between AAP abundance and CDOM content. Open and filled circles represent sampling stations with Chl a concentration below and above 40 µg L−1, respectively.
A similar positive relationship was observed between AAP abundance and CDOM content (Fig. 4B). As above, MOB analysis revealed the impact of phytoplankton biomass (Chl a concentration) on this relationship (Fig. 4B, Supplementary Table 2). We determined a MOB-based threshold of 40 μg Chl a L−1 and divided the water samples into two groups, i.e. with values below or above this threshold. A positive relationship was apparent between AAP abundance and CDOM content in both groups; however, the slope of the fitting curve was significantly steeper in water with high phytoplankton biomass than in water with low phytoplankton biomass (Fig. 4B and Supplementary Table 2).
Similar to AAP abundance, HB abundance was positively correlated with Chl a concentration (Fig. 5B). Indeed, the strength of the relationship was influenced by CDOM content. MOB analysis determined a threshold value of 56.1 mg Pt L−1, which was similar to the threshold determined by analysing the impact of CDOM content on the relationship between AAP abundance and Chl a concentration (see above and Supplementary Table 2). In both sets of samples (i.e. below and above the threshold), a positive relationship between HB abundance and Chl a concentration was noted (Fig. 5A and Supplementary Table 2).
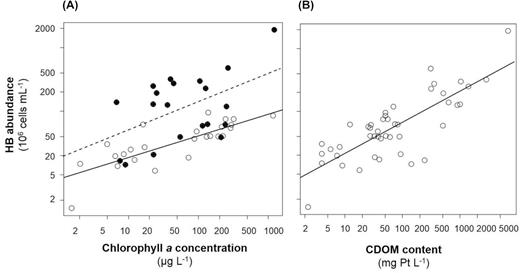
(A) Relationship between heterotrophic bacterial (HB) abundance and chlorophyll a (Chl a) concentration. Open and filled circles represent sampling stations with coloured dissolved organic matter (CDOM) content below and above 56.1 mg Pt L−1, respectively. (B) Relationship between HB abundance and CDOM content. Open circles represent sampling stations with Chl a concentration without a threshold value.
As with the AAP abundance data (Fig. 4), HB abundance significantly increased with CDOM content (Fig. 5B and Supplementary Table 2). However, MOB analysis did not reveal any impact of Chl a concentration on this dependence (Fig. 5B and Supplementary Table 2).
By evaluating the association between AAP% and other parameters, a significant relationship was found only between AAP% and TSS (Pearson correlation analysis, r = 0.404, P = 0.006). AAP% increased with increasing TSS content. As a result of quantile regression, the intercept of the fitted upper (0.975) quantile was 8.666 (± 13.975) and the slope was 6.206 (± 4.422) (Supplementary Fig. 1).
DISCUSSION
In the current study, AAP distribution and abundance was studied in shallow inland lakes, focusing on hypertrophic and polyhumic waters.
According to our results, AAP abundance spanned three orders of magnitude, ranging from 104 to 107 cells mL−1, which might be a consequence of the detected variations in trophic level and CDOM content in the studied lakes (Tables 1 and 2). AAP abundance in samples with relatively low CDOM content (i.e. Lake Balaton and the open water of Lake Fertő; Tables 1 and 2) was similar to that of Austrian oligo-mesotrophic lakes (Table 3) and Lake Stechlin in Germany (Čuperová et al. 2013; Cepáková et al. 2016). In the boreal lakes of Québec (Canada), AAP abundance was proven to be 5-fold higher compared with the preceding examples (Fauteux, Cottrell and Kirchman 2015) (Table 3).
Aerobic anoxygenic phototroph (AAP) abundance and contribution to total bacterial abundance in some inland waters. Data are listed according to increasing abundance. Concentration of chlorophyll a (Chl a), total phosphorous (TP) and dissolved organic carbon (DOC) is also indicated where available; n.d., no data.
| Environment | Sampling period | AAP abundance(104 cells mL−1) | AAP abundance contribution (%) | Chl a (µg L−1) | TP (µg L−1) | DOC (mg L−1) | References |
|---|---|---|---|---|---|---|---|
| freshwater lakes from arctic to trophic regions of the world | summer | n.d. | 0.2–18 | n.d. | 0.05–75 | 1–66 | Ferrera et al. 2017 |
| freshwater lakes, Czech Republic | seasonal | n.d. | 1–21 | 3–110 | 4–183 | 1–13 | Mašín et al. 2008 |
| freshwater lakes, Canada | July, August | 3.5–13.5 | 1–4 | 1–11 | 3–16 | 3–14 | Garcia-Chaves et al. 2016 |
| freshwater lakes, Austria | June–October | 0.1–13 | 1–29 | 0.7–2 | 0.3–2 | 0.3–2 | Čuperová et al. 2013 |
| freshwater lakes, Québec | seasonal | 15–55 | 1–37 | 1–55 | up to 110 × 103 | 1–13 | Fauteux, Cottrell and Kirchman 2015 |
| peat-bog lakes, Poland | summer | 3–130 | 1–18 | 3–113 | n.d. | 3–103 | Lew, Lew and Koblížek 2016 |
| glacial lakes, Germany, Poland and Finland | May, June, July | 10–120 | 2–12 | 1–36 | 9–81 | n.d. | Mašín et al. 2012 |
| peat-bog lakes, Poland | seasonal | 10–200 | 3–19 | 5–60 | n.d. | n.d. | Lew, Koblížek and Lew 2015 |
| freshwater lakes, Czech Republic, Germany | summer | 10–270 | 9–28 | 0.2–48 | 9–60 | n.d. | Cepáková et al. 2016 |
| saline steppe lakes, Russia, Ukraine and central Asia | August, September | 7–1680 | 0.2–65 | 1–180 | n.d. | n.d. | Medová et al. 2011 |
| freshwater lakes, Hungary | summer | 2–3064 | 1–34 | 2–1220 | 20–18 × 103 | 8–988 | current study |
In productive waters (i.e. in the fishponds and in some soda pans; see Table 1), AAP abundance was similar to that in other eutrophic and/or polyhumic lakes (Table 3). In the current study, we observed the highest AAP abundance (up to 3 × 10⁷ cells mL−1) in hypertrophic polyhumic soda pans (Table 2). This is the highest abundance value reported to date.
The main goal of our study was to investigate whether the trophic status (Chl a concentration) and/or CDOM levels play a role in determining AAPs in shallow inland lakes. RDA showed that the abundance of AAP and HB, as well as AAP%, was influenced considerably by Chl a concentration and CDOM content, and with lower significance by DOC and TSS (Fig. 3). MOB analysis showed that both Chl a concentration and CDOM content play an important role in determining the abundance of AAPs, and that the relationship between each of those concentrations and AAP abundance is influenced by the other (Figs 4A, B and 5A, B, Supplementary Table 2). AAP abundance increased with Chl a concentration at both low and high CDOM content; however, the relationship was much more pronounced below a threshold value of 51.81 mg Pt L−1. Above that threshold, AAPs were more abundant than in other humic-poor lakes with the same phytoplankton biomass (Fig. 4A and Supplementary Table 2). We noted a similar effect of Chl a concentration on the relationship between AAP abundance and CDOM content (however, this relationship appeared to be less significant than the previous one). AAP abundance increased with CDOM content, but the strength of this relationship was dependent on Chl a concentration. Here, the threshold was 40 μg Chl a L−1. Above that concentration, AAP abundances were higher than in lakes with the same CDOM content (Fig. 4B and Supplementary Table 2). Based on these findings, the observed AAP abundance might be a consequence of a simultaneously occurring high productivity (high Chl a concentration) and high CDOM content in the corresponding aquatic systems.
We also noted covariation between AAPs and HB, similar to that observed by Fauteux, Cottrell and Kirchman (2015) in northern lakes. Presumably, phytoplankton biomass and CDOM content determine the HB abundance, similar to that of AAPs. The observed positive correlation between HB and AAP abundances was similar to that reported by Fauteux, Cottrell and Kirchman (2015), despite the difference in (absolute) AAP abundance (Table 3). In the majority of examined lake waters, AAP cells were larger than HB cells. Similarly, Fauteux, Cottrell and Kirchman (2015) described a 2-fold size difference between the (larger) AAPs and the (smaller) HB in the temperate and boreal lakes of Quebec. In this sense, Lake Fertő is an exception, as the AAP and HB cell sizes were similar (Fig. 2).
Earlier studies emphasise the impact of phytoplankton biomass and CDOM (or DOC) content on AAP abundance. However, the reported tendencies are often contradictory. Fauteux, Cottrell and Kirchman (2015), for example, observed no correlation between AAP abundance and Chl a concentration, but reported a positive correlation between AAP abundance and DOC concentration and the DOC:Chl a ratio. By contrast, Mašín et al. (2008) reported a weak negative correlation between AAP abundance and DOC concentration. We observed neither of these correlations in the current study. In both cases, however, the reported DOC levels were well below the values reported herein (Fig. 6). To the best of our knowledge, only some peat-bog lakes in Poland exhibit CDOM content comparable with that in the polyhumic lakes investigated in the current study [up to 1820 mg Pt L−1 (Lew, Koblížek and Lew 2015, 2016) vs. up to 6900 mg Pt L−1 (current study)]. In these lakes, a weak negative correlation was noted between AAP abundance and CDOM content. This might be explained by a cross-effect of CDOM content and pH, and a strong positive relationship was indeed observed between AAP abundance and pH (Lew, Lew and Koblížek 2016).
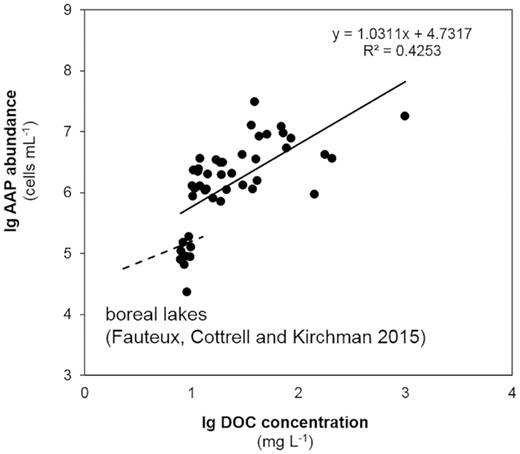
Relationship between dissolved organic carbon (DOC) concentration and aerobic anoxygenic phototroph (AAP) abundance compared with the results of Fauteux, Cottrell and Kirchman 2015. Our results are represented by black filled circles, the equation and the slope of the (solid) line is given in the corner of the figure. The results of Fauteux, Cottrell and Kirchman (2015) are marked as a dashed line without circles.
In contrast to other studies suggesting that light-derived energy might help the cells to incorporate hard-to-metabolise compounds, such as components of CDOM (Mašín et al. 2008 and references therein), we did not observe any selective advantage of AAPs over HB in waters with high CDOM content. Furthermore, the photosynthetic apparatus of AAP cells may offer only a small metabolic advantage overall, at least in the studied hypertrophic and polyhumic lakes. AAP% showed a significant correlation only with TSS content. TSS may influence microbial communities in several ways. For instance, both organic particles and bacterial cells can attach to inorganic particles and, hence, remain suspended in the water column. Indeed, in freshwater lakes, a large fraction of particle-attached AAP cells was observed (Mašín et al. 2012). The particle-attached lifestyle may also protect against grazing (Koblížek 2015). Besides this, TSS content itself also has a significant impact on grazing as several studies have demonstrated the decline of zooplankton feeding with increasing TSS (G.-Tóth, V.-Balogh and Zánkai 1986; Kirk 1991; Miquelis, Rougier and Pourriot 1998; Boenigk and Novarino 2004; Pfandl and Boenigk 2006). This decline is usually explained by the relative decrease of available food compared with non-ingestible inorganic particles. High abundances of such particles over the size range of potential food particles can lead to reduced population growth rates or even death of zooplankton. When suspended sediment concentration exceeds the threshold below which zooplankton species can effectively filter material, the organisms may starve even at high food abundance (Boenigk et al. 2004).
Therefore, the success of AAP cells at high TSS content (Supplementary Fig. 1) might be a result of decreased grazing control. AAP cells are on average larger than heterotrophic bacteria and this feature likely makes AAPs more vulnerable targets for protist grazing (Koblížek 2015). Thus, their abundance and contribution to total bacteria may be highly controlled by their selective grazing. On the contrary, the decline of the grazing control could result in predominance of AAPs. Accordingly, the proportion of AAPs increased rapidly in treatments when grazing pressure was reduced either by filtration or dilution (Ferrera et al. 2011).
CONCLUSIONS
AAPs were highly abundant (up to 3 × 10⁷ cells mL−1) in polyhumic and hypertrophic shallow lakes. AAP abundance was influenced by both phytoplankton biomass (Chl a concentration) and CDOM content, and these effects were interrelated. In humic-rich water (more than 52 mg Pt L−1), AAP abundance was significantly higher than in humic-poor water with the same phytoplankton biomass. Similarly, in the case of similar CDOM content, AAP abundance was higher in eutrophic water (Chl a concentration above 40 μg L−1) than in oligotrophic water. Hence, simultaneous hypertrophy and high CDOM content might lead to the observed AAP abundance. AAP contribution was remarkably influenced by TSS content: the success of AAP cells could be explained by high TSS levels. Predominance of AAPs might be the result of grazing-avoiding strategies (particle-attached lifestyle) or the decreased grazing control. These data have implications for improved understanding of the potential role of AAPs in freshwater.
ACKNOWLEDGEMENTS
We would like to thank Géza Dobos for help with sample collection, and Tímea Szabó and Balázs Németh for technical assistance. We are also grateful to Anett Kelemen for help with laboratory work.
FUNDING
This work was supported by the Hungarian Academic Foundation (OTKA) [grant no. PD112449 to B.S.; OTKA K128950 to G.B. and B.S.]; GINOP [grant no. GINOP-2.3.2-15-2016–00019; GINOP-2.3.2–15-2016–00004 to G.B.]; and the Hungarian Academy of Sciences [contract nr. VK-05/2017 to G.B. as a distinguished scientist hosted at the Centre for Ecological Research, Balaton Limnological Institute].
Conflicts of interest. None declared.
