


ABSTRACT
The rhizospheric microbiome appears to be one of the key determinants of plant health and productivity. In this study, to understand the assembly process of the rhizospheric microbiome, the effects of different sites, soils and plants on the rhizospheric microbiome were compared and examined using high-throughput sequencing. A series of comparisons of rhizospheric microbiomes were conducted using two plants (wild rice (Oryza rufipogon Griff.) and L. hexandra (Leersia hexandra Swartz)), two soils (high nutrient and low nutrient) and two sites (Guangdong and Hainan provinces in China). The results of the redundancy analysis, between-class analysis and coinertia analysis indicated that the factors shaping the rhizospheric microbiome (in decreasing order of strength), were the site, soil and plant. The effects of plants on the rhizospheric microbiome were slight and unobvious, with relatively low-explained variations and few core groups and indicator groups; however, the effects were significant across different sites and soils, especially for specific microbial groups that are closely associated with plants, such as pathogens, symbionts, and saprotrophs. Furthermore, rhizospheric fungi were more strongly influenced by plants than rhizospheric bacteria. Our results provide insights into the relationships among multiple factors that shape the rhizospheric microbiome in natural ecosystems and highlight the effects of plants across regional environmental shifts.
INTRODUCTION
The rhizospheric microbiome, a subset of the total soil microbial community (Buée et al. 2009), plays a critical role in plant health, nutrient uptake and biogeochemical cycling (Berendsen, Pieterse and Bakker 2012; Philippot et al. 2013). The rhizospheric microbiome is governed by multiple factors, including plant development, plant genotype, soil characteristics, and regional environmental conditions and by the interactions among these factors (Philippot et al. 2013; Nuccio et al. 2016). Identifying the complex factors that control rhizospheric microbial communities in natural ecosystems is a key starting point for harnessing the rhizospheric microbiome in agricultural and natural ecosystems, which is important for sustainable crop production and maintaining ecosystem health.
The rhizospheric microbiome inhabits the compartment between plant roots and soils; thus, the effects of plants on the rhizospheric microbiome should be stronger than those on the soil microbiome (Edwards et al. 2015; Shenton et al. 2016). Therefore, the effects of plants on the rhizospheric microbiome have received much attention. Studies have shown that host plants can profoundly impact the diversity, richness, relationships and activity of the rhizospheric microbiome (Tkacz et al. 2015; Pii et al. 2016), and most of these effects are induced via root exudates (Bakker et al. 2012; Chaparro, Badri and Vivanco 2014). Differences in species, growth stages, cultivars and even genotypes of host plants can influence the rhizospheric microbiome (Chaparro, Badri and Vivanco 2014; Huang et al. 2014; Lima et al. 2015; Shenton et al. 2016). However, most of these research studies were performed under greenhouse and laboratory conditions, where environmental variability is controlled (Berg and Smalla 2009; Walters et al. 2018). In natural environments, many other factors in addition to plants can shape the rhizospheric microbiome, the most important of which are soil properties and geographic location, i.e., regional environmental shifts (Neumann et al. 2014; Edwards et al. 2015; Na et al. 2018). To date, it remains unclear how the rhizospheric microbiome responds to the complex conditions associated with plants, soils and environments in natural ecosystems. The relative effects of these various factors in natural ecosystems and whether plants remain key determinants of the rhizospheric microbiome under these conditions need to be further studied.
Previous studies have confirmed that root exudation and development, the major plant-associated factors that affect the rhizospheric microbiome, are affected mainly by soil properties (Carvalhais et al. 2011; Neumann et al. 2014). Furthermore, soils at different sites always exhibit different properties from each other. Consequently, some studies have reported that regional environmental shifts, including shifts in climate and soil properties, are the ultimate determinants of the rhizospheric microbiome (Shakya et al. 2013; Gehring et al. 2014). Therefore, it is reasonable to hypothesise that in natural ecosystems, the factors that shape the rhizospheric microbiome are as follows (in decreasing order of strength): regional environmental shifts, soils and plants. However, whether the effects of plants on the rhizospheric microbiome can be observed across regional environmental shifts remains to be determined, and few studies have attempted to address this question directly. However, information can be obtained from studies that focus on the soil microbiome, and they have indicated that plants can recruit stable core microbiomes across different soils and environmental shifts (Yeoh et al. 2017; Walters et al. 2018). Thus, we further hypothesised that the effects of plants on the rhizospheric microbiome can be observed across environmental shifts.
Common wild rice (Oryza rufipogon Griff.), an ancestor of Asian cultivated rice (Oryza sativa L.), was selected as an experimental plant. Previous studies have suggested that the rhizospheric microbiome of wild rice may have contributed to the evolution and survival of this plant (Shi et al. 2018; Tian et al. 2018). Currently, reserves have been established in many areas to protect wild rice as a vital genetic resource for rice breeding. In these reserves, wild rice is always associated with Leersia hexandra Swartz (L. hexandra), a hygrophytic Cr-hyperaccumulator plant (Zhang et al. 2007). The wild rice and L. hexandra from these reserves served as the materials for our experiments, which were conducted in Guangdong and Hainan provinces (representing different regions). In each province, two reserves (representing different soils) were selected, and in each reserve, the rhizospheric soils of wild rice and L. hexandra (representing different plants) were sampled to compare the differences in the rhizospheric microbiomes.
The rhizospheric microbiome is shaped by multiple factors, and complex interactions occur among these factors (Philippot et al. 2013; Gehring et al. 2014). Furthermore, the sensitivity and objectives of different analyses were different. When examining changes in rhizospheric microbial communities, it is necessary to choose a suitable and highly sensitive analytical method because the effects may not be detected with unsuitable or low-sensitivity tests. Thus, to perform more in-depth and comprehensive analyses of the effects of plants, soils and environmental shifts on the rhizospheric microbial community, a series of comparisons of rhizospheric microbiomes among different plants, soils and regions were conducted in southern China. The aims of this experiment were as follows: 1) to determine whether the effects of plants on the rhizospheric microbiome can be observed across contrasting soils and in tropical and subtropical regions of China and 2) to compare the different influences among plants, soils, and regional environments on rhizospheric microbiome communities.
MATERIALS AND METHODS
Sampling method
From June 16–25, 2017, samples were collected from four natural wild rice reserves in Guangdong (Dalingcun and Pengshancun) and Hainan (Mingxingcun and Shuibiancun) provinces in southern China. In each reserve, wild rice has been protected for at least 30 years without tillage, fertilisation and pesticides application and other agricultural disturbance. The soil properties of the two reserves in each province were distinctly different, with one representing high-nutrient soil and the other representing low-nutrient soil (Table S1). The monthly mean temperature of June 2017 was 25.8 and 27.3°C in Guangdong and Hainan, respectively. The specific climate, including the climate of sampling time (June 2017), of each region and the soil properties of each reserve are shown in Table S1.
In each reserve, four sampling plots (1 m2), in which wild rice was present with L. hexandra, were randomly selected, and the distances between the plots were greater than 20 m. In each plot, five plants (“S” distribution) for each species (wild rice and L. hexandra) were selected for sampling. Five soil samples (approximately 0–20 cm in depth) were collected along with the roots and mixed as one sample. In total, 32 soil samples were collected, and four replicates were performed for each treatment.
The samples were preserved in dry ice and transported to the laboratory. To obtain the rhizospheric soil, the roots were shaken to remove loose soil, and then the clods (larger than 0.5 cm) attached to the roots were gently removed. The soil that adhered tightly to the roots was regarded as the rhizospheric soil. The rhizospheric soil was isolated by washing the roots with sterile water, followed by high-speed centrifugation (10 000 × g, 5 min) to collect the sediment. The samples were then stored at −80°C until use. Simultaneously, the loose soil was collected to determine the physicochemical properties of the soil. The 32 loose soil samples were removed from the visible litter, sieved with a 2-mm-diameter screen, and air dried at room temperature.
Analysis of soil properties
Soil organic carbon and total nitrogen levels were determined by dry combustion using a C/N analyzer (LECO Corporation, MI, USA). The levels of available nitrogen were determined using the alkaline hydrolysis diffusion method (Lu 1999). The levels of available phosphorus and potassium were determined using the Bray-1 and ammonium acetate extraction methods, respectively (Lu 1999). The soil pH was measured in a dilution of the soil in water (1:2.5). The samples were allowed to equilibrate for 30 min before the pH was measured.
Soil DNA extraction, gene amplification and high-throughput sequencing
Soil DNA was extracted from 1 g of rhizospheric soil from each sample (32 in total) using a Fast DNATM SPIN Kit (MP Biomedicals, CA, USA) according to the manufacturer's instructions. Partial 16S rRNA genes and ITS amplicons were generated for each sample using barcoded primers. The primer pair used to amplify the V3-V4 hypervariable regions of the bacterial 16SrRNA gene was 341F (5’-CCTACGGGNGGCWGCAG-3’) and 785R (5’-GACTACHVGGGTATCTAATCC-3’) (Thijs et al. 2017). The primer pair used to amplify the fungal ITS region was ITS3F (5'-GATGAAGAACGYAGYRAA-3') and ITS4R (5'-TCCTCCGCTTATTGATATGC-3') (White et al. 1990). The PCR program was as follows: 2 min at 95°C; 25 cycles of 95°C for 30 s, 55°C for 30 s, and 72°C for 45 s; and a final extension step at 72°C for 10 min. The PCR products were purified using a Qiagen PCR Purification Kit (Qiagen, Inc., Shanghai, China) and pooled at equimolar concentrations. High-throughput sequencing was performed using the Illumina HiSeq 2500 PE250 platform (Biomarker Technologies Co. Ltd., Beijing, China). All sequence data generated in this study are available in the NCBI Sequence Read Archive under project number PRJNA515797.
The raw sequences were primarily processed using the pipeline established for Illumina amplicon sequencing data (Bokulich et al. 2013; Kozich et al. 2013). In brief, the raw sequences were merged using Flash software (v1.2.7) to obtain raw tags (Magoč and Salzberg 2011), and then the raw tags were filtered using Trimmomatic software (v0.33) to remove the adapters and unique (i.e., singleton) sequences and conduct quality filtering and dereplication to obtain clean tags (Bolger, Lohse and Usadel 2014). Chimeric sequences were removed with UCHIME (v4.2), and effective tags were obtained (Edgar et al. 2011). All of the remaining sequences from each sample were clustered into operational taxonomic units (OTUs) based on 97% sequence similarity using UCLUST in QIIME (v1.8.0) (Caporaso et al. 2010; Edgar 2010). Taxonomy was assigned for each phylotype using the RDP Classifier based on the SILVA database (release 132) for bacteria and the UNITE database (v7.0) for fungi (Kõljalg et al. 2013; Yilmaz et al. 2014). Chloroplast, mitochondria and low-abundance OTUs represented by 10 or fewer sequences in all samples were removed.
Statistical analysis
To explore the dissimilarities of the rhizospheric microbiome among different factors, a redundancy analysis (RDA) and between-class analysis (BCA) were performed in R v3.5.1 using the package 'vegan' and 'ade4', respectively (Dray and Dufour 2007; Oksanen et al. 2018; R Core Team 2018). The BCA is a type of principal component analysis (PCA) with instrumental variables, and only a single factor as an explanatory variable. A PCA was performed to create BCA tables using the function 'bca'. A Monte Carlo test was used for the BCA using 999 random permutations. Matrices of OTU abundance data were subjected to Hellinger's transformation before the PCA and RDA. The significance of the effects of different factors on community structure was confirmed via PERMANOVA and ANOSIM tests using the 'adonis' and 'anosim' in 'vegan', respectively. These two tests were performed on the Bray–Curtis dissimilarity values of the microbial communities. To determine the similarities of the rhizospheric microbiome among different factors, a coinertia analysis (COIA) as well as Mantel and Procrustes tests were performed in R using the package 'ade4' and 'vegan', respectively. The COIA is a multivariate method that identifies trends or correlations in multiple data sets (Culhane, Perrière and Higgins 2003). PCA tables were used to conduct the COIA using the function 'coinertia'. The Monte Carlo test was used for COIA using 999 random permutations using the 'RV.test' function (Schlemper, van Veen and Kuramae 2018). Rhizospheric microbiome covariance scores among different factors were obtained by COIA. Mantel and Procrustes tests were performed on the Bray–Curtis dissimilarity values of the microbial communities using the functions 'mantel' and 'protest', respectively.
To compare the specific variations in rhizospheric microbiome communities under the effects of plants, soils and environment shifts, the core groups and indicator groups at the genus level were determined using the 'RAM' and 'indicspecies' package, respectively (De Cáceres and Legendre 2009; Chen, Simpson and Levesque 2018). The core groups of one factor were identified as the genera present in all samples of the factor. Only OTUs with a relative abundance higher than 0.1% were consider when calculating the core groups. The indicator groups of each factor were determined by a multilevel pattern analysis using the 'multipatt' function. In addition, the OTU numbers and ACE and Shannon indices were calculated for each sample using mothur (v1.30) to compare the diversity and richness among different treatments (Schloss et al. 2009). The relative abundances of the top 10 classes between samples were visualised using the barplot function.
RESULTS
Dissimilarity analyses of rhizospheric microbiome structures
The RDA showed that 42.5% (F = 9.24, P = 0.001) and 37.6% (F = 7.87, P = 0.001) of the variance of the rhizospheric bacteria and fungi, was explained by the first two axes, respectively. For both bacteria and fungi, the variance was best explained by sites and soils, while only a small portion of the variance was explained by plants (Fig. 1). The ANOSIM and PERMANOVA tests showed that the differences in the rhizospheric microbiome structure became increasingly significant with differences in the plants, soils and sites (Fig. 1, Table S2). For both bacteria and fungi, the dissimilarities detected by the BCA among different sites, soils and plants were significant (Table 1). Furthermore, different sites explained the highest percentage of total variation in both bacteria (19.40%, P = 0.001) and fungi (15.33%, P = 0.001), followed by different soils and plants. Although different plants explained the lowest percentage at 8.13% (P = 0.013) for bacteria and 9.28% (P = 0.001) for fungi, the effects were significant (Table 1). The BCA results were consistent with the ANOSIM and PERMANOVA results, although the BCA was more sensitive than the other two analyses because it suggested that plants had significant effects under all conditions.
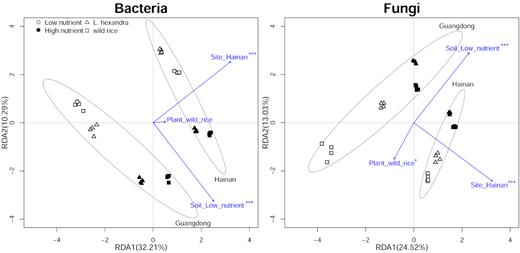
Redundancy analysis (RDA) plot based on the Hellinger-transformed OTU abundance matrix. The 85% confidence ellipses were plotted for samples from the same site. Significant results labeled beside each arrow refer to P<0.05 (*), P<0.01 (**) and P<0.001 (***).
Between-class analysis and coinertia analysis of different factors.
| Group | Factors compared | Between-class analysis | Coinertia analysis | ||
|---|---|---|---|---|---|
| Variation explained | p | RV | p | ||
| Bacteria | Plant (wild rice vs. L. hexandra) | 8.13% | 0.013 | 0.88 | 0.001 |
| Soil (low nutrient vs. high nutrient) | 15.04% | 0.001 | 0.85 | 0.001 | |
| Site(Guangdong vs. Hainan) | 19.40% | 0.001 | 0.75 | 0.001 | |
| Fungi | Plant (wild rice vs. L. hexandra) | 9.28% | 0.001 | 0.96 | 0.001 |
| Soil (low nutrient vs. high nutrient) | 13.02% | 0.001 | 0.82 | 0.001 | |
| Site(Guangdong vs. Hainan) | 15.33% | 0.001 | 0.84 | 0.001 | |
BCA, ANOSIM and PERMANOVA analyses were also performed for each subset of one factor to compare the effects of the other two factors on the rhizospheric microbiome; thus, analyses were performed on different soils and plants in each site (Guangdong or Hainan) separately. The results were consistent with those analyses for all samples, which further demonstrated that the effects on the rhizospheric microbiome tended to increase with differences in plants, soils and sites (Tables S2, Supplementary Fig. S3).
In addition, the bacterial communities from different plants were not significantly different (p>0.1), while the fungal communities from different plants were relatively significantly different (P<0.1) (Table S2). This results indicated that fungi were influenced more strongly by plants than bacteria.
The results of these dissimilarity analyses indicated that plants had the weakest effects on the rhizospheric microbiome while the site had the strongest effects. However, the effects of different plants on the rhizospheric microbiome remained significant across different soils and sites.
Similarity analyses of rhizospheric microbiome structures
The COIA analysis showed that the similarity in rhizospheric bacteria increased with the different sites (RV = 0.75), soils (RV = 0.85) and plants (RV = 0.88), and the trend in similarity of rhizospheric fungi was consistent with that of bacteria (Table 1). The results of the COIA, which was performed for each subset of one factor separately, further confirmed that the similarity increased with differences in the sites, soils and plants (Table S3).
The Mantel and Procrustes tests showed that the similarity of rhizospheric bacteria was highest under the effect of plants. For rhizospheric fungi, the highest similarity was observed between different soils. For both bacteria and fungi, the lowest similarity was observed between different sites (Table S4). The reliability of COIA was higher than that of the Mantel and Procrustes tests because the results of the Mantel and Procrustes tests were not consistent with those of other methods for rhizospheric fungi.
The results of the similarity analyses confirmed the results of the dissimilarity analyses. The differences in the rhizospheric microbiome between different sites were more significant than those between different soils and different plants, and the differences between different plants were most indistinct but could be detected. In addition, plants influenced the rhizospheric fungi more than rhizospheric bacteria.
Specific variations in rhizospheric microbiome communities
According to the core group analysis, 52 rhizospheric bacterial genera and 7 rhizospheric fungal genera were the core groups present in all 32 samples and accounted for 93.6% and 30.6% of the bacterial and fungal sequences, respectively (Fig. 2). The core groups of the rhizospheric microbiome were most influenced by the sites. When comparing soils and plants, the core bacteria were more influenced by soils while the core groups of fungi were more influenced by plants.
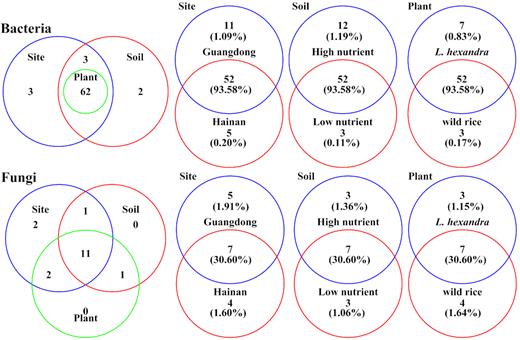
Venn plots of core groups of rhizospheric microbiome of different plants, soils and sites. Core groups of one factor were identified as the microbial genera presented in all samples relative to the factor. Numbers outside parentheses are the number of core genera identified for each factor. Numbers in parentheses are the relative abundances of core groups.
Specifically, 16, 15 and 10 bacterial genera were core groups were affected by sites, soils and plants, respectively, because they were only identified as core groups of one aspect of each factor. All 10 core genera affected by plants were affected by sites and soils simultaneously, whereas 3 core genera (Bacteroides, Dechloromonas and Leadbetterella) were only influenced by sites and 2 (Bacteroidetes bacterium and Clostridium sensu strict 1) were only influenced by soils (Fig. 2, Table S5).
For fungi, 9, 6 and 7 core genera were affected by sites, soils and plants, respectively. Four core genera (Leptosphaeria, Ophiosphaerella, Phaeosphaeria and Sarocladium) were affected by sites, soils and plants simultaneously. Two core genera (Edenia and Periconia) were only influenced by sites, but no core genus was only influenced by soils or plants (Fig. 2, Table S5).
The multilevel pattern analysis showed that for both rhizospheric bacteria and rhizospheric fungi, the relative abundances of all indicator groups as well as the number of indicator groups of different plants were much lower than those of different soils and different sites (Fig. 3, Supplementary Fig. S1).
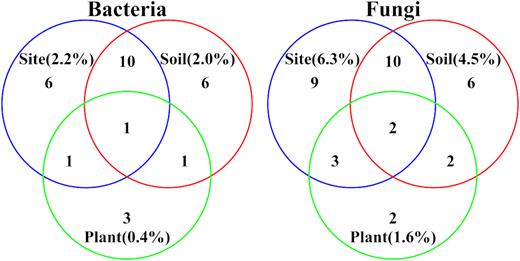
Venn plots of indicator groups of rhizospheric microbiome of different plants, soils and sites. Indicator groups were identified by the multilevel pattern analysis. Numbers outside parentheses are the number of indicator genera identified for each factor. Numbers in parentheses are the relative abundances of indicator genera.
For bacteria, Anaerofilum was an indicator group of all three factors, indicating that this group was most susceptible to environmental change. When comparing indicator groups of different factors, among the 18 indicator groups of different sites, 6 genera (Blastocatella, Mesorhizobium, Paludibaculum, Rhizomicrobium, Sulfurospirillum and Unclassified Fimbriimonadaceae) were identified as unique indicator genera of different sites, and the other 12 genera were also identified as indicator groups of different soils or plants. The same conditions were observed for different soils. For different plants, only 3 genera, namely, Cohnella, Ohtaekwangia and Tumebacillus, were not identified as indicator groups of different soils and sites from the 6 total indicator genera (Fig. 3, Supplementary Fig. S1).
For fungi, the relative abundances and the number of indicator groups were higher than those of bacteria. Sclerotium and Unclassified Dothideomycetes were identified as indicator groups of all three factors. For different factors, there were 9 (Aspergillus, Curvularia, Hannaella, Microdochium, Periconia, Unclassified Chaetomiaceae, Unclassified Hypocreales, Unclassified Pleosporaceae, and Unclassified Ustilaginaceae), 6 (Acremonium, Leptosphaeria, Occultifur, Thermomyces, Unclassified Bionectriaceae and Westerdykella) and 2 genera (Arthrinium and Phoma) that were identified as unique indicator groups of different sites (24 indicator genera in total), soils (20 indicator genera in total) and plants (9 indicator genera in total), respectively (Fig. 3, Supplementary Fig. S1).
In addition, for all calculated alpha diversity indices, including the OTU number, Shannon index and ACE, no significant differences were observed between different respects for each factor (Supplementary Fig. S2). The differences in the relative abundances of fungi were more obvious than those in the relative abundances of bacteria (Supplementary Fig. S3), which further confirmed that fungi were more strongly influenced by different factors, especially plants, than bacteria.
DISCUSSION
Effects of different plants on the rhizospheric microbiome were detected across different soils and sites
Our results showed that for both rhizospheric bacteria and fungi, sites and soils play major roles in community assembly, while plants play minor roles, which verified our first hypothesis that the influential strength of different factors on rhizospheric microbiome decrease in the order of site, soil and plant. Previous studies have compared the effects of sites and soils, or soils and plants on rhizospheric microbiome separately, and the results suggested that different sites had a stronger influence on the rhizospheric microbial community than soils while soils had a stronger influence than plants (Nuccio et al. 2016; Schlemper, van Veen and Kuramae 2018). The present study directly compared the effects of three factors on rhizospheric microbiome in southern China and provided further evidence of their influential strength.
Furthermore, the BCA and COIA analyses suggested that the effects of plants on the rhizospheric microbiome were significant across different sites and soils, and the core group and indicator group analyses found that microbial genera were influenced by plants, which supported our second hypothesis. These results provide evidence for the effects of plants across different sites and soils in natural ecosystems, which further support previous results derived from greenhouse and laboratory conditions.
Plants primarily affected the rhizospheric microbiome which was closely associated with plants
Although our hypotheses were verified, it is noteworthy that the effects of plants on the rhizospheric microbiome may surpass the effects of soils, especially for rhizospheric fungi, as suggested by Mantel and Procrustes tests, as well as the core group analysis. The more significant effects of plants on rhizospheric microbiome could be explained by the different influence mechanisms between plants and environmental properties, including soils and sites.
When we focused on the differences in specific rhizospheric microbial groups, the effects of different factors on the rhizospheric microbiome and the mechanisms were clarified. According to our results, the indicator groups and core groups affected by plants were all groups that pathogenic, symbiotic, or closely associated with litter degradation. That is, most groups affected by the plants were closely associated with plants. For instance, five indicator genera that were unique for plants included two pathogenic genera (Phoma and Tumebacillus), two genera related to litter degradation (Cohnella and Ohtaekwangia) and one endophytic fungi (Arthrinium) (Aveskamp, De Gruyter and Crous 2008; Crous and Groenewald 2013; Ma et al. 2015; Shen et al. 2015; Arneodo et al. 2019). The seven fungal core genera affected by plants, however, included six pathogenic genera (Sarocladium, Ophiosphaerella, Phoma, Phaeosphaeria, Leptosphaeria and Monographella) and 1 symbiotic genus (Mortierella) (Perry, Tomaso-Peterson and Baird 2010; Abd Aziz et al. 2018, Wang et al. 2018; Lei et al. 2019; Tayyab et al. 2019). Other studies also observed the profound effects of plants on specific groups that were closely associated with plants, including the core root microbiome or mutualistic groups such as arbuscular mycorrhizal fungi (Wei et al. 2016; Pfeiffer et al. 2017; Yeoh et al. 2017). Therefore, it is reasonable that these groups were more influenced by plants than other factors.
Furthermore, the effects of plants on the rhizospheric microbiome were dependent on both the root exudate chemistry and microbial substrate preferences (Chu et al. 2011; Zhalnina et al. 2018), which results in only a subgroup of rhizospheric microbiomes being influenced by plants. Taken together, plants only had stronger effects on the rhizospheric microbiome subgroup that was closely associated with plants. For other microbial groups, the effects of plants may not be significant.
Effects of soils and sites on rhizospheric microbiome were more general than those of plants
For most rhizospheric microbial groups, the effects of soils and sites on the rhizospheric microbiome were stronger than that of plants. Our results indicated that the effects of soils and sites had a stronger but also more general effect on more groups than that of plants. For instance, the (i) results of the RDA, BCA and COIA analyses suggested that higher percent of variations in rhizospheric microbiome were explained by the effects of soils and sites than plants; (ii) the relative abundances as well as the number of core groups and indicator groups affected by sites and soils were higher than those affected by plants; and (iii) all the core genera affected by plants were also affected by soils or sites.
Previous studies found additional evidence to support the more general and stronger effects of soils and sites compared with that of plants. First, the effects of plants on the rhizospheric microbiome may be affected by sites or soils (Walters et al. 2018; Chang et al. 2019). Secondly, sites and soils may affect the growth conditions, biogeography and other properties of the plants and further affect the rhizospheric microbiome (Neumann et al. 2014; Shi et al. 2015, Tkacz et al. 2015; Coleman-Derr et al. 2016). Therefore, the effects of plants on rhizospheric microbiome hardly surpass those of sites and soils. Furthermore, sites and soils had a different effect on the rhizospheric microbiome compared with plants. For different sites and soils, the variations in these properties led to changes in the ecological niches of all the rhizospheric microbial groups; thus, the effects of these factors were more general than those of plants (Ramette and Tiedje 2007).
In addition, our results also indicated that the strong interactive effects of plants, soils and sites on the rhizospheric microbiome. Because no significant differences were detected in the alpha diversity for both bacteria and fungi, which were always observed for other studies in natural environments (Philippot et al. 2013; Yeoh et al. 2017), the effects of one factor were covered by that of other factors or dependent on other factors (Egamberdiyeva 2007). Therefore, when one of these factors is sufficiently strong, the other factors may be weakened (Ai et al. 2015). Thus, under a steeper environmental gradient than that used in the present study the effects of plants may be dominated by those of other factors and could be negligible.
Different responses of different microbial groups and community indices
Rhizospheric bacterial and fungal community structures exhibited different patterns in terms of the effects of sites, soils, and plants. Specifically, fungal communities were more strongly influenced by these factors, especially by plants compared with bacterial communities. Previous studies also observed that fungi were more sensitive to environmental shifts than bacteria (Bell et al. 2014; Schlemper, van Veen and Kuramae 2018; Xu et al. 2019), which may be a result of the versatility interactions of fungi with plants, acting as pathogens, symbionts, and saprotrophs (Montesinos-Navarro et al. 2016; Wei et al. 2016). Moreover, plants release different exudates with different chemical structural complexities (Berg and Smalla 2009; Zhalnina et al. 2018), which may have stronger effects on rhizospheric fungi than on bacteria. Moreover, the predominant bacterial groups were observed to be beneficial groups, such as Rhizobium and Flavobacterium (Biswas, Ladha and Dazzo 2000; Subhash, Sasikala and Ramana 2013), while the primary fungal groups, such as Gibberella and Myrothecium, have been reported to be pathogenic fungi (Ogawa and Takeda 1990; Piyaboon et al. 2016), which may be related to the negative interaction between fungi and bacteria due to exploitation competition (Rousk et al. 2008).
In addition to the different patterns of bacteria and fungi, different analysis methods also showed different results. For example, the BCA and COIA analyses indicated significant differences in rhizospheric microbiomes between different plants while the ANOSIM and PERMANOVA tests did not. The different results were derived from the different sensitivities of these analytical methods. In the present study, the results suggested that the BCA and COIA were the most sensitive methods for examination of different microbial datasets. However, the BCA and COIA methods are not widely used because they have stricter data format requirements than other methods. Instead, RDA, which is widely used in studies on microbial communities, is a second best choice.
Interestingly, no significant difference in alpha diversity was detected in the bacteria and fungi in this study, suggesting that alpha diversity may not be a powerful indicator of microbial community structure across multiple factors. In general, differences in alpha diversity among different communities always suggest the existence of significant differences among these communities. However, studies also found that the relatively high abundances of certain groups may lead to decreased diversity (Hartman et al. 2008); therefore, high diversity does not necessarily indicate that a community highly complex or stable (Xu et al. 2019). In this respect, when examining these diversity and richness indices, it is necessary to carefully consider the true significance of the diversity indices.
CONCLUSION
In this study, the effects of different sites, soils and plants on the rhizospheric microbiome were compared and examined via a series of comparative analyses. Our results clearly demonstrated that the effects of plants on the rhizospheric microbiome remain detectable across different sites and soils, although weaker than the effects of soils and sites in most conditions. Plants affected the rhizospheric microbiome in a different way compared with soils and sites. The effects of plants on the rhizospheric microbiome were focused on specific microbial groups closely associated with plants, such as pathogens, symbionts, and saprotrophs, while the effects of soils and sites were more influential and more general with no specific groups. Moreover, there were strong interactions among different influencing factors that affected the rhizospheric microbiome. These results give insights into the relationships among multiple factors that shape the rhizospheric microbiome and highlight the effects of plants across natural environmental shifts.
ACKNOWLEDGEMENTS
The authors declare no conflicts of interest.
FUNDING
This work was supported by the National Natural Science Foundation of China (41807049, 41571255), the National Key Research and Development Program of China (2016YFC0501202), the Science and Technology Development Project of Jilin Province of China (20180519002JH, 20180520090JH, 20190303070SF), the Key Research Project of the Chinese Academy of Sciences (KFZD-SW-112), the Science and Technology Development Project of Changchun City of China (18DY019), the Cooperative Project between CAS and Jilin Province of China (2019SYHZ0039), and the Science Foundation of Chinese Academy of Sciences (XDA23070501, XDB15030103).
Conflict of interest. None declared.
