


ABSTRACT
Climate warming and subsequent permafrost thaw may result in organic carbon and nutrient stores being metabolized by microbial communities, resulting in a positive feedback loop of greenhouse gas (GHG) soil emissions. As the third most important GHG, understanding nitrous oxide (N2O) flux in Arctic mineral ice-wedge polygon cryosols and its relationship to the active microbial community is potentially a key parameter for understanding future GHG emissions and climatic warming potential. In the present study, metatranscriptomic analyses of active layer Arctic cryosols, at a representative ice-wedge polygon site, identified active nitrogen-fixing and denitrifying bacteria that included members of Rhizobiaceae, Nostocaceae, Cyanothecaceae, Rhodobacteraceae, Burkholderiaceae, Chloroflexaceae, Azotobacteraceae and Ectothiorhodospiraceae. Unique microbial assemblages with higher proportion of Rhodobacteriales and Rhocyclales were identified by targeted functional gene sequencing at locations with higher (P = 0.053) N2O emissions in the wetter trough soils compared with the dryer polygon interior soils. This coincided with a higher relative abundance of the denitrification nirS gene and higher nitrate/nitrite concentrations in trough soils. The elevated N2O flux observed from wetter trough soils compared with drier polygon interior soils is concerning from a climate warming perspective, since the Arctic is predicted to become warmer and wetter.
INTRODUCTION
The disproportional rapid warming of the Arctic compared with the rest of the globe due to climatic change is resulting in permafrost thaw and subsequent decomposition of soil organic matter (SOM) (Graversen et al. 2008; Gittel et al. 2014). Arctic soil harbors ∼50% of the belowground global organic carbon pool, 88% of which occurs in the permafrost (Tarnocai et al. 2009). Microbial community composition and the availability of decomposers is thought to partially control the decomposition of the SOM (Gittel et al. 2014). Currently, frozen carbon stores are inaccessible to decomposition or are being metabolized at extremely low rates. However, as the Arctic warms and precipitation increases the active soil layer will deepen and these stores may become biologically available to microbial metabolism, resulting in further greenhouse gas (GHG) emissions [carbon dioxide (CO2), methane (CH4) and nitrous oxide (N2O)] via a positive feedback loop (Lawrence et al. 2008; Tarnocai et al. 2009; Schuur et al. 2015; Stackhouse et al. 2015; Mauritz et al. 2017; Salmon et al. 2018).
N2O is the third most important greenhouse gas, after CH4 and CO2. It is an ozone-depleting gas with a 100-year global warming potential 298 times higher than that of CO2 (Davidson and Kanter 2014). Studies on natural and anthropogenic emissions of N2O from soils have mainly concentrated on agricultural and tropical soils, as these tend to be well-known sources of N2O to the atmosphere (Butterbach-Bahl et al. 2013). However, models based only on agricultural and tropical soils as sources of N2O may miss important sources of N2O arising from Arctic environments that are disproportionately affected by climate change (Davidson and Kanter 2014).
N2O is a by-product of the nitrogen cycle, specifically denitrification in soils, sediments and bodies of water, with soils accounting for ∼70% of N2O emissions (Butterbach-Bahl et al. 2013). During denitrification, nitrate (NO3−) is stepwise reduced to nitrite (NO2−), nitric oxide (NO), nitrous oxide (N2O) and finally to dinitrogen (N2) through a series of reactions catalyzed by oxidoreductases. These are encoded by narGHI and napAB (nitrate reductases), nirS and nirK (nitrite reductases), norB and norVW (nitric oxide reductases) and nosZ (nitrous oxide reductase). However, depending on abiotic factors such as temperature, pH, water and oxygen availability, carbon to nitrogen ratio, and NO3−/NO2− availability, the denitrification process may be incomplete and result in significant N2O production in addition to N2 (ŠImek and Cooper 2002; Dalal and Allen 2008). The ratio of N2O to N2 tends to increase in environments with lower pH and low O2 availability (ŠImek and Cooper 2002; Dalal and Allen 2008). Because of this, topography plays an important factor in driving nitrogen soil–atmosphere exchanges in Arctic terrestrial ecosystems as topography is tightly linked to soil moisture patterns, SOM quality/quantity, soil nutrient content and chemistry, and vegetation (Stewart et al. 2014).
As the Arctic soils warm and microbial activity increases, so too do emissions of CH4 and CO2 (Graham et al. 2012). However, the low levels of nitrogen in these soils may limit microbial metabolism and the magnitude of carbon emissions (Sistla, Asao and Schimel 2012). In Arctic permafrost affected soils, nitrogen may enter the system through a combination of permafrost thaw leading to depolymerization of organic nitrogen-containing compounds and ammonia mineralization, atmospheric nitrogen deposition and nitrogen-fixation (Finger et al. 2016; Voigt et al. 2017). Nitrogen-fixation is thought to be a primary source of nitrogen into terrestrial Arctic ecosystems (Deslippe, Egger and Henry 2005), and plays an important role in N2O emissions, with higher nitrogen-fixation rates increasing the rate of nitrogen cycling in Arctic soils (Stewart et al. 2014). The rates of nitrogen-fixation will also likely increase as Arctic soils warm and dampen as a result of climatic change. This is due to higher rates of nitrogen-fixation in wetter and warmer soils, with the estimated optimal temperature for nitrogen-fixation in Arctic ecosystems being between 15–30°C (Hobara et al. 2006; Stewart et al. 2014). This may potentially diminish the nitrogen limitation barrier to microbial growth (Chapin, Bliss and Bledsoe 1991; Stewart, Coxson and Grogan 2011a; Stewart et al. 2014). Indeed, Hultman et al. (2015) gauged the activity of the microbial community in active layer soils and the underlying permafrost by looking at the ratios of RNA:DNA. They reported that the active layer appeared to have a higher RNA:DNA ratio of nif genes, suggesting that it harbors a more active community of nitrogen-fixers (Hultman et al. 2015). With the deepening of the active layer, these nitrogen-fixing communities may become significant sources of nitrogen influx to permafrost affected soils and further stimulate microbial metabolism and degradation of frozen carbon stores.
The denitrifying and nitrogen-fixing communities in Arctic polar regions are not well characterized, nor is their effect on GHG emissions, including N2O, well understood. Production and emission of N2O have been reported in laboratory permafrost core melting experiments (Elberling, Christiansen and Hansen 2010) and cryoturbation (a process resulting in the mixing of soil layers due to repeated freeze–thaw cycles) increases N2O emissions (Palmer, Biasi and Horn 2012). Permafrost soils already harbor organisms and genes involved in denitrification, nitrogen-fixation and ammonia assimilation (Yergeau et al. 2010; Hultman et al. 2015). Furthermore, these nitrogen-cycling genes are overall more abundant in the thawed permafrost compared with intact permafrost, including genes for nitrate assimilation and denitrification. However, genes coding for nitrite and nitrous oxide reductases are relatively lower in abundance in the thawed permafrost soils, suggesting a potential for incomplete denitrification and release of N2O upon thaw (Elberling, Christiansen and Hansen 2010; Taş et al. 2014).
In this study, we investigated the active microbial community that may be responsible for a potential positive N2O gas flux at a mineral (carbon poor) high centered ice-wedge polygon cryosol site in two soil locations in an ice-wedge polygon (IWP) terrain; the drier soils of the polygon interior and the wetter trough soils that overlay the ice-wedges (supplementary Fig. S1 available online). Since other than the moisture content, the soils in troughts and polygon interior soils tend to be abiotically similar (Drew and Tedrow 1962), this terrain provided a natural system in which to explore the effects of moisture content on the microbial community and the N2O gas flux. Mineral soils represent the majority of Arctic permafrost cryosols (Hugelius et al. 2014) and approximately 26% of land not covered by ice is composed of polar deserts (Walker et al. 2002). However, the majority of studies to date on GHG flux from Arctic soils, and, specifically N2O flux, have focused on carbon-rich organic peat soils (Marushchak et al. 2011; Palmer, Biasi and Horn 2012; Li et al. 2016; Voigt et al. 2016) and these studies do not link N2O flux to the microbial community present in the soils. Microbial composition and abundance is one of the main drivers that govern GHG fluxes from soils (Graham et al. 2012); thus, understanding how the underlying microbial community in Arctic soils is related to N2O flux and how that community shifts as conditions become warmer and wetter in the Arctic will help in predicting future GHG emissions from Arctic soils. Our approach to link the observed N2O flux with the active microbial community included metatranscriptome sequencing, quantitative PCR of denitrification gene (nirS), functional gene (nirS, nifH) targeted-amplicon sequencing, soil moisture and nitrogen soil content measurements, and in situ soil N2O gas flux measurements. This study is also the first comprehensive sequencing survey targeting denitrifying and nitrogen-fixing bacteria in mineral cryosols of an Arctic polar desert.
MATERIALS AND METHODS
Site and sample collection
The study site is located near the McGill Arctic Research Station (MARS), at Expedition Fjord, Nunavut on Axel Heiberg Island (AHI) in the Canadian high Arctic (coordinates- 79°26'N, 90°46'W). The active soil layer ranges from 60–73 cm in depth during the summer with the top 5 cm at 9 ± 0.8°C (Lau et al. 2015). The site is characterized by a high centered ice-wedge polygon terrain. Soil sampling for metatranscriptome sequencing was done in July 2013, the top 5 cm of the active layer surface soils from the trough and polygon interior (n = 2) were collected and immediately placed in RNA-Lifeguard Soil Preservation Solution (MoBio) and frozen at –20°C to maintain the integrity of RNA in the samples. Soils for functional gene amplicon sequencing (nirS, nifH), soil nitrogen/ammonia and moisture content and quantitative PCR (qPCR) analysis were collected in July 2015 from the active layer trough and polygon interior soils at the top 5 cm and bottom 25–30 cm belowground depths. The soil for functional gene amplicon sequencing and qPCR analysis was collected in sterile 50 mL Falcon tubes and immediately frozen at –20°C. Soil for nitrogen/ammonia and moisture content was collected in 500 mL Whirl-Pak bags and stored at –20°C.
Gas flux measurements, flux calculation and statistics
The in situ N2O soil gas flux was measured using a static chamber system (Collier et al. 2014) using inverted buckets outfitted with rubber stoppers for gas sampling, at both the trough and polygon interior soils. Gas flux measurements were preformed in the summer of 2015. The buckets were placed over bare, non-vegetated soils. Four replicates were collected for each soil type (at two separate polygons/troughs and over two consecutive days) over an 8 h period. The gas samples were collected in 20 mL evacuated glass vials and brought back to the laboratory to be analyzed by greenhouse gas analyzer GC 450 (Bruker, Germany). Each sample was simultaneously injected onto an electron capture detector (ECD), thermal conductivity detector and flame ionization detector. The N2O was analyzed on the ECD with argon as the carrier gas. The detection limit for on the GC is 0.1 N2O ppm. The concentration of N2O vs time was plotted and a linear regression with four time points in the time series of concentrations was used to calculate the slope (Collier et al. 2014). The slope of the regression was then used to calculate the N2O flux for each replicate (Collier et al. 2014). A two-tailed t-test was used to check for significance between the trough and polygon interior soil fluxes.
NO3− + NO2−, NH4+ and soil moisture measurements
Soils collected for soil moisture, NO3− + NO2−, and NH4+ measurements were placed in Whirlpack bags and kept frozen at –20°C during transportation. Soil moisture was measured in triplicate using ∼5 g of soil dried overnight in an oven at 105°C. The NO3− + NO2− and NH4+ measurements were performed in triplicate. First, 2 M KCl was added to the soils and shaken for 30 min, supernatant was then filtered and measured for extractible nitrogen (NO3− + NO2−, and NH4+). The NO3− + NO2− content was measured by colorimetry on a Flow Injection analyzer at 520 nm using a copperized cadmium column. The NH4+ content was measured by colorimetry on a Flow Injection analyzer using the sodium salycilate method at 660 nm.
DNA and RNA isolation and sequencing
The RNA for metatranscriptome sequencing was isolated using the MoBio RNA Power Soil Total RNA Isolation Kit with 15 g of soil. The total RNA was used to generate Illumina TruSeq libraries (part of this standard library preparation involves reverse transcription to cDNA) and metatranscriptome sequencing was performed on an Illumina MiSeq sequencer on a V3 reagent cartridge with 150 cycles, generating single 150 bp reads. The DNA for qPCR, and 16S rRNA and functional gene sequencing was isolated using the MoBio Power Soil DNA Isolation kit with 2 g of soil. Paired end sequencing of the nirS and nifH genes in triplicate biological replicates for each soil type (n = 12 per gene; trough soil at 5cm, polygon interior soil at 5 cm, trough soil at 25 cm and polygon interior soil at 25 cm) was performed by generating Illumina Nextera libraries using the V2 chemistry and sequencing on an Illumina MiSeq sequencer with 500 cycles. The nifH gene was chosen since it is the most widely used marker gene to identify nitrogen-fixing organisms (Gaby and Buckley 2012). Though both nirS and nirK are often used to assess the denitrifying microbial community, we focused on nirS, since nirK was shown to be of a much lower (∼1000×) abundance in Arctic soils compared with nirS (Palmer, Biasi and Horn 2012). Primers and annealing temperature used for amplicon preparation are summarized in supplementary Table S1 available online. All sequencing data was deposited to GenBank under BioProject PRJNA421174.
qPCR analysis and statistics
Quantitative PCR of the nirS and 16S rRNA genes was performed using iQ SYBR Green Supermix from BioRad using the manufacturer’s specifications. The qPCR was performed with DNA extracted from the top 5 cm of the soil (top) and soil at 25–30 cm (bottom) of the trough and polygon interior soils in triplicate. This resulted in a total of four soil types; trough top 5 cm; polygon interior top 5 cm; trough bottom 25–30 cm; polygon interior bottom 25–30 cm, done in triplicate (n = 12). qPCR was performed on three biological replicates per soil type with three total technical replicates per biological replicate. The qPCRs were performed on the BioRad iQ5 Multicolour qPCR Detection System and the CT values were acquired. The cycler program used was 3 min at 95.0°C, followed by 40× of 10 s at 95.0°C; 45 s at 54.0°C; 45 s at 72.0°C. The melt curve protocol included increasing the temperature by 0.5°C every 30 s from 55.0–95.0°C and was run following the amplification protocol to check for fidelity of the primers and ensure that only one product was produced during the amplification. Analysis of the qPCR data included first normalizing the target gene nirS to the 16S rRNA gene in each sample to control for DNA quality and quantity, thus producing the ∆CT (delta cycle threshold) values (Livak and Schmittgen 2001). The CT used was an average of the three technical replicates for each sample. We then used the CT value of the trough soil at 5 cm to calculate the relative changes in gene abundance between all the soil types, via the standard 2−∆∆CT method (Livak and Schmittgen 2001). This approach does not provide the total gene copy numbers of the target genes in the soil, rather it is a method to more accurately identify any relative differences in the amount of each target gene between the soil samples. Two-way ANOVA (supplementary Table S2 available online) was used to check if depth of soil sampling (5 cm vs 25–30 cm) or the location of the soil (trough vs polygon interior) had a statistically significant effect on nirS gene abundance in the soil, following this, two-tailed t-tests were performed between each soil sample type to test which soil location was statistically different in nirS abundance.
Bioinformatics and statistical analysis of sequencing data
For functional (nirS, nifH) targeted-amplicon sequencing the raw reads were analyzed using the CLC Genomics Workbench software with the Microbial Genomics Module plugin (Qiagen, Denmark). Quality and chimera filtering was done using default settings, operational taxonomic units (OTUs) clustering and taxonomic assignment were done using custom databases constructed from the FunGene functional gene database repository (http://fungene.cme.msu.edu/) (Fish et al. 2013) for the nifH and nirS genes (clustered at 90%, see Palmer, Biasi and Horn 2012), on fixed length trimmed sequences (390 bp for nirS, 390 bp for nifH). The closest uncultured and cultured relatives of OTU representatives were determined using BLAST for those OTU that were not able to cluster with cultured organisms from the databases (Altschul et al. 1990; Wheeler et al. 2007). PERMANOVA analysis was performed using CLC Genomics Workbench to assess whether soil depth (top 5 cm vs bottom 25 cm) or soil type (polygon interior vs trough soils) had a significant effect on microbial community composition. Alpha and Beta diversity was measured using Shannon and Bray-Curtis models, respectively, and the Bray-Curtis transformed data were used to preform principal component analysis (PCA) of the functional nifH and nirS genes, distance matrix and PCA plots were then generated using the Microbial Genomics Module of the CLC Genomics Workbench version 10.1.1.
Metatranscriptomic analysis of the raw reads was performed using the Meta Genome Rapid Annotation (MG-RAST) pipeline. The raw reads were quality controlled, filtered for artificial duplicates and annotated using the MG-RAST (Meyer et al. 2008). For the MG-RAST pipeline the raw sequences were uploaded, the pipeline options were left as default, low quality bases were trimmed, artificial replicate sequences removed, sequences with more than five ambiguous bases were filtered. SEED subsystems were used to produce the hierarchical functional annotations (Overbeek et al. 2014). Organismal annotations were made using the MG-RAST and the SSU database; the taxonomy is assigned based on ribosome-encoding genes from the SILVA database (Keegan et al. 2016) (Quast et al. 2013)). All metatranscriptome sequence data have been deposited to GenBank under Bioproject PRJNA421174.
Phylogenetic analysis
Alignment of the amplicon nirS sequences was performed using the ClustalW algorithm in MEGA software version 7.0 (Kumar, Stecher and Tamura 2016) with manual refinement of the alignments. The unrooted phylogenetic tree was constructed using the Maximum-likelihood statistical method based on the Tamura-Nei mode with 1000 Bootstrap replicates. The phylogenetic tree was then visualized using FigTree 1.4.3 (Rambaut 2012).
RESULTS AND DISCUSSION
N2O gas flux, soil NO3− + NO2−, NH4+ and moisture content
At the ice-wedge polygon site on AHI, the N2O gas flux at the trough soils overlaying ice-wedges was higher than in the interior of the raised polygon soils (P = 0.053); the flux was measured to be 0.291 (±0.086) mg N2O m−2 day−1 at the troughs and 0.121 (±0.16) mg N2O m−2 day−1 in the polygon interiors (Fig. 1). The content of NO3− + NO2− and NH4+ as well as soil moisture of the polygon interior and trough soils is summarized in Table 1. The in situ measurements of N2O gas flux in other parts of the Arctic and in laboratory experiments suggest that denitrification and release of N2O are occurring in Arctic permafrost affected soils and such flux has the potential to increase with permafrost thaw (Rodionow et al. 2006; Elberling, Christiansen and Hansen 2010; Marushchak et al. 2011; Brummell et al. 2014). The majority of Arctic N2O soil flux studies have concentrated on organic and peat soils; however, the flux at our mineral AHI ice-wedge polygon site is comparable (Marushchak et al. 2011; Palmer, Biasi and Horn 2012; Li et al. 2016; Voigt et al. 2016; Taş et al. 2018). Together, laboratory and field studies demonstrate that several factors such as vegetation, topography, sunlight, temperature, electron donor availability, carbon content, water content, freeze–thaw cycles and cryoturbation govern N2O emissions from these Arctic soils (Repo et al. 2009; Elberling, Christiansen and Hansen 2010; Marushchak et al. 2011; Palmer, Biasi and Horn 2012; Stewart et al. 2014; Li et al. 2016; Voigt et al. 2016). Marushchak et al. (2011) demonstrated that N2O emissions are occurring from Arctic peat permafrost soils in Russia and Finland, with the non-vegetated peat soils having much higher N2O emissions (10.3–1.08 mg N2O m−2day−1) compared with the vegetated soils that had negligible N2O releases; however, the authors did not detect N2O flux from non-vegetated mineral soils. This is in contrast to our results, as we were able to detect N2O fluxes in bare, non-vegetated mineral soils. Our results are also comparable to N2O flux at the Spitsbergen, Svalbard site in the high Arctic, where 0.17–0.37 mg N2O m−2day−1 flux was detected from soils in the presence of light, but a much lower flux and in some cases even uptake of N2O in the absence of sunlight (Li et al. 2016). Voigt et al (2016) demonstrated that experimental warming increased N2O emissions from vegetated and non-vegetated peat plateaus in the Finnish Lapland, but had negligible effect on N2O flux from upland tundra in a discontinuous permafrost zone. In contrast to our acidic mineral cryosols, N2O fluxes in three polar deserts with alkaline soils on Ellesmere Island, Canada were more varied and shifted between production and consumption depending on the specific site, and ranged between 0.35 and -1.02 mg N2O m−2 day−1, with production of N2O occurring not only at the surface of the soils, but throughout the soil profile down to the permafrost table (Brummell et al. 2014). Although N2O flux from agricultural and tropical soils has been the focus of most studies, understanding the drivers that govern the flux of N2O in polar Arctic soils, both organic peat and mineral, is important for predicting future climate models due to the large size (1 358 000 km2) of Arctic polar deserts (McCann et al. 2016).
![In situ gas concentration measurements in a static chamber at polygon interior (A) and trough (B) soils. Four replicates were done for each soils type (at two sites and on two consecutive days). Gas flux was then calculated to be 0.291 (±0.086) mg N2O m−2day−1 [0.0012 (±0.0036) mg N2O m−2h−1] in wetter trough soils, and 0.121 (±0.16) mg N2O m−2 day−1 [0.0050 (±0.0067) mg N2O m−2h−1] in the polygon interior soils. Error bars represent standard error of the mean (SEM).](https://oup.silverchair-cdn.com/oup/backfile/Content_public/Journal/femsec/95/5/10.1093_femsec_fiz049/2/m_fiz049fig1.jpeg?Expires=1750165456&Signature=0oN7Mjg8HapGhnPCgCpUGJCB0aofT2aTLlGbVFAiRDWUyPc~IVTrAwaKticIqRk06uM0ygkPO8JLFRxCZ2mHTGIQknSDIasD5TS99HTCL1s3Xvn4YpZtUnU2aaXmMXaxSs4Q389wCdmnlQryp6Io97E3K7RN4WlmvAOwzlLwcKB7LwD55ukm74GaY~b7EDqm4vzAu-j~RhAg9JQ7E0gWsYty7g6wxWN9vSc4No0G1xeeZFZ50XkuD9a-Lr5AmkDCdCwAZg2ocrY0B1PqlCgDfJt0k~rW2lP6lHzDqvwxc29Sngo~yNH56bM8xcwhVEwYf5PgbjAzOmnDCeg4YUhPAg__&Key-Pair-Id=APKAIE5G5CRDK6RD3PGA)
In situ gas concentration measurements in a static chamber at polygon interior (A) and trough (B) soils. Four replicates were done for each soils type (at two sites and on two consecutive days). Gas flux was then calculated to be 0.291 (±0.086) mg N2O m−2day−1 [0.0012 (±0.0036) mg N2O m−2h−1] in wetter trough soils, and 0.121 (±0.16) mg N2O m−2 day−1 [0.0050 (±0.0067) mg N2O m−2h−1] in the polygon interior soils. Error bars represent standard error of the mean (SEM).
The content of NO3− + NO2− and NH4+ as well as soil moisture of the polygon interior and trough soils at 5 cm and 25–30 cm. BDL denotes measurements below the detection limit of >0.7mg kg–1. Standard deviation (SD) is given in brackets.
| Soil type | N mg kg–1 dry soil as NO3− + NO2− | N mg kg–1 dry soil as NH4+ | % soil moisture content |
|---|---|---|---|
| Top 5 cm trough soil | BDL | 2.572 (±0.294) | 35.5 (±6.6) |
| Top 5 cm polygon interior soil | BDL | 2.173 (±0.301) | 13.0 (±1.6) |
| Bottom 25 cm trough soil | 3.440 (±0.133) | 1.182 (±0.143) | 18.8 (±0.29) |
| Bottom 25 cm polygon interior soil | 0.791* | 1.435 (±0.052) | 16.2 (±3.5) |
*SD could not be calculated, as only one replicate was above the detection limit of 0.7 mg kg–1 NO3− + NO2−.
qPCR
qPCR was used to measure the relative differences in the denitrification gene abundance between the two soils types, the polygon interior active layer soil and the trough active layer soils at depths of 5 cm and 25–30 cm. qPCR of the nirS genes showed that the trough soils overall had a higher relative abundance of the gene compared with the polygon interior soils, though significance was only detected in the top 5 cm soil samples (Fig. 2). The qPCR and ANOVA analysis (supplementary Table S2 available online) determined that the soil location (P = 0.005; trough vs polygon interior) had a significant effect on relative nirS abundance, but not soil depth (P = 0.107). These results coincide with the higher (P = 0.053) flux of N2O that we observed from the trough soils compared with the polygon interior soils. Furthermore, the trough soils appear to contain higher amounts of nitrogen as NO3− + NO2−, though only in the deeper (25–30 cm) soils (Table 1). This is consistent with current knowledge that higher levels of nitrate are known to stimulate denitrification and subsequent N2O releases (Yu et al. 2000; Kemp and Dodds 2002) and that higher abundance of denitrification genes correlates with higher rates of denitrification (Dong et al. 2009). Together with the gas flux data, these results suggest that N2O generation is occurring primarily in the top 5 cm of the trough soils at the ice-wedge polygon terrain.
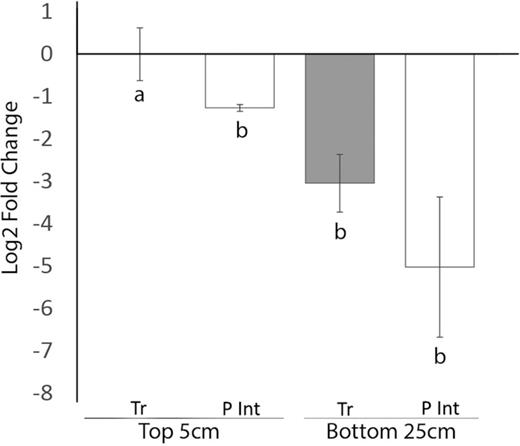
qPCR of denitrification genes nirS in trough soils (Tr) and polygon interior soils (P Int), at top 5cm and bottom 25–30 cm. Gene quantification is represented as fold-change relative to trough soil at 5 cm. All gene abundances are relative to 16S rRNA genes to control for quality and quantity of DNA extractions. Error bars represent SEM. Letters represent statistically different gene abundances between the soils.
Community structure of potential denitrifiers and nitrogen-fixing bacteria
We analyzed the community composition of potential denitrifiers and nitrogen-fixers in the microbial community of the polygon interior and trough soils at the ice-wedge polygon site via amplicon sequencing of two marker genes, nirS and nifH. In addition, we looked at the functionally active microbial community by analyzing the nitrogen cycling gene transcripts and 16S rRNA transcript sequences in the polygon interior and trough soil metatranscriptomes.
Denitrifying community
Based on targeted gene sequencing of the nirS denitrification gene marker, the microbial community was distinct at the different depths and between soil types (Figs 3 and 4, and supplementary Fig. S2 available online). A total of only 10 nirS OTUs were recovered between all the samples. Unique OTUs were recovered from the deeper soils compared with their top soil counterparts (Fig. 3). The majority of the recovered OTUs did not cluster with nirS genes from known cultured organisms (Table 2). PERMANOVA analysis of the OTU abundance tables determined that both depth (P = 0.010) and soil location (P = 0.002) had a significant impact on the diversity of the nirS containing denitrifying microbial community. PCA was performed on the nirS OTU abundance table, with the first three principal components accounting for 89% of the variation between the samples and replicates. The PCA grouped the polygon interior nirS-containing denitrifying community together (supplementary Fig. S2 available online), with the interior polygon soils and replicates clustering together by depth. The top trough soil replicates also clustered together and separately from the polygon interior soils. However, the deeper trough soils did not appear to cluster together (supplementary Fig. S2 available online). Both the 25–30 cm and the top 5 cm soils of the trough had high abundances of OTU 6, OTU 3 and OTU 2, which were closely related to uncultured denitrifiers detected in the Tibetan Plateau (Xie et al. 2014), Finish fen soil (Palmer and Horn 2015) and rice patty fields in Tokyo, Japan (Yoshida et al. 2009), respectively (Table 2). Furthermore, many of the denitrifying microbial members were also recovered in both trough and polygon interior soil metatranscriptomes (supplementary Tables S3 and S4 available online). The protein coding and 16S rRNA transcript sequences in the metatranscriptomes were related to known denitrifying bacteria, including members of the genera Thiobacillus, Denitrovibrio, Pseudomonas, Azospirillum and Azorhizobium, were detected in both trough and polygon interior soils. Different denitrifier communities have previously been linked to differential N2O emissions from soils in discontinuous permafrost Arctic peat soils of Russia (Palmer, Biasi and Horn 2012). Palmer, Biasi and Horn (2012) is one of the few other surveys of denitrifiers in Arctic soils; the study looked at the phylogenetic diversity of the nirS gene in Arctic peat soils that were affected and not affected by cryoturbation. The authors found that the cryoturbated soils emitting N2O in laboratory microcosms had distinct communities of denitrifiers compared with the unturbated soils that were not producing N2O (Palmer, Biasi and Horn 2012). Many of the OTUs recovered from the soils were closely related to uncultured bacteria (Palmer, Biasi and Horn 2012). Our findings suggest that this is a similar case in situ at the ice-wedge polygon site: the community of denitrifying bacteria were distinct between the trough soil that appears to have a higher N2O flux in situ and the drier polygon interior soils, which had lower N2O flux. Furthermore, phylogenetic analysis of nirS OTUs demonstrates that much of the denitrifying community at the ice-wedge polygon site are currently uncultured bacteria that are phylogenetically distinct from cultured denitrifiers (Fig. 4). In contrast to our study, a long-term fertilization, warming and water addition experiment in Alexandra Fiord, Nunavut, did not show increases in N2O production in wetter plots, nor did the authors observe diversity of nosZ (another functional marker of denitrification) between plots (Lamb et al. 2011).
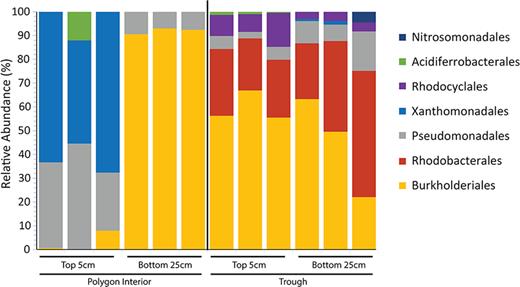
Microbial composition of the nirS containing community at the Order level recovered from the functional gene sequencing of denitrification nirS gene in the trough soils and polygon interior soils at 5 cm and 25–30 cm. Family assignment was based on closest cultured organism.
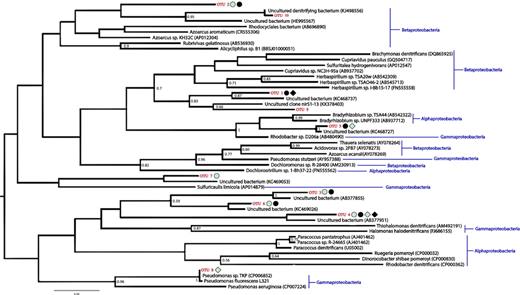
Phylogenetic reconstruction of the nirS gene including the OTUs recovered from the study and their closest cultured and uncultured NCBI matches. The shapes beside the OTU names indicate OTUs that were present in at least two of the three replicates from each soil type. Light shapes denote that the OTU was present in the top 5 cm of the soils, while dark shapes denote deeper soils. Circles denote OTUs that were present in trough soils, while squares denote polygon interior soils. The numbers at branch nodes denote portion of replicate trees in which the taxa clustered together in the bootstrap test (1000 replicates); only bootstrap values over 0.5 are shown. The tree is unrooted.
The OTUs recovered in the amplicon sequencing of the nirS gene in the trough and polygon interior soils.
| OTU number | Closest NCBI BLAST match | Closest NCBI match ID | % match | Location of the uncultured strain | Reference of the match | Closest cultured NCBI match | % match | Name | Reference of the cultured match |
|---|---|---|---|---|---|---|---|---|---|
| 1 | Uncultured bacterium clone F-5-1-33 | KC468737 | 90 | Qinghai, Tibet Plateau | Xie et al. (2014) | AB542309 | 80 | Herbaspirillum sp. TSA20w | Ishii et al. (2011) |
| 2 | Uncultured bacterium | HE995567 | 83 | Fen denitrifier community in Finnish Lapland | Palmer and Horn (2015) | AB545713 | 83 | Herbaspirillum sp. TSO46–2 | Unpublished, direct NCBI submission |
| 3 | Uncultured bacterium 518S64 | AB377855 | 93 | Rice paddy field soil, Tokyo | Yoshida et al. (2009) | AM230903 | 74 | Paracoccus sp. R-24 665 | Heylen et al. (2006) |
| 4 | Uncultured bacterium clone 727S039 | AB377951 | 92 | Rice paddy field soil, Tokyo | Yoshida et al. (2009) | AJ626840 | 77 | Pseudomonas sp. R125 | Unpublished, direct NCBI submission |
| 5 | Uncultured bacterium clone F-5-1-23 | KC468727 | 98 | Qinghai, Tibet Plateau | Xie et al. (2014) | AB480490 | 88 | Rhodanobacter sp. D206a | Unpublished, direct NCBI submission |
| 6 | Uncultured bacterium clone F-7-3-177 | KC469026 | 95 | Qinghai, Tibet Plateau | Xie et al. (2014) | AB696890 | 78 | Rhodocyclales bacterium UNPF16 | Unpublished, direct NCBI submission |
| 7 | Uncultured bacterium clone F-7-3-217 | KC469053 | 92 | Qinghai, Tibet Plateau | Xie et al. (2014) | AP014879 | 77 | Sulfuricaulis limicola | Umezawa et al. (2016) |
| 8 | Pseudomonas sp. TKP | CP006852 | 100 | Isolated from sediments at Kyushu, Japan | Ohtsubo et al. (2014) | CP006852 | 100 | Pseudomonas sp. TKP | Ohtsubo et al. (2014) |
| 9 | Uncultured prokaryote clone nirS1–13 | KX378403 | 88 | N/A | Unpublished, direct NCBI submission | AB937702 | 88 | Cupriavidus sp. NC3H-95a | Wei et al. (2015) |
| 10 | Uncultured denitrifying bacterium clone J30927555_4_5_T7 | KJ498556 | 99 | Wastewater treatment systems | Unpublished, direct NCBI submission | AP012547 | 78 | Sulfuritalea hydrogenivorans sk43H | Watanabe, Kojima and Fukui (2014) |
Nitrogen-fixing community
High-throughput amplicon sequencing of the nitrogenase (nifH) genes in the top 5 cm and bottom 25–30 cm of the polygon interior and trough soils revealed distinct nifH-containing microbial communities between the soil types (Fig. 5). A total of 127 distinct OTUs were recovered between all the samples. PERMANOVA analysis demonstrated that soil location significantly influenced the taxonomic distribution of the potential nitrogen-fixing microbial community (P = 0.002), but soil depth did not (P = 0.183). The PCA analysis was performed on the nifH OTU abundance table, with the first three principal components accounting for 93% of the variation between the samples and replicates. The PCA grouped the polygon interior soil nitrogen-fixing community together regardless of depth (supplementary Fig. S3 available online), with all the interior polygon soils and replicates clustering together. However, the trough soil replicates clustered together based on depth and were separate from the interior soils (supplementary Fig. S3 available online). Polygon interior soils at both depths were dominated by Rhizobiales, though there was also a presence of Chromatiales (Fig. 5). Rhizobiales sequences were also present at both soil depths in troughs, but were relatively less abundant overall (Fig. 5). The trough soils at both depths also contained nifH sequences belonging to Gallionelales, Desulfuromondales and Desulfobacteriales classes. Furthermore, majority of the microbial orders recovered from the targeted amplicon functional gene sequencing of nifH were also present in both soil metatatranscriptomes (supplementary Tables S3 and S4 available online). Both protein coding and 16S rRNA transcripts related to known free-living nitrogen-fixing genera such as Azotobacter, Beijerinckia and Nostoc were also detected in both trough and polygon interior soil metatranscriptomes, as well as the symbiotic nitrogen-fixing genera Frankia, Azorhizobium, Bradyrhizobium and Rhizobium. This supports the notion that high Arctic polar desert cryosols may support an active community of nitrogen-fixing bacteria. There have been few surveys of the nifH containing microbial communities in the Arctic overall and fewer still in Arctic soils. Cyanobacteria, such as Nostoc commune, have previously been found to be the dominant nitrogen-fixers on Devon Island (high Arctic), although this work was done in salt marches, meadows and hummocks (Chapin, Bliss and Bledsoe 1991). The authors found that soil moisture and temperature were the prominent controlling factors for nitrogen-fixation (estimated from acetylene reduction rates), more so than nitrogen and phosphorus content (Chapin, Bliss and Bledsoe 1991). A limited survey of nifH genes in Arctic soil of Cambridge Bay, Canada, revealed nifH genes related to Alphaproteobacteria, Gammaproteobacteria and Deltaproteobacteria/Spirochaetae groups, and OTUs belonging to an uncultured clone cluster (Izquierdo and Nüsslein 2006). The authors also surveyed tropical and temperate soils, but only found nifH genes belonging to few microbial clades, suggesting that the clone sequencing likely did not capture the full diversity of the nitrogen-fixers (Izquierdo and Nüsslein 2006). Next generation sequencing data from our study suggests a much greater diversity of nifH-containing microbial community in Arctic soils compared with previous surveys. A survey in the lowlands near Alexandra Fiord, Ellesmere Island, using terminal restriction fragment length polymorphism analysis, identified Alphaproteobacteria as the most common microbial members containing the nifH gene (Deslippe, Egger and Henry 2005). In addition, nifH-containing members of the Betaproteobacteria and Cyanobacteria (Nostocales), along with several unidentified taxa, were also present in the soils (Deslippe, Egger and Henry 2005). Though our study demonstrates unique nifH containing microbial communities between the different soil location of the ice-wedge polygon site, this may not have any effect on nitrogenase activity and nitrogen-fixing potential of the soil, as previous studies in Arctic soils demonstrated a lack of correlation between changes in the taxonomic composition of the nitrogen-fixing community and nitrogenase activity in the soils (Deslippe, Egger and Henry 2005). Nitrogenase activity assays would be the next logical step in understanding the effects of the microbial community and abiotic factors such as temperature and moisture content on the nitrogen-fixing potential of the soils at the ice-wedge polygon terrain. This was previously demonstrated by Stewart et al. (2011) in a low arctic ecosystem, who reported higher nitrogen-fixation rates in biological soil crusts that had higher moisture content (Stewart, Coxson and Siciliano 2011b). Overall, moisture content has been shown to be one of the most important factors in controlling nitrogen-fixation rates in Arctic ecosystems (Zielke et al. 2002).
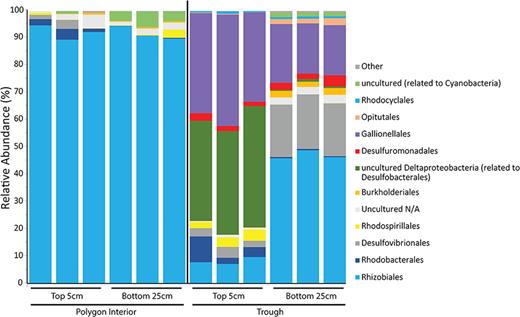
Microbial composition of nitrogen-fixing nifH gene at the Order level in the trough soils and polygon interior soils at 5 cm and 25–30 cm.
Metatranscriptomics
Metatranscriptome sequencing and analysis was preformed on the top 5 cm of the polygon interior and trough soils. Though transcriptional gene abundances do not always correlate to protein abundances and real activity, both soils showed a presence of gene transcripts involved in the nitrogen cycle, including genes for denitrification, nitrogen-fixation and ammonia utilization and transport (Fig. 6). This indicates that the microbes in these soils are actively producing transcripts of genes that are part of the denitrification and nitrogen-fixing pathways. Specific microbial members that produced RNA transcripts of genes involved in denitrification included Paracoccus denitrificans, Pseudomonas aeruginosa, Rhodopseudomonas palustris, Bacillus cereus, Chloroflexus sp. and Sinorhizobium medicae. Since single-stranded RNA molecules are more susceptible to degradation, higher turnover rate and do not persist in the environment as free molecules like DNA, these results suggest that the ice-wedge polygon soils support an active community of these denitrifying bacteria. This is consistent with previous RNA-based sequencing studies that demonstrated organisms capable of denitrification and nitrogen-fixation are active members of the microbial community in other permafrost affected soils (Tveit, Urich and Svenning 2014; Hultman et al. 2015). Transcripts of genes involved in nitrogen-fixation included members of Nostoc punctiforme, Cyanothece sp., Rhodobacter sphaeroides, Burkholderia xenovorans, Azotobacter vinelandii, Chlorobium luteolum, Anabaena variabilis and Halorhodospira halophila, whereas gene transcripts involved in ammonia utilization and transport belonged to members of Pedobacter heparinus, Candidatus Koribacter versatilis, Saccharopolyspora erythraea, Candidatus Solibacter usitatus, Acidithiobacillus ferrooxidans, Chlorobium tepidum and Desulfovibrio vulgaris. Though microbial communities can change annually in Arctic soils (Zinger et al. 2009) and our 2013 transcriptome results may not be directly comparable with our 2015 the soil chemistry, gas fluxes and targeted amplicon sequencing, together our results do suggest that the input of nitrogen into the ecosystem (Salmon et al. 2018) at the site is potentially from a combination of permafrost thaw, which may supply the mineral ammonia and be assimilated by ammonia oxidizers, and through atmospheric nitrogen-fixation by diazotrophs. As temperatures warm in the Arctic due to climatic change, both sources of nitrogen would potentially increase. With increasing temperatures, the rate of permafrost thaw would increase, potentially further adding sources of nitrogen through decomposition of organic matter (mineralization). Meltwater from permafrost soils contains higher levels of ammonium, which may be utilized by ammonium oxidizing bacteria and further contribute to N2O via nitrifier denitrification (Elberling, Christiansen and Hansen 2010). Indeed, ammonium levels and fertilization with ammonium have shown positive correlations to N2O release, while levels of NO3− and augmentations with NO3− have not in wetter and lowland Arctic permafrost soils (Ma et al. 2007; Elberling, Christiansen and Hansen 2010), though this is not always the case (Lamb et al. 2011). Previous studies have demonstrated active expression of hydrolases involved in the initial breakdown of complex soil biopolymers in moist Alaskan acidic tundra permafrost (Coolen and Orsi 2015) as well as the presence of active gene transcripts involved in nitrate reduction, denitrification, ammonia uptake and nitrogen-fixation in active layer and permafrost soils of Alaskan bog systems (Hultman et al. 2015), all suggesting that the microbial community in thawing permafrost is primed to utilize the carbon and nitrogen sources that become available with permafrost thaw. The increased carbon availability may further stimulate denitrification rates, as higher carbon has been shown to increase rates of denitrification (Dodds and Jones 1987; Hill and Cardaci 2004; Chen et al. 2018), and the current low carbon content of these cryosols may limit the relative abundance of denitrifiers (Chen et al. 2018); however, this scenario may change with increased permafrost thaw and available carbon. Alternatively, in some upland soils the native dominant denitrifiers are oligotrophic denitrifiers (Hashimoto, Whang and Nagaoka 2006), and it is logical for this to also potentially be true in our mineral upland cryosols; these likely oligotrophic denitrifiers that may be adapted to low carbon environments may not respond positively to increased carbon availability. Furthermore, with the warming temperatures, the activity of nitrogenase would also be increased (Liengen and Olsen 1997; Stewart et al. 2014), providing an additional input of nitrogen into this ecosystem.
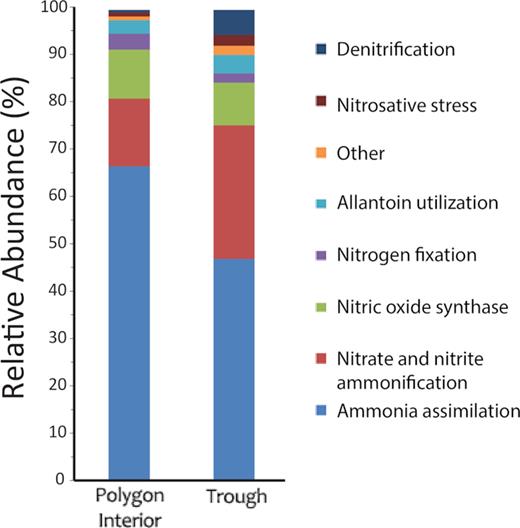
Relative abundance (%) of transcripts involved in the nitrogen cycle in trough and polygon interior top 5 cm soil metatranscriptomes.
CONCLUSION
The effects of warming temperatures on Arctic soils and nitrogen availability on SOM decomposition rates are complex and involve the interplay responses and feedback loops of microbial populations, plants and microbial grazers, as well as inherent magnitude of SOM stocks and their composition. Our results demonstrate that mineral cryosols of Arctic polar deserts contain an active community potentially capable of denitrification and nitrogen-fixation. Furthermore, we demonstrate that the topology of the land has an effect on the composition of the microbial community and N2O flux, with the wetter trough soils having a more prominent flux of N2O and a distinct community of denitrifiers and potential nitrogen-fixing bacteria. However, a more extensive survey of different Arctic terrains and soil types are needed to help fully understand the link between the microbial community, N2O flux, soil chemistry and moisture content. With the warming temperatures and increased moisture content, nitrogen availability in Arctic soils may potentially increase through increased rates of nitrogenase activity and permafrost thaw. Our results suggest that the active microbial community in these soils is poised to take advantage of these nitrogen inputs into the ecosystem. This may in turn reduce the nitrogen limitation of the entire soil microbial community, resulting in increased microbial growth, further exasperating the positive feedback loop of GHG emissions and climatic warming.
ACKNOWLEDGEMENTS
This work was supported by the NSERC Discovery (208253), NSERC NRS (208229), Northern Scientific Training Program (204713) and Polar Continental Shelf Program (627–17) grants to LGW. In addition, the work was also supported by the US Department of Energy (DE-SC0004902) to TCO.
Author contributions: IA wrote the manuscript and preformed gas flux collection, phylogenetic and bioinformatic analysis, and the soil moisture and content analysis. IA and JR preformed the soil sample collection and DNA/RNA extractions. IA and AL preformed the sequencing library preparation and sequencing. IA, LGW, CG and TCO contributed to conception and editing of the manuscript.
Conflicts of interest. None declared.
