


ABSTRACT
Urea is a widely used nitrogen (N) fertilizer in agriculture, but considerable amounts of urea are lost through ammonia volatilization. Soil microbes are major urease producers; however, the impact of urea application on the soil ureolytic microbial community is poorly understood. In this study, the urease activity and the abundance and composition of the ureolytic bacterial community in soil (30-cm deep) under long-term urea application (four treatments: 0, 200, 400 and 600 kg N ha−1yr−1) were investigated by quantitative polymerase chain reaction and high-throughput sequencing of the ureC gene. Urease activity and ureC abundance decreased with the soil depth and increased with urea fertilization. The ureC/16S rRNA gene ratio slightly varied in the different treatments, and the ureC gene abundance was significantly and positively correlated with urease activity only in surface soil (0–10 cm), despite the greater impact of urea application on the ureolytic bacterial community structure observed in deeper soil layers (10–20 and 20–30 cm). The diversity of the ureolytic bacterial community was higher in upper soil layers than deeper ones and decreased with the urea application rate. These results suggest that long-term intensive urea fertilization may increase the risk of N loss through ammonia volatilization and increase the risk of soil degradation due to the collapse of soil microbial diversity.
INTRODUCTION
Urea is one of the most commonly used nitrogen (N) fertilizers in the world, and its use has increased markedly in recent decades (Daigh et al. 2014). After urea is added to soil, it is rapidly hydrolyzed to ammonia and carbon dioxide by urease, resulting in a loss of N through ammonia volatilization (Pan et al. 2016). Globally, more than 40% of applied N is reportedly lost as ammonia under specific environmental and edaphic conditions (Singh et al. 2013). The North China Plain is an important crop production area in China, and urea is the most commonly used N fertilizer in this region. However, the severe overuse of N fertilizer in this area has been reported, and ammonia volatilization has been recognized as one of the primary pathways for N loss, accounting for 19.4 to 24.7% of the applied N in the wheat- and maize-growing seasons, respectively (Ju et al. 2009). A previous study investigating ammonia volatilization from synthetic N fertilizer estimated that ammonia emission from urea accounts for 64.3% of the total ammonia volatilization in China (Zhang et al. 2011).
Although a number of studies have attempted to quantitatively estimate the amount of ammonia lost to the atmosphere in agricultural soils, few studies have investigated the molecular mechanisms underlying the production of ammonia through urea hydrolysis. Microorganisms are the primary agents for urea hydrolysis in soils (Gibson 1930; Skujiņš and Burns 1976; Dharmakeerthi and Thenabadu 1996), although urease activity in soils may also originate from plant or animal waste (Frankenberger and Tabatabai 1982; Dharmakeerthi and Thenabadu 1996). A significant correlation between extracellular urease and microbial biomass (microbial carbon and nitrogen) has been detected in some soils, indicating that extracellular urease may primarily be of microbial origin (Skujiņš and Burns 1976).
Bacteria from diverse taxa possess urease enzymes synthesis system (Seneca, Peer and Nally 1962). In samples from six soils in New South Wales, approximately 17–30% of the bacterial populations were observed to be ureolytic (Lloyd and Sheaffe 1973). In this study, the response of urease-harboring bacterial communities to urea application was investigated, and the results generally showed the presence of a constant ratio of ureolytic and non-ureolytic bacteria, even though the total number of bacteria fluctuated dramatically. Lloyd and Sheaffe (1973) also reported that in soils supplemented with urea for more than 10 years, the proportion of ureolytic bacteria (24%) was similar to that of control soils. A laboratory incubation experiment revealed that the addition of urea in black spruce humus increased the number of ureolytic bacteria and fungi within 3 days, but when urea was hydrolyzed completely, the population of ureolytic bacteria and fungi in the urea-applied treatment showed no significant difference compared with the control treatment (Roberge 1967). These studies were based on traditional cultivation methods, such as plate counting, which are known to bias the quantification of microorganisms (Dobbs, Gray and Parkinson 1969). Molecular ecology techniques have overcome some of the limitations associated with traditional cultivation methods and have allowed more accurate studies of microbial communities to be conducted. Recently developed molecular methods targeting the ureC gene provide powerful tools for ureolytic microbial community research (Fisher, Yarwood and James 2017; Wang et al. 2018). Using this approach, both quantitative polymerase chain reaction (qPCR) and high-throughput sequencing targeting the ureC gene have been used to explore ureolytic microbial abundance and community structure. The abundance of the ureC gene was previously shown to be positively correlated with soil pH and urea hydrolysis rate (Fisher, Yarwood and James 2017). Wang et al. (2018) demonstrated that ureolytic microbial community was greatly affected by fertilization and varied in different particle-size fractions, with microaggregates observed to contain a higher abundance of the ureC gene than macroaggregates or slit + clay, which was consistent with the soil nutrient level. The ureolytic community also varies with the type of soil. Oshiki et al. (2018) examined the ureolytic community in seven different soil types and observed a high diversity and a unique composition of ureolytic prokaryotic community in each soil type.
In this study, we investigated how long-term (20 years) urea application altered urease activity along the soil profile to a depth of 30 cm in an upland agricultural soil. The abundance and composition of ureolytic bacterial communities in different soil layers and at different fertilization levels were assessed by quantification and high-throughput sequencing of the ureC gene. The results provide insight into the mechanisms underlying the response of ureolytic bacterial communities to long-term urea application in soil and allowed us to identify the key responsive ureolytic microorganisms. Given the high rate of ammonia volatilization in the study area (Ju et al. 2009; Zhang et al. 2011), these findings also provide valuable information for developing new techniques to mitigate ammonia volatilization in the North China Plain.
MATERIALS AND METHODS
Site description and soil collection
The long-term field experiment was started in 1998 at the Luancheng Agroecosystem Experimental Station of the Chinese Academy of Sciences (37°53′N, 114°41′E, elevation 50 m). The annual N fertilizer application rate by the farmers in this area is approximately 500 kg N·ha−1 (Zhang et al. 2018). The cropping system is winter wheat-summer maize rotation. Our experiment included four treatments in which N fertilizer (urea) was used at a level of 0, 200, 400 and 600 kg N·ha−1·year−1 (N0, N200, N400 and N600, respectively). Each treatment was repeated in three plots of 30 m2 each (5 × 6 m). The soil in this area is a typical fluvo-aquic soil.
Soil samples were collected from three layers (0–10, 10–20 and 20–30 cm) during the mature stage of maize in September 2016, with three replicates taken from each fertilization intensity treatment. Each replicate was sampled from five randomly selected points in each plot and mixed thoroughly to form a composite sample. The soil samples were sieved with a 2-mm mesh to remove impurities such as fronds, roots and stones. The sieved soils were then divided into two parts, with one part stored at -80°C for DNA extraction and the other part air-dried at room temperature to determine urease activity.
Soil urease activity measurement
Soil urease activity was measured using the indophenol blue method (Chen et al. 2014; He et al. 2016; Wang et al. 2018). Briefly, 2 g of air-dried soil was mixed with 1 mL toluene for 15 min at room temperature, after which 10 mL of a 10% urea solution and 20 mL of citrate buffer (pH = 6.7) were added and the samples were incubated at 37°C for 24 h. The mixtures were diluted to 50 mL sterile water and then filtered through filter paper. Released ammonium was measured by the indophenol blue reaction and was measured spectrophotometrically at 578 nm. In this study, urease activity was reported as milligrams of NH3-N catalyzed from urea by 1 g of air-dried soil every 24 h.
DNA extraction and qPCR amplification
Total DNA was extracted from 0.5 g of soil using an E.Z.N.A. Soil DNA kit (Omega Bio-tek, Inc., Norcross, GA) according to the manufacturer's instructions. The quality and quantity of the extracted DNA was determined using a NanoDrop spectrophotometer (NanoDrop ND-2000c Technologies, Inc., Wilmington, DE), and the DNA was visually evaluated in an agarose gel (1%). Extracted DNA was stored at -20°C.
The gene encoding the urease alpha subunit (ureC) was amplified using the degenerate primers UreC-F (5′-TGGGCCTTAAAATHCAYGARGAYTGGG-3′) and UreC-R (5′-SGGTGGTGGCACACCATNANCATRTC-3′) (Reed 2001), while the 16S rRNA gene was amplified with the primers 1369F (5′-CGGTGAATACGTTCYCGG-3′) and 1492R (5′-GGWTACCTTGTTACGACTT-3′) (Suzuki, Taylor and DeLong 2000). Quantitative PCR (qPCR) was performed in triplicate in a CFX Connect Real-Time PCR Detection System using a 25 µL mixture containing 12.5 µL of 2 × SYBR Premix Ex Taq (Takara Biotech, Dalian, China), 0.25 µL (10 µM) of each forward and reverse primer, 1 µL of template DNA (20 ng·µL−1) and 11 µL of sterile double-distilled water (ddH2O). A plasmid containing a fragment of the ureC/16S rRNA gene was used as standard template and standard curves were constructed using 10-fold dilution series of the plasmids. The qPCR was performed under the following thermo conditions: initial denaturation at 95°C for 5 min, followed by 40 cycles of denaturation for 30 s at 95°C, annealing for 30 s at 50°C for the ureC gene and 55°C for the 16S rRNA gene, extension for 30 s at 72°C and 10 s at 83°C for fluorescence detection. Melting curve analysis (generated with continuous fluorescence acquisition from 57 to 95°C at a rate of 0.5°C per 10 s) and agarose gel electrophoresis were performed to confirm the specificity of the amplification.
Amplification and high-throughput sequencing of the ureC gene
The UreC-F and UreC-R primers were used to amplify a 340-bp fragment of the ureC gene in a 25-µL reaction system containing 12.5 µL of 2 × Premix (Takara Biotech, Dalian, China), 0.25 µL (10 µM) of each forward and reverse primer, 1 µL (20 ng·µL−1) of template DNA and 11 µL sterile ddH2O. The thermocycling conditions used were as follows: initial denaturation at 94°C for 9 min, followed by 35 cycles of 94°C for 30 s, 50°C for 30 s, 72°C for 30 s, with a final extension for 10 min at 72°C. The PCR products were sequenced on an Illumina MiSeq PE250 platform. The sequencing data were deposited in the European Nucleotide Archive under the accession number PRJEB24322.
Construction of a ureC reference database and bioinformatic analysis
Publicly available bacterial ureC sequences were downloaded from FunGene (http://fungene.cme.msu.edu/) and the nucleotide database of the National Center for Biotechnology Information (NCBI). Duplicate sequences were removed and sequences from environmental sources with no taxonomic information were discarded. This non-redundant database containing 19 722 reference sequences was used as a reference database for high-throughput sequencing data analysis.
Bioinformatic analysis of the sequencing data was performed using the QIIME (Quantitative Insights Into Microbial Ecology) package (version 1.9.1) (Caporaso et al. 2010). After removing the adaptor and barcode bases, the paired-end sequences were joined using the Fastq-join method (Aronesty 2011) with a minimum overlap of 20 bp and a maximum difference of 10% within the overlapping regions. Low-quality sequences (Phred quality score < 20, length shorter than 200 bp or ambiguous base > 0) were discarded. The taxonomy of the clean reads was assigned using BLASTn (Altschul et al. 1990) against the ureC reference database mentioned above. Sequences with no BLAST hit or with an identity of < 255 bp were filtered out. The sequences assigned to the same nearest taxon were combined and were referred to as the members of the assigned taxa in this study. All samples were rarefied to 18 000 sequences for downstream analysis.
Statistical analyses
Kruskal-Wallis test (two-tailed) (Corder and Foreman 2009) was used to assess differences between treatments with respect to urease activity, ureC abundance, microbial diversity and the relative abundance of species. Principal coordinate analysis (PCoA) was performed to compare the beta diversity between samples based on the Bray-Curtis distance matrix. The Kruskal-Wallis test and PCoA were performed in R (version 3.4.3) using the dplyr and ape libraries, respectively. A heatmap was generated using the pheatmap package in R. The log of the response ratio (LRR) was computed as follows: LRR = ln(X1/X2) (Hedges, Gurevitch and Curtis 1999), where X1 was the average of the relative abundance of taxa in the three replecates plots of urea-applied soil (N200, N400 and N600, respectively) and X2 was that detected in the unfertilized soil (N0). LRR was estimated with bias correction using the ARP observation library in R. Correlations between ureC gene abundance and soil urease activity were explored by the Pearson correlation coefficient and linear regression, which were carried out using the IBM Statistical Product and Service Solutions Statistics for Windows (SPSS) (Version 21).
RESULTS
Effects of N application on soil urease activity and ureC abundance
Soil urease activity varied across the treatments and the soil depths. Compared with the control (N0), soil urease activity was higher in the treatments with N application in all the three investigated soil layers and the urease activity increased with the N fertilization level in the top two soil layers (Fig. 1a). Soil urease activity was higher in the surface soil than in the deeper soil in all the treatments. In addition, the abundance of the ureC gene was higher in the treatments with urea application, although the increase was not significant in the 10–20 cm layer (Fig. 1b). However, there was little variation in the abundance of ureC between the three N fertilization treatments (Fig. 1b). In contrast to ureC abundance, there were no significant differences in the ureC/16S rRNA gene ratio among the treatments (Fig. 1b), indicating that the abundance of ureolytic bacteria is proportionally stable within the total bacterial community.
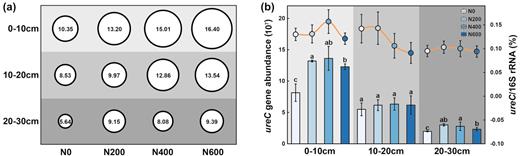
(a) Soil urease activity at three soil depths and urea application rates of 0, 200, 400 and 600 kg N·ha−1·year−1 (N0, N200, N400 and N600, respectively). The circle size corresponds to the urease activity. (b) ureC gene abundance (copy number per g dry soil) (bar chart) and ratio of ureC/16S rRNA gene (line chart) in soil samples. Different letters in the bar chart indicate significant difference determined by the Kruskal–Wallis test (P < 0.05). Urease activity is represented as milligrams of NH3-N catalyzed via urea by 1 g of air-dried soil every 24 h.
Changes in the ureolytic bacterial community
After taxonomic assignments, the ureC sequences were associated with 12 bacterial phyla (Fig. 2a). Most of the ureC sequences were affiliated with Proteobacteria, which accounted for more than 90% of the total ureolytic bacterial community. The ureolytic bacterial community varied little across soil depth and treatments at the phylum level, with the exception that a higher relative abundance of Nitrospirae was observed under the N0 treatment in the 20–30 cm layer compared to the treatments with urea application (Fig. 2a). The diversity of the ureolytic bacterial community based on the Shannon index generally decreased with soil depth and urea fertilization level (Fig. 2a).
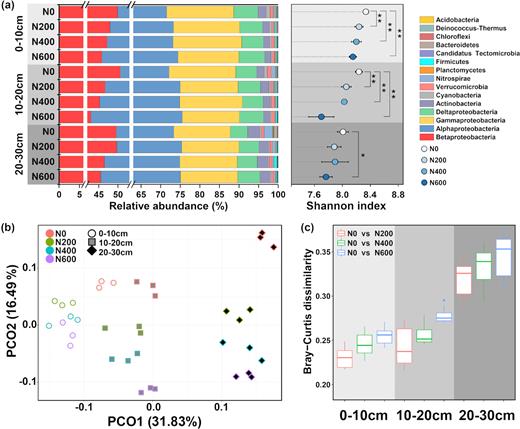
(a) Ureolytic microbial community composition (stacked bar plot) and diversity (dot plot) of soil samples from three soil depths and with urea application rates of 0, 200, 400 and 600 kg N·ha−1·year−1 (N0, N200, N400 and N600, respectively). (b) PCoA ordinations of the ureolytic microbial community based on the Bray-Curtis distance. (c) Bray-Curtis dissimilarity of the ureolytic microbial communities between urea-amended treatments (N200, N400 and N600) and the control (N0).
The PCoA revealed that more than half of the variation of the ureC community composition could be explained by the first two principal coordinates, with the first principal coordinate axis accounting for approximately 37% of the total variation, and the second accounting for approximately 16% (Fig. 2b). Samples from different soil layers were clearly separated along the first principal coordinate axis. Furthermore, soil samples under different urea fertilization rates were distributed along the second axis. Soils subjected to urea fertilization separated from the unfertilized N0 samples, and soils with different urea application rates also separated from each other. The distance between the N0 and urea application treatments increased with increasing soil depth, indicating a greater effect of urea application on the ureolytic bacterial community in deep soil compared with shallow soil. These results were confirmed by the observed increase in Bray-Curtis dissimilarity between N0 and the treatments with higher application rates of urea and with the deeper soil layers (Fig. 2c).
The response of dominant ureC-harboring genera (relative abundance > 1%) to urea application was illustrated using a heatmap and by calculating the LRR (Fig. 3). The results showed different responses of dominant genera to urea application. For example, the relative abundance of Bradyrhizobium was higher with a higher rate of urea application, while that of Cupriavidus was lower in the urea treatments compared with N0, and the relative abundance of Pseudomonas was not significantly different among the treatments. Most of the dominant genera exhibited similar responses to urea application across the three soil layers; however, some exceptions were observed. For example, Ideonella and Paraburkholderia responded negatively to urea application in the top two soil layers (0–10 and 10–20 cm) but responded positively in the deep soil layer (20–30 cm).
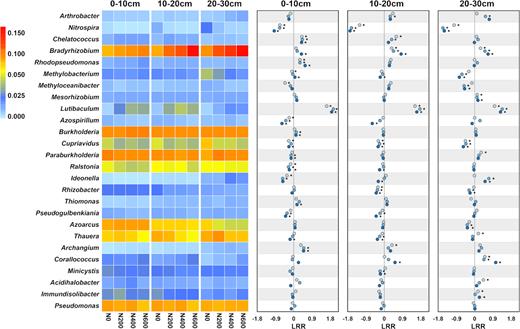
Comparison of the relative abundance of dominant genera (heatmap) and log response ratio (dot plots) in soil from three depths and with urea application rates of 0, 200, 400 and 600 kg N·ha−1·year−1 (N0, N200, N400 and N600, respectively).  , N200;
  , N400;
  , N600. *significant difference in relative abundance between urea-amended treatments (N200, N400 and N600) and the control (N0). LRR: log response ratio.
Correlations between soil urease activity and ureC abundance
Correlations between soil urease activity and ureC abundance within the three soil layers were assessed separately using linear regression and Pearson correlation coefficients. The coefficient of determination (R2) of the regression varied among the soil layers (Fig. 4). The largest R2 value was observed in the surface soil layer (0–10 cm), indicating a higher correlation between soil urease activity and ureC abundance in the 0–10 cm soil layer than in the two deeper soil layers (10–20 and 20–30 cm). This observation was supported by statistical analysis of the Pearson correlation coefficients, where a significant correlation between soil urease activity and ureC abundance was observed in the surface soil (0–10 cm) but not in the lower soil layers (10–20 and 20–30 cm) (Table 1).
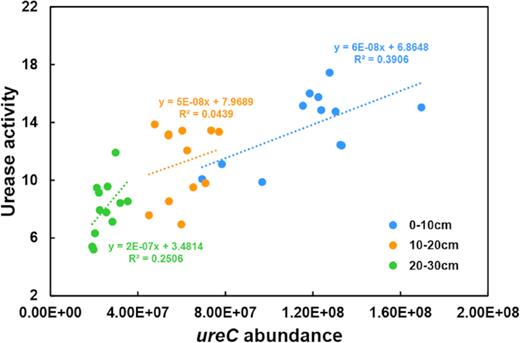
Relationship between ureC gene abundance (copy number per gram dry soil) and soil urease activity (milligrams of NH3-N catalyzed from urea by 1 g dry soil every 24 h) in soils from three soil depths (0–10, 10–20 and 20–30 cm).
DISCUSSION
Ammonia volatilization is an important pathway of N loss in agricultural systems that results from urea hydrolysis mediated by ureolytic organisms (Dharmakeerthi and Thenabadu 1996; Ju et al. 2009; Zhang et al. 2011; Dawidowicz et al. 2015). In this study, we demonstrated that long-term urea fertilization changed the soil urease activity in different soil layers and had a strong effect on the ureolytic bacterial community. To the best of our knowledge, this is the first study to investigate the responses of ureolytic microbial communities to long-term urea fertilization through high-throughput sequencing of the ureC gene in the North China Plain, which is one of the most intensive agricultural regions in China.
Urea deep placement has been recognized as an efficient way to increase N use efficiency in flooded rice fields (Yao et al. 2018). However, the underlying mechanisms of this increased efficiency have rarely been investigated. Our results clearly showed that urease activity in the upland soil decreased with soil depth, suggesting that urea under urea deep placement would be hydrolyzed at a slower rate in the lower soil layers than in the surface soil and has a greater chance of being absorbed by plants. Similarly, our results also suggest that overturning soil before urea fertilization and crop planting could potentially lower the NH3 volatilization rate since the high urease activity in the surface soil will be diluted by the lower layer soils.
Soil urease activity and ureC gene abundance were significantly correlated in the surface soils (0–10 cm) but not in the lower soil layers (10–20 and 20–30 cm) (Fig. 4, Table 1). These results suggest that the contribution of ureolytic bacteria to urea hydrolysis is soil depth dependent, where ureolytic bacteria may contribute greatly to urea hydrolysis in the surface soil but have a decreasing role as the soil depth increases. The lower correlation in the lower soil layers suggests that other sources contribute to the observed urease activity, presumably fungi and plants (Dharmakeerthi and Thenabadu 1996; Hasan 2000; Geisseler et al. 2010).
The proportion of the ureolytic bacteria in the bacterial community, as represented by the ureC/16S rRNA gene ratio, did not significantly change in response to the urea fertilization. This finding is consistent with the results from previous studies (Roberge 1967; Lloyd and Sheaffe 1973), suggesting that urea application not only increased the abundance of ureolytic bacteria but also the abundance of non-ureolytic bacteria. However, ureC-harboring taxa showed different responses to urea fertilization (Fig. 3) and extra attention should be paid to the taxa that responded positively to urea application, such as Lutibaculum, as they were preferentially enriched by urea application, suggesting that these microorganisms have a high level of urea hydrolysis activity.
In the majority of functional gene studies, the amplicon sequences are clustered into operational taxonomic units (OTUs) using a similarity threshold. However, functional genes evolve at varying rates and do so faster than the 16S rRNA gene (Liesack and Kim 2014). These genes require more complex strategies to extrapolate the threshold for clustering taxonomically homogeneous sequences into an OTU. The use of arbitrary threshold values could lead to large bias with respect to community composition and diversity. In this study, we used BLAST combined with a comprehensive ureC gene database to perform the taxonomic analysis. Although this approach has some disadvantages, such as the underestimation of ureolytic bacterial diversity by removing sequences with low similarity to those in the database, it avoided the biases mentioned above caused by the use of an arbitrary threshold in the OTU-based methods.
Through high-throughput sequencing, different response patterns of ureolytic microbes to urea application and soil depth were observed (Fig. 3), indicating that ureolytic microbes exhibit niche separation and functional complementarity. The negative response of ureolytic species to urea application may indicate a preference for a low N conditions and a low competitiveness under high N conditions. The different preferences of ureolytic species generates a flexibility within the community to confront environmental changes. However, the ureolytic community may also be affected by the products of urea hydrolysis, such as ammonia. For example, Nitrospira, which are also ammonia oxidizing bacteria (AOB), were significantly decreased by urea application (Fig. 3). This result contrasted with previous studies in which N fertilization increased the abundance of AOB (Xu et al. 2012; Sun et al. 2015a; Segal et al. 2017). However, some studies also revealed that some AOB clusters were decreased under urea application (Xiang et al. 2017). The decreased abundance of ureC-harboring AOB in our results, combined with previously published findings, suggested that the ureC-harboring AOB may be less competitive than their non-ureC counterparts under urea application.
The diversity of the ureolytic bacterial community was lower in the 0–10 and 10–20 cm soil layers following urea application, which is consistent with the results of other studies showing that chemical fertilizers decreased soil bacterial diversity in the surface soil (Coolon et al. 2013; Sun et al. 2015b). However, in the deeper soil layer (20–30 cm), significantly lower ureolytic community diversity was only observed in the N600 treatment than in the control soils. A greater impact of urea application on the ureolytic community structure was observed in the lower soil layer than in the upper layers (Fig. 2). We speculated that this may be due to the indirect impacts of urea application, such as changes in plant physiological properties, as plants have a large contribution to driving and shaping soil microbial communities through the secretion of exudates (Haichar et al. 2008; Badri et al. 2013). Fertilization has a notable effect on the vertical distribution of roots and exudates (Lopez, Sabate and Gracia 2001; Zhou and Shangguan 2007; Zhu, Vivanco and Manter 2016; Coskun et al. 2017), which results in changes in microbial communities with soil depth. In addition, some of the ureolytic species detected in the soil in this study are closely associated with plants, such as Bradyrhizobium lablabi and Cupriavidus taiwanensis (Amadou et al. 2008; Chang et al. 2011), which are symbiotic N-fixing bacteria with nodulation capabilities. The variation of these species in soils may be closely associated with changes in plant roots. Thus, greater attention should be paid to the impact of agricultural practices on deep soil microbial communities, as they may be regulated differently from surface soil communities.
CONCLUSIONS
The soil urease activity and ureolytic bacterial community varied with soil depth. Surface soil exhibited a greater urease activity than that in deep layer soils. The significant positive correlation between soil urease activity and ureolytic bacterial abundance in the surface soil (0–10 cm) indicated an important role of ureolytic bacteria in urea hydrolysis in surface soil. The long-term urea application greatly increased soil urease activity and ureolytic bacterial abundance, but decreased ureolytic bacterial diversity. Taken together, our results revealed quantitative and structural variations in ureolytic bacterial communities along a soil profile, their different responses to urea application and the different correlations between ureolytic bacteria and soil urease activity along soil depth. These findings provide new insight into the mechanisms of urea hydrolysis in an intensive agricultural area and provide useful information for developing new techniques to mitigate NH3 volatilization and reduce N loss. In future studies, determining how urea fertilization alters ureolytic bacterial communities and the relationship between ureolytic bacterial communities and NH3 volatilization should be considered.
ACKNOWLEDGEMENTS
We thank the staff at the experiment station for the assistance in soil sampling. This work was financially supported by the National Key Research and Development Program of China (2017YFD0800604 and 2017YFD0200100) and the National Natural Science Foundation of China (41807057 and 41701361) and the Hundred Talents Program of the Chinese Academy of Sciences. The first author, RS, appreciates his soul mate Jessy for shining his life. We also thank the editor and the reviewers for their valuable suggestions for manuscript improvement.
Conflict of interest. None declared.
REFERENCES
Author notes
These authors have contributed equally to this work.
