


ABSTRACT
Beech forests reaches its native distribution limit in SE Norway, but is expected to expand substantially northwards due to climate warming. This may potentially result in a fundamental transformation of contemporary Northern European forests, with tentative effects on the associated belowground fungi. Fungal communities mediate vital ecosystem processes such as ecosystem productivity and carbon sequestration in boreal forests. To investigate how soil fungi is affected by the vegetation transition from spruce to beech forest, we sampled litter, humus and mineral soil in a forest landscape dominated by beech, spruce or a mixture of these. The fungal communities in the soil samples were analyzed by DNA metabarcoding of the rDNA ITS2 region. Although soil layers were the most important structuring gradient, we found clear differences in fungal species composition between spruce and beech plots. The differences in fungal community composition were most evident in the litter and least in the mineral soil. Decomposers, most notably Mycena, dominated the litter layer while various mycorrhizal fungi dominated the humus and mineral layers. Some ectomycorrhizal taxa, such as Cenoccocum and Russula, were more abundant in spruce forests. Differences in fungal community composition between forest types can potentially have large impacts on carbon sequestration rates.
INTRODUCTION
Key ecosystem processes such as ecosystem productivity, gas fluxes and carbon sequestration are largely mediated through soil microbial communities in temperate and boreal forest ecosystems (Bardgett and Wardle 2010). However, the vegetation has the potential to significantly influence the soil community in a number of ways. Trees are particularly important in this context as they modify the physical environment of soils by influencing the microclimate through shading and frost protection. In addition, trees influence soil nutrient availability and moisture through litter production, interception of rain and transpiration of water (Stoutjesdijk and Barkman 1992), which give rise to tree-driven structures in the soil microbial community (Bach et al. 2010) and fungal soil communities that are tree species-specific (Prescott and Grayston 2013; Urbanová, Šnajdr and Baldrian 2015). A direct tree influence on the fungal community through release of root exudates and interaction with mycorrhizal fungi are of importance in this context (Augusto et al. 2015). Moreover, the type of litter that trees produce, both below- and above ground, influence the soil community by impacting its food web directly as well as indirectly (e.g. Wardle et al. 2004). Forest soil microbial communities are thus impacted significantly by trees, and their species-specific importance as drivers of the distribution and structure of fungal communities has recently been shown by Mašínová et al. (2017) and Bahnmann et al. (2018). However, many fungi have a broad host range and are thus not tree species-specific (e.g. Kennedy, Izzo and Bruns 2003).
Although trees are important, soil stratification, with clear separation of organic matter at different stages of decomposition with progressing soil depth, is still the primary structuring factor of fungal communities in temperate and boreal forest soils (Rosling et al. 2003; Lindahl et al. 2007; Clemmensen et al. 2013; Bödeker et al. 2016). This holds both in terms of fungal guilds and the abundance among individual species within a guild (Baldrian et al. 2012). Saprotrophic fungi dominate the litter horizon, while mycorrhizal fungi make up most of the fungal communities in the underlying and older organic humus and mineral soil horizons (Rosling et al. 2003; Lindahl et al. 2007; Clemmensen et al. 2013). Hence, rapid succession occurs in the fungal community during litter decomposition (Lindahl et al. 2007; Voříšková and Baldrian 2013). Interestingly, the succession-driven dynamics in the community are accompanied by seasonal dynamics as the relative abundance of saprotrophic and mycorrhizal fungi change during the seasons—this is because saprotrophic fungi are more active when photosynthesis is low (Baldrian et al. 2012; Santalahti et al. 2016). It is debated whether the structuring of saprotrophic and mycorrhizal fungi with soil depth is due to substrate niche differentiation, or competitive nutrient interactions between saprotrophic and mycorrhizal fungi, i.e. the Gadgil effect (Gadgil and Gadgil 1971; Fernandez and Kennedy 2016). However, the experimental study by Bödeker et al. (2016) indicates that the structuring of saprotrophic and mycorrhizal fungi in the soil is due to a combination of effects determined by substrate quality and depth location in the soil profile. There is nonetheless a need for more knowledge about the relationships between fungal community structure and soil depth. For example, it is not known to what extent these relationships varies among forest types, and only little is known about how they are impacted by different dominating tree species.
European beech (Fagus sylvatica L.; hereafter beech) and Norway spruce (Picea abies (L.) H.Karst.; hereafter spruce) are both late successional species that are economically and ecologically important in large parts of Europe. Beech reaches its native distribution limit in south eastern Norway, but is expected to expand substantially northwards in the oceanic and sub-oceanic parts of Scandinavia (the boreonemoral vegetation zone) due to climate warming (Hickler et al. 2012). This zone is today dominated by spruce, but there is currently a relatively high upsurge of young beech trees in spruce forests, which can potentially result in a fundamental transformation of contemporary Northern European forests. In light of this, we need a better understanding of what effect this will have on the fungal community. Recent studies have characterised the microbial communities in spruce and beech forests, but these studies have been restricted to the mineral soil layer only (Nacke et al. 2016; Uroz et al. 2016), or to the litter and upper organic soil layers (Bahnmann et al. 2018). Interestingly, results regarding the size and activity of the microbial soil communities in spruce versus beech soils diverge among studies as Malchair and Carnol (2009) found larger sizes and higher respiration rates in spruce forest soil, while Spohn and Chodak (2015) and Zederer et al. (2017) found the opposite. However, the response of the microbial community to changes in tree species composition is likely to vary among all soil layers—from the litter, via the organic top soil and down into the underlying mineral soil—and to the best of our knowledge, no study has yet characterised the soil microbial communities in all soil layers in neighbouring spruce and beech forests.
This study was performed in a beech and spruce dominated forested landscape in SE Norway. Here, we sampled litter, humus and mineral soil in forest types dominated by beech, spruce or a mixture of the two species. Fungal communities in the soil samples were analyzed by DNA metabarcoding of the rDNA ITS2 region (Lindahl et al. 2013). We used this set-up to test the following hypotheses: (i) fungal species composition will differ with dominating tree species, and these responses will be soil layer dependent; (ii) fungal soil communities will be most diverse in the mixed forest; (iii) differences between forest types will be stronger in the litter layer than in the deeper layers; (iv) at deeper layers, tree species composition will influence the species composition of mycorrhizal but not saprotrophic fungi.
MATERIALS AND METHODS
Sampling site and design
This study was conducted in a spruce and beech dominated landscape in Tjølling, Larvik Municipality, SE Norway (59° 3′ 51″ – 59° 4′ 32″ N, 10° 6′ 0″ – 10° 6′ 31″ E, 50 m a.s.l.). We randomly selected 11 circular plots (radius: 5.64 m = 100 m2) and recorded tree species and DBH of every tree (>2 cm DBH) in the plots. Only beech and spruce trees occurred in the plots. We considered plots to be spruce or beech dominated when one of the tree species composed at least 85% of the total basal area in the plot. Mixed plots were composed of 42%–50% beech. There was four plots each of beech and spruce and three mixed plots. The forest floor in spruce plots was dominated by feather mosses and a sparse cover of Oxalis acetosella, Maianthemum bifolium, Melampyrum pratense and Vaccinium myrtillus. The forest floor in the mixed plots was similar to the spruce plots while the vegetation in the beech forest floor was very sparse. All plots are on sandy soil with the same underlying bedrock (monzonite). The soils were all podzols with easily distinguishable horizons. Plots were minimum 50 m apart and plots of the same forest type was always separated by another forest type.
In each of the 11 plots, we established five sub-plots (one in the centre and one in each cardinal direction, 2 m from the centre), resulting in total in 55 plots. In each sub-plot we took five soil cores (sub-samples) with a 28 mm soil corer between August 26 and September 4 2013. Soil samples were separated into three categories: litter layer, humus layer and mineral layer, resulting in 165 samples in total. From each layer, we removed the upper 2 cm and sampled the next 2 cm of the profile, resulting in 12 ml of soil per sub-sample. The five sub-samples of each depth category were merged in the field (resulting in 60 ml of soil per sample), and directly placed on ice in plastic-bags. The soil corer was surface sterilized with 100% ethanol and a gas torch between each sampling. Samples were freeze-dried before being homogenized in a ball mill and then stored at −80°C until the start of the analyses.
DNA sequencing analyses
DNA was extracted once from a sub-sample of the lyophilized, samples using a modified CTAB-based extraction protocol (Murray and Thompson 1980; Gardes and Bruns 1993). DNA concentration was calculated at A260 using a NanoDrop spectrophotometer for all samples. 300 ng of DNA was then subjected to PCR. ITS2 was amplified using the primers fITS7 (Ihrmark et al. 2012) and ITS4 (White et al. 1990). To increase the multiplexing of the samples, a two base pair (bp) tag was attached at the 5′ end of both forward and reverse primers. Illumina sequencing introduces sequence-specific errors due to phasing caused by specific sequence patterns (Nakamura et al. 2011). Therefore, sample-specific multiplex identification DNA tags (MIDs) of varying size (4–8) were designed to correct this bias. These MIDs were attached at both ends of the Illumina-specific adapter. One end (5′) of the adapter was phosphorylated and the other end (3′) included a ‘T’ base overhang, to allow annealing with an ‘A’ overhang on the PCR-amplified product. Solid-phase reversible immobilisation (SPRI) beads were used for the purification of amplified PCR products. Paired-end (PE) adapters oligo mix were ligated to the fragments using T4 DNA ligase (New England Biolabs Ipswich, Massachusetts, USA). To cut ‘ideoxyU,’ located at the center of the Illumina adapter, 1 μl USER enzyme (New England BioLabs) was used. QPCR was used for library quantification to find the optimal end point (low CT value) of the PCR cycle, followed by 5′-end adaptor extension and library-enrichment PCR with 11 cycles, using Q5® high-fidelity DNA polymerase enzyme. The indexed NGS libraries were sequenced on an Illumina MiSeq, using PE 2 × 300 bp reads and the v3 sequencing reagents. For three of the samples (DNA extracts), 15 technical replicates were run to investigate the level of biases introduced during PCR, library preparation and sequencing combined.
Bioinformatics analyses
After sequencing, reads were paired using FLASH v.1.2.11 (Magoč and Salzberg 2011) with a maximum overlap of 300 bp and a mismatch density of 0.3. Reads were de-multiplexed according to their respective indices. While the index design allows for error correction, the conservative decision was made to discard all reads with any index mismatch, to minimise the danger of misattributing reads to the incorrect sample. Barcode and primer sequences were removed, and paired amplicons were subjected to additional quality filtering using Qiime v1.8.0 (Caporaso et al. 2010) with the following criteria: (i) length between 250 and 550 bp, (ii) average quality score >35 (indicates a per-base error probability of 0.0003), (iii) <2 ambiguous bases, (iv) maximum homopolymer length <10, (v) 0 barcode errors, (vi) <2 errors in the forward primer and (vii) <2 errors in the reverse primer. Chimeric sequences were detected and removed from the dataset using uchime (Edgar et al. 2011) as implemented in Qiime v.1.8.0 under the default settings. After quality filtering we had on average 45 705 reads per sample. Sequences from all runs were pooled and clustered into operational taxonomic units (OTUs) using an open-reference-based implementation of the uclust algorithm (Edgar et al. 2011) as implemented in Qiime v1.8.0 with a 97% similarity cutoff the 01.08.2015 UNITE+INSDC 97% clustered database as reference centroids for ITS2 (Kõljalg et al. 2013). The most abundant sequence in each cluster was designated the representative sequence and given a taxonomic assignment using the RDP naïve Bayesian classifier (Wang et al. 2007) against the 01.08.2015 UNITE+INSDC 97% clustered database release (Kõljalg et al. 2013) for ITS2. Identified OTUs were categorised into the fungal guilds: saprotrophs, plant pathogens and ectomycorrhizal fungi based on the FUNGuild database (http://funguild.org; Nguyen et al. 2016). Sequence data (raw sequences, accepted sequences after filtering and representative sequences for all OTUs) as well as the final OTU/sample data matrix, are archived at Dryad: https://doi.org/10.5061/dryad.q6q1726.
Soil chemistry analyses
For soil pH measurements, 10 ml ground soil in 25 ml deionised water was shaken and then let to rest for 24 h before it was shaken again and pH measured with an inoLab pH 720 (WTW GmbH, Weilheim, Germany). Soil C and N were measured from 10–20 mg sub-samples from the ground soil with an Elementar Vario MICRO cube (Elementar, Hanau, Germany).
Statistics
To test for the effect of tree species composition (beech, spruce and mix) and soil layers (litter, humus and mineral soil) on species richness, Pielou's measure of species evenness and relative abundance of various fungal guilds we used Linear mixed effects models, with plot nested within block as random factor. Some variables were log or square-root transformed in order to fulfil assumptions of normally distributed residuals.
Statistical analyses of the fungal composition was carried out using a rarefied dataset of 926 sequences per sample. Community composition was visualised using non-metric multidimensional scaling (NMDS) of a Bray–Curtis distance matrix using the metaMDS function in the R package vegan (Oksanen et al. 2016). The envfit function in the vegan package was used to fit all measured environmental variables onto ordinations. We used the ordiellipse function (Oksanen et al. 2016) to plot the 95% confidence intervals (CI) of group scores of the six forest type × soil depths combinations onto the NMDS ordination. We used permutational multivariate analysis of variance using distance matrices (Anderson 2001), as implemented in function ‘adonis’ of ‘vegan’(Oksanen et al. 2016), with Bray–Curtis distances and 999 permutations, to test for the effect of tree type, soil layer and their interaction on fungal species composition. All analyses were performed in R 3.2.5 (R Core Team 2016).
RESULTS
Overall, litter samples had higher OTU richness (177.2 ± 3.0) than humus (153.7 ± 4.3), that in turn had higher richness than mineral soil (131.6 ± 3.2) samples (Table 1; Tukey P < 0.05). We found fewer OTUs in the samples from beech forests (137.7 ± 3.6) than in mixed forest and spruce samples (163.5 ± 4.4 and 160.1 ± 4.1, respectively), averaged across all soil layers (Table 1; Tukey P < 0.05). However, there was a significant Tree species × Soil layer interaction (Table 1), as there were relatively more OTUs in the litter in the spruce-dominated plots than in those dominated by beech. In the humus layer, we found more OTUs in the mixed samples than in beech and no difference between spruce and beech. In the mineral soil, there were no differences in number of OTUs (Fig. 1a), and it was commonly dominated by only a few species. The fungal community was significantly more even in the litter samples than in the humus and mineral soil (Table 1, Fig. 1b).
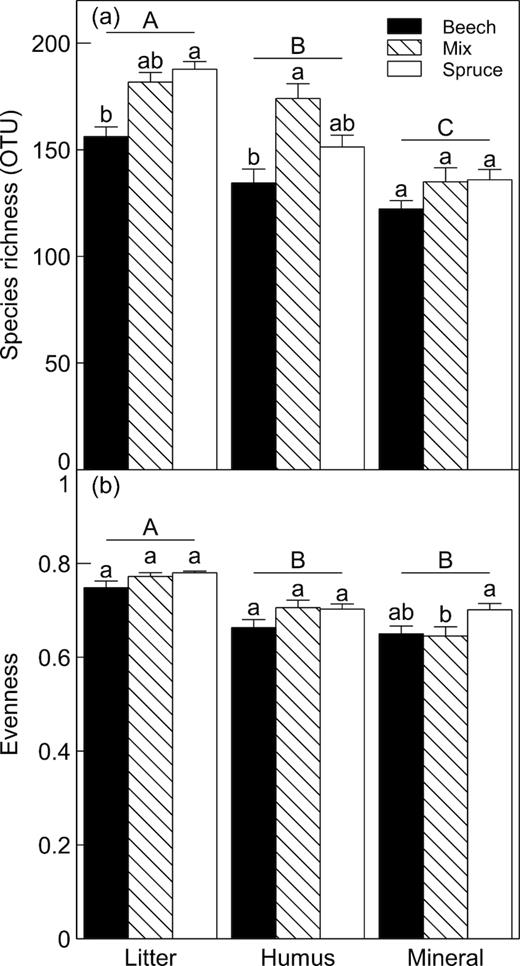
Mean ( ± 1 SE) of (a), species richness and (b), Pielou's evenness in litter, humus and mineral soil from plots dominated by beech, spruce or a mix of the two species. Bars, within each soil layer, topped with the same lower case letter are not significantly different (P > 0.05, Tukey). Different upper case letters denote significant difference (P > 0.05, Tukey) between soil layers averaged across al`l forest types.
Linear mixed effects models, with plot nested within block as random factor, testing for the effect of tree species composition (beech, spruce and mix) and soil layers (litter, humus and mineral soil) on species richness (OUT) and Pielou's evenness. Numbers in bold represent significant effects at P < 0.05.
| Tree species (T) | Soil layer (L) | T × L | |
|---|---|---|---|
| Χ2 (P) | Χ2 (P) | Χ2 (P) | |
| Species richness | 11.26 (0.004) | 150.74 (<0.001) | 14.30 (0.006) |
| Evenness | 11.42 (0.003) | 102.35 (<0.001) | 6.30 (0.178) |
| Tree species (T) | Soil layer (L) | T × L | |
|---|---|---|---|
| Χ2 (P) | Χ2 (P) | Χ2 (P) | |
| Species richness | 11.26 (0.004) | 150.74 (<0.001) | 14.30 (0.006) |
| Evenness | 11.42 (0.003) | 102.35 (<0.001) | 6.30 (0.178) |
Fungal species composition varied distinctly, both with proportion of beech (along the second NMDS axis) and between different soil layers (along the first NMDS axis) (Fig. 2). A permutational multivariate analysis of variance revealed significant effects of tree species (F2135 = 7.11, P = 0.001), soil layer (F2135 = 16.16, P = 0.001) and a significant interaction effect (F4135 = 2.81, P = 0.001) on the fungal species composition. These differences are also visualised with the 95% CIs in Fig. 2a. The shift in species composition from the litter to the mineral soil was mainly driven by mycorrhizal fungi, yeasts and molds becoming relatively more abundant, and saprotrophs as well as plant pathogens relatively less abundant (Table 2 and Figs 2b–3). Furthermore, the proportion of unknown guilds, primarily ascomycetes, were larger in the litter samples compared with the other two layers (Fig. 3).
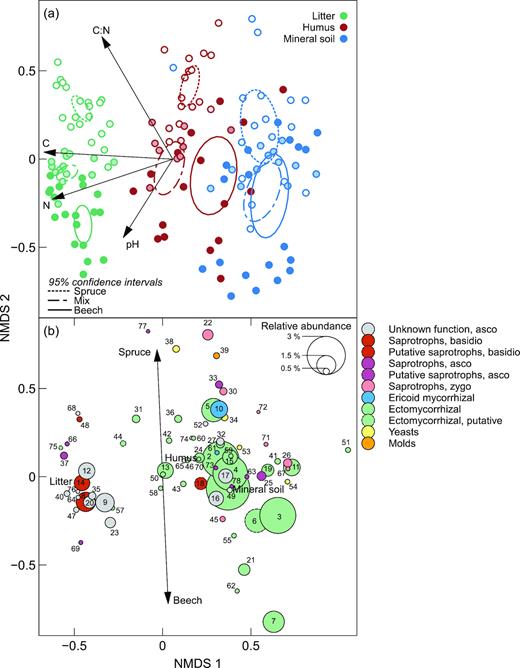
Non-metric multidimensional scaling (NMDS) ordination plots of the fungal community composition in litter, humus and mineral soil in forests with various proportions of beech and spruce. (a), Ordination diagram of samples (two-dimensional stress = 0.18). Ellipses denote 95% confidence intervals for the centroids of the forest type × soil depth factor combinations. Symbol fill intensity denote proportion beech from 0% (unfilled) to 100% (filled). The arrows show the direction of increasing soil pH and C, N and C:N in the soil, and their length is proportional to the correlation between the variable and the ordination (b), Species plot based on all fungal operational taxonomic units (OTUs) present (1323), with only the 78 OTUs with total abundance >0.3% of the dataset are shown (representing 59.4% of the total reads). The diameter of the dots indicate the relative abundance of each OTU. The arrow indicates the direction of maximal increase for the proportion of beech and spruce, respectively. Numerical prefixes identify all OTUs: Cenococcum (1, 50), Elaphomyces muricatus (2), Elaphomyces (3, 4), Cortinarius (5, 43, 46), Atheliaceae (6), Russula (7, 21), Mycena (8, 14), Leotiomycetes (9, 17, 23, 49, 64), Oidiodendron (10), Russula vesca (11), Helotiales (12, 20, 32, 40, 76), Piloderma fallax (13), Tylospora fibrillosa (15, 31), Helotiaceae (16), Mycenaceae (18), Tylospora (19, 41), Umbelopsis ovata (22), Cenococcum geophilum (24, 58), Dermataceae (25, 63, 78), Umbelopsis (26), Amanita fulva (27), Phacidium lacerum (28), Lophodermium piceae (29), Mortierella (30, 67, 72), Trichoderma (33), Cryptococcus terricola (34), Ascomycota (35, 47, 52, 68), Cortinarius albovariegatus (36), Chalara (37), Trichosporon gamsii (38), Penicillium spinulosum (39), Chloridium (42), Atheliales (44), Mortierella humilis (45), Auriculariales (48), Cortinarius stillatitius (51), Cryptococcus podzolicus (53), Saccharomycetales (54), Inocybe (55), Polyscytalum (56), Russula nobilis (57), Clavulina (59), Russula fellea (60), Oidiodendron pilicola (61), Hydnum repandum (62), Eurotiomycetes (65), Chalara piceae-abietis (66), Cudoniaceae (69), Piloderma (70), Umbelopis ramanniana var. angulispora (71), Hymenoscyphus spaurim (73), Meliniomyces variabilis (74), Cantharellales (75), Phoma (77). Further taxonomic information as well as fungal guilds and accession numbers are given in Table S1, Supporting Information.
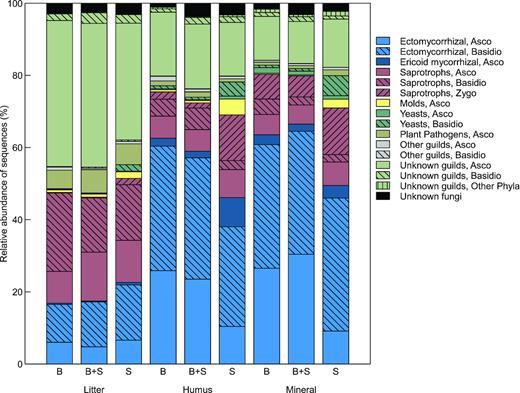
Relative abundance of fungal guilds in litter, humus and mineral soil from stands dominated by beech, spruce or a mixture of the two species.
Linear mixed effects models, with plot nested within block as random factor, testing for the effect of tree species composition (beech, spruce and mix) and soil layers (litter, humus and mineral soil) on relative abundance of various fungal guilds. Numbers in bold represent significant effects at P < 0.05.
| Tree species (T) | Soil layer (L) | T × L | |
|---|---|---|---|
| Χ2 (P) | Χ2 (P) | Χ2 (P) | |
| Ectomycorrhizal, asco† | 2.87 (0.239) | 180.94 (<0.001) | 59.54 (<0.001) |
| Ectomycorrhizal, basidio | 0.01 (0.996) | 103.01 (<0.001) | 4.00 (0.406) |
| Ericoid mycorrhizal, asco†† | 3.16 (0.206) | 166.12 (<0.001) | 21.48 (<0.001) |
| Saprotrophs, asco† | 2.04 (0.361) | 56.00 (<0.001) | 5.89 (0.208) |
| Saprotrophs, basidio† | 2.55 (0.280) | 377.11 (<0.001) | 19.32 (<0.001) |
| Saprotrophs, zygo†† | 4.39 (0.112) | 301.67 (<0.001) | 14.72 (0.005) |
| Molds, asco†† | 2.66 (0.264) | 15.39 (<0.001) | 13.87 (0.008) |
| Yeasts, asco† | 1.99 (0.369) | 57.90 (<0.001) | 3.15 (0.534) |
| Yeasts, basidio† | 4.67 (0.097) | 58.62 (<0.001) | 15.65 (0.004) |
| Plant pathogens†† | 1.01 (0.604) | 221.96 (<0.001) | 9.27 (0.055) |
| Unknown guilds, all phyla | 1.76 (0.414) | 319.24 (<0.001) | 9.03 (0.060) |
†log transformed,
††square root transformed.
The effect of the dominant tree species on fungal species composition was most pronounced in the litter samples followed by the humus samples (Fig. 2a, Fig. S1, Supporting Information). However, for the mineral soil samples the 95% CIs for the beech and spruce stands overlapped. Meanwhile, running separate NMDS ordinations for the three soil horizons revealed significant differences between beech and spruce also in the mineral soil (Table S1, Supporting Information). In the litter samples, this pattern was partly driven by various species of Mycena and Elaphomyces, showing an affinity to beech, while Tylospora and Desmazierella were more likely to occur in spruce plots (Fig. 2b, Fig. S1, Supporting Information). Furthermore, plant pathogens showed clear preferences for tree species in the litter samples. OTUs assigned to Phacidium lacerum and Lophodermium piceae were much more common in spruce plots, while OTUs annotated as Polyscytalum sp. and Adisciso kaki showed an affinity to beech (Fig. S1, Supporting Information). In the litter samples, there was relatively little variation in fungal guilds between the forest types. By contrast, in the humus and mineral soil there were some clear patterns in relative abundance of fungal guilds. Differences between forest type was partly driven by higher relative abundances of ericoid mycorrhizal (ERM) fungi (e.g. Oidiodendron), molds (e.g. Trichoderma and Penicillium), basidiomycete yeasts (e.g. Trichosporon and Cryptococcus) and zygomycete saprotrophs (e.g. Umbelopsis ovata and Mortierella) in plots dominated by spruce (Figs 3–4, Fig. S1, Supporting Information). Meanwhile, various ectomycorrhizal species of Russula, Elaphomyces and Inocybe showed an affinity to beech (Fig. 2b, Fig. S1, Supporting Information).
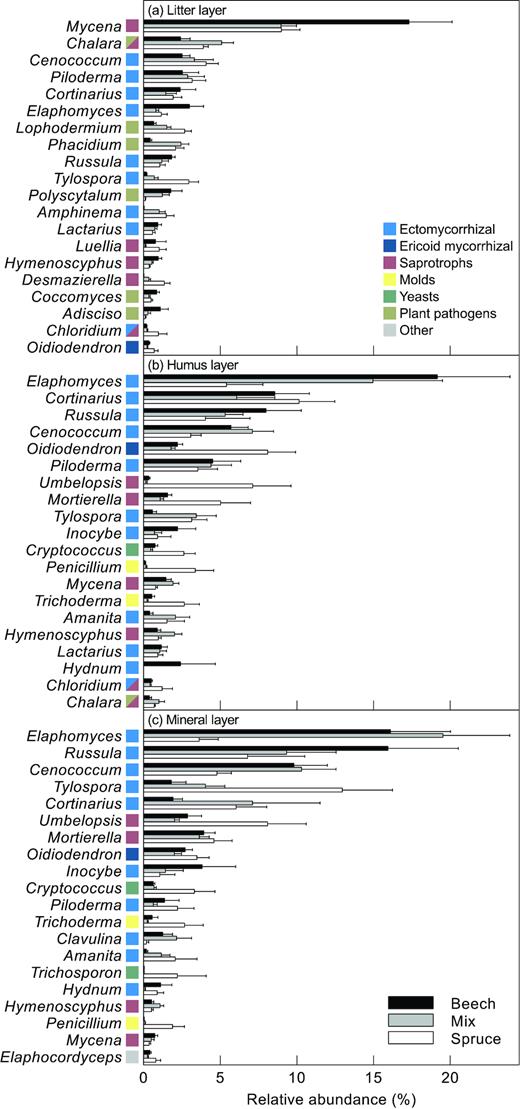
Relative abundance (mean ± 1 S.E.) of the 20 most abundant genera in the (a), litter layer (b), humus layer and (c), mineral soil, respectively, in stands dominated by beech, spruce or a mixture of the two species. Colour next to genus name denotes fungal guild (see insert).
The major guilds, mycorrhizal fungi and saprotrophic fungi, differed in their affinity to the dominant tree species (Fig. S2, Supporting Information). Differences in species composition between beech and spruce plots were more pronounced for mycorrhizal fungi than for saprotrophs. For instance, in the mineral soil, species composition of mycorrhizal fungi, but not saprotrophs, was significantly different between beech and spruce plots (see CIs in Fig. S2, Supporting Information). The dominant mycorrhizal genera, e.g. Cenococcum, Elaphomyces and Cortinarius, showed an affinity to humus and mineral soil. Meanwhile, the mycorrhizal fungal community in litter samples was characterized by less abundant OTUs, e.g. Piloderma, Russula and Tylospora. Saprotrophic fungi showed a stronger division between litter samples and the other layers compared with mycorrhizal fungi. While saprotrophic fungi in general were most abundant in the litter layer, saprotrophic zygomycetes (Mortierella and Umbelopsis) were rarely found in litter samples (Figs 3–5). In the beech and mixed plots, this group was mostly restricted to the mineral layer, while in the spruce dominated plots, where they were most abundant, there was no difference between humus and mineral soil layers.
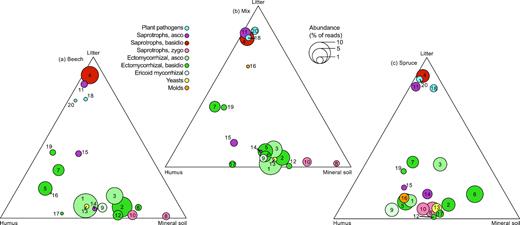
Ternary plots of the 20 most abundant genera and their relative abundances in litter, humus and mineral soil in (a), beech (b), mix and (c), spruce-dominated stands. Colour denote functional guild (see insert) and numbers relate to the following genera: (1) Elaphomyces, (2) Russula, (3) Cenococcum, (4) Mycena, (5) Cortinarius, (6) Tylospora, (7) Piloderma, (8) Umbelopsis, (9) Oidiodendron, (10) Mortierella, (11) Chalara, (12) Inocybe, (13) Cryptococcus, (14) Trichoderma, (15) Hymenoscyphus, (16) Penicillium, (17) Amanita, (18) Lophodermium, (19) Lactarius, (20) Phacidium.
Soil pH did not vary significantly between the forest types (Fig. S3, Supporting Information). However, there was a significant interaction effect with soil layer, since the pH in the mixed forests was higher in the litter layer than in the mineral soil, while the pH was similar in the monospecific stands across soil layers (Fig. S3, Supporting Information). Soil C and N concentration decreased significantly with soil depth and this pattern was most pronounced in the spruce forest, resulting in a significant interaction effect (Fig. S3, Supporting Information). Both Soil C and N was significantly correlated with compositional changes in the fungal communities with soil depth (Fig. 2). However, soil C and N cannot explain the observed differences in species composition between forest types (Fig. 2, Fig. S1, Supporting Information). Instead, both C and N increased with increasing abundance of Russula species in the mineral soil (Fig. S1, Supporting Information). The C:N ratio showed a strong correlation with species composition (Fig. 2), especially when considering litter, humus and mineral soil separately (Fig. S1, Supporting Information). The C:N ratio was significantly higher in the spruce forest, but this pattern was less pronounced in the litter layer (Fig. S3, Supporting Information).
DISCUSSION
We found clear differences in fungal species composition between spruce and beech forests. Hence, the change in dominant tree species, from spruce to beech, will translate into a significant change in the belowground fungal communities. The difference in fungal community composition was most evident in the litter horizon and least in the mineral soil horizon. There was a higher proportion of basidiomycete saprotrophic fungi, most notably Mycena, in the deciduous litter while latent saprotrophic ascomycetes, like Lophodermium and Chalara, were more confined to coniferous litter. These findings are similar to our earlier studies of litter fungi in beech and spruce forests (Asplund et al. 2018). In that study, we showed that litter-bags dominated by Mycena had higher decomposition rates, which in turn could reduce carbon sequestration (Asplund et al. 2018). Lophodermium and Chalara include several species that are commonly found on coniferous litter or as needle endophytes, and they are thus expected to be more abundant below spruce (Korkama-Rajala, Müller and Pennanen 2007; Koukol 2011). In line with our findings, litter samples have been found to have a higher percentage of tree species-specific OTUs than soil samples (Urbanová, Šnajdr and Baldrian 2015; Bahnmann et al. 2018). Further, Clemmensen et al. (2015) found that the fungal community in the litter layer was more related to the long-term successional gradient than were the fungal communities in the humus layers. Prescott and Grayston (2013) argued that fungal communities in soils can be expected to be less influenced by tree species than those in the forest floor, because the latter is largely created from the litter of the tree. In contrast to the overall lack of significant differences in species composition in the mineral soil, the mycorrhizal fungal communities were significantly different in spruce and beech plots. The genera Elaphomyces, Russula, Cenococcum and Inocybe were far more abundant in the beech and mixed forest compared to the spruce forests, while Tylospora, Amanita and to some extent Cortinarius showed an opposite pattern. These findings are partly in line with earlier studies from Germany, where all genera but Cenoccum and Cortinarius showed the same pattern (Nacke et al. 2016), and France where Russula spp. also were more abundant in the beech forest (Uroz et al. 2016). It is well known that ectomycorrhizal fungi have various levels of host specificity (Borowicz and Juliano 1991; Molina, Massicotte and Trappe 1992; Bruns, Bidartondo and Taylor 2002; Martínez-García et al. 2015). Looking at these patterns at a genus level may mask underlying species-specific effects though. Martínez-García et al. (2015) found that 29% of the variance in fungal communities was explained by host plant in a long-term chronosequence spanning 120 000 year. As expected, the ERM Oidiodendron was associated with coniferous forests due to prevalence of ericoid plants here. The observed shift in fungal communities could also be due to indirect effects of changes in dominant tree species, e.g. soil C:N and litter quality. Likewise, Sterkenburg et al. (2015) found C:N to explain differences in fungal communities between spruce and pine forests. Bahnmann et al. (2018) suggested that community composition differences between spruce, beech and oak stands could be explained largely by differences in pH. However, our observed differences in the fungal communities between spruce and beech stands is unrelated to soil pH, which did not vary between stand types.
Community composition of mycorrhizal fungi are suggested to play an important role for C sequestration in soil due to differences in chemical and morphological traits (Fernandez and Kennedy 2015), and this could possibly explain the higher mineral soil C content in our beech forests. For instance, Clemmensen et al. (2015) attributed the increased humus accumulation, and thus carbon storage, at late successional stages to an increased abundance of fungi with resistant structures. We found higher C content with increasing abundance of Russula spp., which has a high C sequestration potential due to high tissue chitin concentrations (Wallander, Massicotte and Nylund 1997; Hoeksema and Classen 2012). Further, Cenococcum, which had twice as high relative abundance in beech forest soil compared with spruce forests, has 4 to 10 times as long persistence time in soil compared with other ectomycorrhizas due to its high degree of melanisation (Fernandez et al. 2013). In humus and mineral soil, beech and mixed forests had a higher proportion of mycorrhizal fungi relative to saprotrophs. This pattern may also have led to higher carbon sequestration in the beech forests due to the ‘Gadgil effect’, suggesting that ectomycorrhizal fungi compete with saprotrophic fungi for limiting N and thus hamper decomposition (Gadgil and Gadgil 1975). Meanwhile, other studies on carbon storage in European beech and spruce forests show contrasting, but generally small, patterns (Berger et al. 2009; Cremer, Kern and Prietzel 2016; Ransedokken 2016; Uroz et al. 2016).
The primary gradient driving the differences in soil fungal communities was soil depth, as shown in previous studies (Rosling et al. 2003; Lindahl et al. 2007; Clemmensen et al. 2013; Kyaschenko et al. 2017). Decomposers, most notably Mycena, and the endophytic and pathogenic fungi Lophodermium and Chalara, acting as latent decomposers (Korkama-Rajala, Müller and Pennanen 2007) dominated the litter layer while various mycorrhizal fungi dominated the humus and mineral layers. The molds Penicillium and Trichoderma and the yeast forming Cryptococcus and Trichosporon were far more common in the humus and mineral soil. Likewise, saprotrophic zygomycetes (Umbelopsis and Mortierella) were relatively more abundant in the mineral layer. Mortierella and Umbelopsis have earlier been observed to be important members of fungal communities decomposing fungal necromass (Brabcová et al. 2016). Hence, these zygomycetes could act as important decomposers of fungal necromass in deeper soil layers. Furthermore, our litter samples were not devoid of mycorrhizal fungi, and this group comprised approximately 20% of the total soil fungi community. The extramatrical mycelium of some mycorrhizal fungi, e.g. Cortinarius spp. that were common in our litter samples, occur predominantly in the litter and fragmented litter horizons (Genney, Anderson and Alexander 2006). The difference in species composition between the soil layers was most pronounced for saprotrophs. This makes sense because the fungal community undergoes rapid successional changes during leaf litter decomposition (Voříšková and Baldrian 2013). Therefore, litter samples are expected to be inhabited by fungi specialised to decompose litter.
We found that the dominant tree species affect both species richness and species composition of fungi, and that these effects are more pronounced in the litter compared with the humus and mineral soil layers. In the mineral soil, only mycorrhizal fungi had significantly different community composition between spruce and beech dominated plots. Spruce dominated plots had a higher abundance of saprotrophs relative to the abundance of mycorrhizal fungi. These differences in fungal community composition can potentially have large impacts on differences in carbon sequestration between these forests (Clemmensen et al. 2015). However, in order to better understand this we need quantitative analyses of the fungal community coupled with detailed analysis of soil carbon stocks and fluxes.
ACKNOWLEDGEMENTS
We thank Courtney Nadeau and Marie Davey for DNA and bioinformatics analyses. Marie Davey provided insightful comments to an earlier draft of the manuscript.
FUNDING
This study was funded by the Research Council of Norway [grant number 225018]. The authors declare no conflict of interest.
Conflicts of interest. None declared.
