


ABSTRACT
Salinity is one of the most important environmental factors influencing bacterial plankton communities in lake waters, while its influence on bacterial interactions has been less explored. Here, we investigated the influence of salinity on the bacterial diversity, interactions and community structure in Tibetan Plateau lakes. Our results revealed that saline lakes (salinity between 0.5 and 50 g/L) harboured similar or even higher bacterial diversity compared with freshwater lakes (< 0.5 g/L), while hyper-saline lakes (> 50 g/L) exhibited the lowest diversity. Network analysis demonstrated that hyper-saline lakes exhibited the highest network complexity, with higher total correlation numbers (particularly the negative correlations), but lower network module numbers than freshwater and saline lakes. Furthermore, salinity dominantly explained the bacterial community structure variations in saline lakes, while those in freshwater and hyper-saline lakes were predominately explained by water temperature and geospatial distance, respectively. The core operational taxonomic units (OTUs), which were ubiquitously present in all lakes, were less sensitive to enhancing salinity than the indicative OTUs whose presence was dependent on lake type. Our findings offer a new understanding of how salinity influences bacterial community in plateau lakes.
INTRODUCTION
Salinity has frequently been identified as one of the most important environmental factors influencing bacterioplankton communities in lakes, coastal waters, estuaries and oceans (Casamayor et al. 2002; Langenheder et al. 2003; Wu et al. 2006; Herlemann et al. 2011). In contrast to the straightforward response of macroorganisms to salinity (Gaston 2000), the effects of increasing salinity on the diversity of microorganisms are more complicated. A variety of responses at moderate salinity, such as reduced diversity (Rodriguezvalera et al. 1985; Benlloch et al. 2002), no effect (Herlemann et al. 2011), or a peak at moderate salinity (Hewson and Fuhrman 2004; Wang et al. 2011;), have been reported. Furthermore, high salinity influences bacterial community structure by selectively enriching certain bacterial lineages, while excluding bacterial lineages with low salinity tolerance (Chase 2007). For example, the relative abundance of Betaproteobacteria and Gammaproteobacteria has been reported to correlate negatively and positively with salinity, respectively (Benlloch et al. 2002; Wu et al. 2006). However, the influence of salinity on bacterial interactions remains largely unexplored in plateau lakes.
Despite the importance of salinity in driving bacterial diversity and community structure, it has been gradually recognised that environmental filtering alone is not sufficient to explain bacterial community structure variations. It has been reported that up to 66% of the community structure variations were left unexplained by environmental and geospatial factors (Xing, Hahn and Wu 2009; Lima-Mendez et al. 2015; Zhong et al. 2016; Zhou et al. 2018). Unexplained variations have been traditionally attributed to unmeasured environmental factors (Legendre et al. 2009; Lin et al. 2012; Stegen et al. 2013), while microbial interactions have recently been proposed to be an alternative explanation (Lima-Mendez et al. 2015; Zhou et al. 2018). Microbial interactions are a crucial part of the microbial deterministic selection process (Stegen et al. 2013). By selecting for or against certain microorganisms, microbial interactions thereby impose biotic filtering over community assembly. Network analysis is used to explore the mathematical, statistical and structural properties of co-occurring microbes in complex communities (Newman 2003; Barberan et al. 2012). The co-occurrence pattern-based network has been widely applied to explore the microbial interactions in soil and marine ecosystems (Lima-Mendez et al. 2015; Wang et al. 2018; Zhou et al. 2018).
The Tibetan Plateau hosts a large number of lakes with diverse salinity ranging from 0.1 to over 400 g/L (Yang et al. 2016), which therefore provides an ideal opportunity to examine the effect of salinity on the bacterial diversity, interactions and community structure of plateau lakes. As salinity has been reported to influence bacterial diversity and community structure, we hypothesised that salinity could also substantially influence bacterial interactions.
MATERIALS AND METHODS
Site description and sample collection
Due to logistical reasons, 25 lakes across the central Tibetan Plateau were investigated (Supplementary Table 1, Supplementary Fig. 1). The altitudes of the lakes investigated ranged from 4280 to 4856 m above sea level, and the salinity ranged from 0.14 to 118.07 g/L. Surface (top 30 cm) water samples were collected with a 2.5 L sampler in three replicates during July and August 2015. In the case of large lakes, two sampling points were chosen. Each water sample (1 L) was filtered onto a 47 mm sterile mixed cellulose esters membrane (Millipore, Billerica, MA, USA, 0.22 μm pore size) at 0.6 atm. The filters were frozen at -20°C and delivered to the laboratory in a cooler with ice bags and stored at -80°C until DNA extraction.
Measurement of physical and chemical parameters
Physicochemical parameters, including dissolved oxygen (mg/L), conductivity (μs/cm), total dissolved solids (mg/L), salinity (g/L), pH and oxidation-reduction potential, were recorded on site using a Professional Plus (Pro Plus) Multiparameter Instrument (YSI, Yellow Springs, OH, USA) on site. Based on the salinity, the lakes were grouped into freshwater lakes (<0.5 g/L), saline lakes (between 0.5 and 50 g/L), and hyper-saline lakes (>50 g/L, Por 1972). The average water temperature (°C) in the daytime of July and August 2015 was obtained from a published study (Wan et al. 2017). Lake water non-particulate organic carbon (NPOC) and total nitrogen (TN) were measured after filtering, using a total organic carbon analyser and total nitrogen measuring unit (Shimadzu, Okayama, Japan).
DNA extraction, PCR and high-throughput 16S rRNA gene sequencing
The frozen filters were cut into pieces and total DNA was extracted using a FastDNA® SPIN Kit for Soil (MP Biomedical, Santa Ana, CA, USA) following the manufacturer's instructions. The purity and concentration of the extracted DNA were estimated using a Nanodrop® ND-2000 UV-Vis Spectrophotometer (NanoDrop Technologies Inc., Wilmington, DE, USA). Universal primers 515F (5′-GTGCCAGCMGCCGCGGTAA-3′) and 909R (5′-GGACTACHVGGGTWTCTAAT-3′) with 12 nt unique barcodes were used to amplify the V4-V5 hyper-variable regions of the 16S rRNA gene (Tuan et al. 2014). The PCR mixture (25 μl) contained 1 x PCR buffer, 1.5 mM of MgCl2, 0.4 μM each of deoxynucleoside triphosphate bases, 1.0 μM of each primer, 0.5 U of Ex Taq (Takara, Dalian, Liaoning, China) and 20 ng of DNA template. The PCR amplification programme included an initial denaturation at 94°C for 3 min, followed by 30 cycles of 94°C for 20 s, 56°C for 30 s, and 72°C for 45 s, and a final extension at 72°C for 10 min. To minimise PCR batch-to-batch variations and maximise PCR product quantity, triplicate PCR reactions were conducted for each sample, and PCR products were pooled for purification using the OMEGA Gel Extraction Kit (Omega Bio-Tek, Norcross, GA, USA) following electrophoresis. PCR products from different samples were pooled in equal molar amounts, and then used for pair-end sequencing (2 × 250 bp) on an Illumina MiSeq sequencer at the Chengdu Institute of Biology, Chinese Academy of Sciences.
Data processing
Raw sequence data were processed using the MOTHUR pipeline (v. 1.34.3, Schloss et al. 2009). Paired-end reads were merged and quality-screened by removing any sequences with length <300 or >400 bp, more than one mismatch in the primer region, average quality <35, ambiguous bases >0 and homopolymer length >9 from subsequent downstream analysis. The remaining sequences were aligned against the Silva reference alignment (release 128), which was trimmed to include only the same region amplified, and those sequences that did not align were removed. Chimeric sequences were identified using UCHIME (Edgar et al. 2011) and removed. The remaining sequences were classified using the Bayesian classifier against the Silva database (release 128), with a minimum confidence score of 80% (Wang et al. 2007), and then unknown sequences were removed. Because this study's focus was limited to investigating the bacterial community, archaeal sequences were also removed. Finally, sequences were classified into operational taxonomic units (OTUs) at 97% identity and had singletons removed. The samples were rarefied to an even sequence depth of 10 983, which was the smallest sample size across the entire dataset. Alpha diversity indices (bacterial richness, Shannon diversity and Shannon evenness) were calculated using Mothur (Schloss et al. 2009).
Identification of core and indicative OTUs
Core OTUs were defined as the OTUs that occurred at least once in each lake, whereas the indicative OTUs were identified using the multipatt function in the ‘indicspecies’ package (De Caceres and Legendre 2009) under the R environment. Multipatt function calculates the IndVal index for every OTU and each lake group, and then the statistical significance of the relationship is tested using a permutation test. The OTU that had a significant association (P < 0.05) with each lake group was identified as an indicative OTU.
Transformation of environmental and geospatial factors
To improve the normality and reduce skewness of the measured environmental factors, highly correlated (Pearson correlation r > 0.9 or <-0.9) environmental factors were dereplicated, and then salinity, NPOC and TN were log-transformed, whereas water temperature was square-root transformed. The resulting environmental factors were further normalized (x—mean/standard derivation), thereby reducing the data to a consistent scale for multivariate analysis. The geographical distances between sampling points were calculated based on their GPS coordinates. This geographical distance matrix was converted to a set of geospatial factors (Principal Coordinates of Neighbour Matrices, PCNM) using the ‘pcnm’ function in the VEGAN package under the R environment (Borcard and Legendre 2002).
Statistical analysis
The bacterial community structure differences of the core, indicative and the entire bacterial communities were quantified using the Bray-Curtis dissimilarity metric, calculated using the square-root transformed OTU abundance-by-sample matrix. Significant differences in the bacterial community structure were analysed using the permutational analysis of variance (PERMANOVA, Legendre and Anderson 1999). Then distance-based redundancy analysis (dbRDA) ordination plots were used to visualise the associations between bacterial community structure and the measured environmental/geospatial factors (Legendre and Anderson 1999). Furthermore, the proportion of community structure differences in the freshwater, saline, hyper-saline, and across all lakes explained by the measured environmental and geospatial factors were estimated using the distance-based linear modelling (DistLM) with forward selection method (Legendre and Anderson 1999). The quality of the fit was evaluated using adjusted R2 selection criterion, which took into account the number of variables in the model, as suggested by Clarke and Warwick (2006). The significance of the fit was tested using permutations (n = 999) allowing significance to a level of P = 0.001 to be reported. The PERMANOVA and multivariate analyses were performed using PRIMER 6 (Clarke and Warwick 2006). The sensitivities of the core and indicative OTUs to salinity changes were estimated using the Spearman correlation and were compared based on the absolute values of their Spearman's Rho.
Network analysis
The bacterial interactions were inferred using the co-occurrence network analysis. CoNet was used to construct co-occurrence networks for the freshwater, saline and hyper-saline lakes following the protocols described previously (Faust et al. 2012; Weiss et al. 2016) and visualised using Cytoscape (Shannon et al. 2003). In brief, distribution of all pair-wise scores was computed for each of five similarity measures (Kullback–Leibler and Bray-Curtis dissimilarities, Pearson and Spearman correlations, and mutual information), and the top 1000 positive and 1000 negative edges supported by all five measures were retained initially. Random edges were then identified using the permutation method. Specifically, 500 permutations (with renormalisation for correlation measures) and bootstrap scores were generated for each measurement and edge, following the ReBoot routine. The measure-specific P-value was then computed, and then measure-specific P-values were merged using Brown's method. After applying Benjamini–Hochberg's false discovery rate correction, edges with merged P-values below 0.05 were kept. Any edge for which the five measures did not agree on the interaction type (that is positive or negative) or whose initial interaction type contradicted the interaction type determined with the P-value was also discarded. Edges with scores outside the 95% confidence interval defined by the bootstrap distribution or not supported by all five measures were discarded as well. The co-presence or positive correlation relationships in the co-occurrence network were represented by positive Pearson or Spearman correlations, or the abundance distributions of two OTUs were significantly more similar than expected at random. The mutual exclusion or negative correlation relationships were represented by negative Pearson or Spearman correlations, or the abundance distributions of two OTUs were significantly more dissimilar than expected at random (Faust and Raes 2016). Network topologies were calculated in the R environment (http://www.r-project.org) using the ‘igraph’ package (Csardi and Nepusz 2006).
Data accessibility
The raw sequence reads generated from this study have been deposited in the National Center for Biotechnology Information (NCBI) Sequence Read Archive under the accession numbers SRR8156919-SRR8156996.
RESULTS
The influence of salinity on bacterial richness, diversity and taxonomic compositions
A total of 4825 OTUs were identified from the 3132 797 sequences retained, with 270 to 918 OTUs being detected per sample. Rarefaction curves of fresh, saline and hyper-saline lakes reached a plateau (Supplementary Fig. 2) with Good's coverage values ranging from 0.95 to 0.99, indicating that the majority of the bacterial community was captured. The bacterial richness (Fig. 1A), diversity (Fig. 1B) and evenness (Fig. 1C) linearly and significantly decreased with increasing salinity (Pearson correlation, all P < 0.05). Freshwater lakes exhibited the highest bacterial richness, while hyper-saline lakes exhibited the lowest richness, diversity and evenness (Dunn's test, all P < 0.05). However, the bacterial diversity and evenness were not significantly different between the freshwater and saline lake samples (Dunn's test, P = 0.056 and 0.178, respectively).
![Bacterial richness (operational taxonomic unit [OTU] number, A), Shannon diversity (B) and Shannon evenness (C) in lakes on the Tibetan Plateau. In general, all alpha-diversity indices negatively correlated with salinity. While hyper-saline lakes consistently exhibited the lowest alpha-diversity indices, the saline and freshwater lakes exhibited similar levels of community diversity and evenness based on Kruskal-Wallis one-way ANOVA. **P < 0.001. OTUs were defined at 97% identity.](https://oup.silverchair-cdn.com/oup/backfile/Content_public/Journal/femsec/95/12/10.1093_femsec_fiz190/3/m_fiz190fig1.jpeg?Expires=1749970823&Signature=WmJFwMjMVXobHROizD9tnnAaI6fyLtCsscBZdlTeqPNSaR35rgOzQi-ZVPbSaITz4PgceY6KjWSnVN6suCeUwM6UGLcpIWi5AiCZaJ1aNhtDSHLb~CNEWymr8vj4Dl6Z4-d9kV2TgS0a5~gIwcxXBU6XJk3HSh6fVvmlPKGTp64wFCa7eDS5qx9oXzHQugTzW9l-DYOKkk-GUtYslF1zD-ZT5yyIB9oP~M7USVJw3Kp9KOZKHh2D5lmgbJfYnr8R4-LSIQhZI~oZI1v4F49XP2hIbIUxNN91BDvenrK1n8KOyvrpW9K~m72nJ0aKn560nuajKcm34IDwdhmfFC6L7w__&Key-Pair-Id=APKAIE5G5CRDK6RD3PGA)
Bacterial richness (operational taxonomic unit [OTU] number, A), Shannon diversity (B) and Shannon evenness (C) in lakes on the Tibetan Plateau. In general, all alpha-diversity indices negatively correlated with salinity. While hyper-saline lakes consistently exhibited the lowest alpha-diversity indices, the saline and freshwater lakes exhibited similar levels of community diversity and evenness based on Kruskal-Wallis one-way ANOVA. **P < 0.001. OTUs were defined at 97% identity.
Nearly all retained sequences (99.97%) were classified at the phylum-level, with 32 bacterial phyla being detected across the entire dataset. Lakes of different salinity exhibited substantial differences in their taxonomic compositions (Fig. 2). Freshwater lakes demonstrated a significantly higher relative abundance of Alphaproteobacteria than the saline and hyper-saline lakes (Dunn's test, P < 0.05). By contrast, the relative abundance of Gammaproteobacteria and Bacteroidetes was significantly higher in the hyper-saline lakes compared with the freshwater and saline lakes (all P < 0.05). Lastly, the relative abundance of Cyanobacteria was significantly higher in the saline lakes than in the freshwater and hyper-saline lakes (Dunn's test, both P < 0.05).
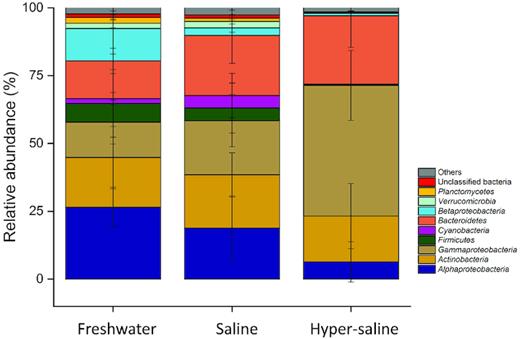
Bacterial taxonomic compositions in freshwater, saline and hyper-saline lakes on the Tibetan Plateau. The relative abundance of Alphaproteobacteria decreased with increasing salinity, whereas that of Gammaproteobacteria and Bacteroidetes followed the opposite trend.
The influence of salinity on bacterial co-occurrence network topologies
Bacterial interactions were inferred using co-occurrence network analysis. Significantly higher network complexity was observed in the hyper-saline lakes, with the total node number increasing from 164 in freshwater lakes to 223 in hyper-saline lakes (Table 1). Correspondingly, the total correlation number, including both positive (co-presence) and negative (mutual exclusion) correlations, gradually increased from 263 in freshwater lakes to 987 in hyper-saline lakes. Among the correlation relationships detected, the proportion of negative correlations increased from 10% in freshwater lakes to 43% in hyper-saline lakes. The average network connectivity increased from 1.6 in freshwater lakes to 4.43 in hyper-saline lakes, accompanying the reduction of average path length from 5.6 to 4.6.
Topological parameters of the bacterial networks in freshwater, saline and hyper-saline lakes.
| Topological property | Freshwater lakes | Saline lakes | Hyper-saline lakes |
|---|---|---|---|
| Total nodes | 164 | 176 | 223 |
| Total correlations | 263 | 341 | 987 |
| Positive correlations | 238 (90%) | 271 (79%) | 558 (57%) |
| Negative correlations | 25 (10%) | 70 (21%) | 429 (43%) |
| Average connectivity | 1.6 | 1.94 | 4.43 |
| Average path length | 5.62 | 4.76 | 4.62 |
| Average clustering coefficient | 0.48 | 0.3 | 0.49 |
| Modularity | 0.79 | 0.72 | 0.49 |
| Number of modules | 23 | 15 | 15 |
Among the correlation relationships identified, Bacteroidetes- and Actinobacteria-associated correlations consistently dominated the bacterial co-occurrence networks in the freshwater, saline and hyper-saline lakes (Fig. 3). By contrast, Alphaproteobacteria-associated correlations were only abundant in the network of freshwater lakes, while Gammaproteobacteria-associated correlations were more abundant in the networks of saline and hyper-saline lakes. Furthermore, there was an increased importance of salinity in the networks of saline and hyper-saline lakes compared with that of freshwater lakes (Fig. 4). Specifically, no significant correlation between salinity and OTU relative abundance was detected in the network of freshwater lakes, whereas such correlations were more abundant in the networks of saline and hyper-saline lakes. The correlations between salinity and OTUs were positive in the network of saline lakes, while those in the network of hyper-saline lakes were all negative. In addition to salinity, the importance of other measured environmental factors was also higher in the network of hyper-saline lakes than in the networks of freshwater and saline lakes. Significant correlations of OTU relative abundance with elevation, pH, water temperature, total nitrogen and dissolved oxygen were detected extensively in the network of hyper-saline lakes. The OTUs that exhibited positive correlations to these environmental factors were typically identified at higher relative abundance than those that did not.
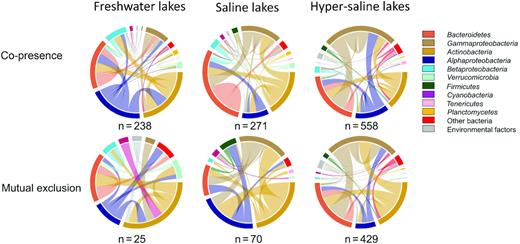
Taxonomic patterns within the co-occurrence network. Top seven interacting taxon groups and environmental factors depicted as coloured segments in a CIRCOS plot, in which ribbons connecting two segments indicate co-presence (top) and mutual exclusion links (bottom) in the freshwater, saline and hyper-saline lakes from left to right. n is the total number of co-presence and mutual exclusion links identified in the network of each lake group. Size of the ribbon is proportional to the number of correlations (positive and negative) between OTUs assigned to the respective segments.
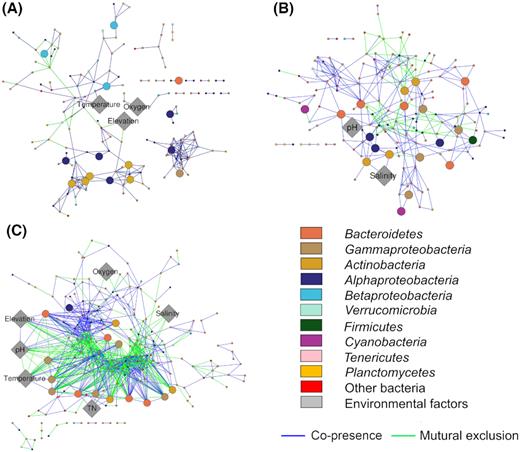
Bacterial co-occurrence networks in freshwater (A), saline (B) and hyper-saline (C) lakes. Dominant (average relative abundance > 0.1%) operational taxonomic units (OTUs, at 97% sequence identity) are coloured by taxonomic classifications. Co-presence relationships (or positive correlations) are coloured blue, while mutual exclusion relationships (or negative correlations) are green. Overall network complexity, especially negative correlations, increased with increasing salinity.
The influence of salinity on bacterial community structure
The results from the PERMANOVA analysis identified significantly different bacterial communities in the freshwater, saline and hyper-saline lakes (all P < 0.001), and db-RDA plots demonstrated that the bacterial community structure gradually shifted along with the increasing salinity (Fig. 5A). DistLM results further revealed that salinity was the most important environmental factor, explaining 12.6% of the community structure variations across all lakes (Table 2). However, a dominant influence of salinity was only observed in saline lakes, whereas water temperature and geospatial factors explained higher proportions of community structure variations in freshwater and hyper-saline lakes, respectively.
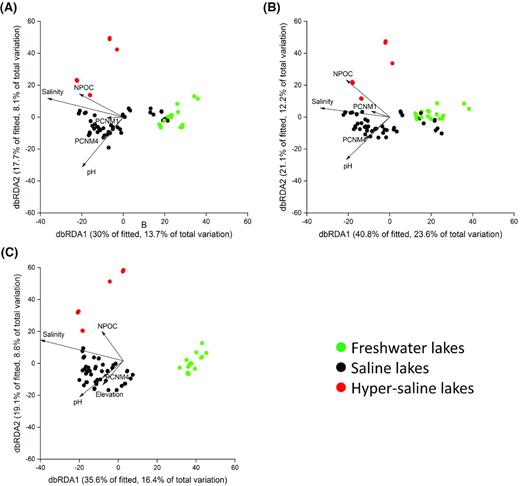
Bacterial community structure of the entire community (A), the core (B) and the indicative bacteria (C) and their driving factors based on distance-based redundancy analysis (db-RDA). Only the five most important environmental and geospatial factors are displayed. Salinity consistently explained the highest proportion of the community variations. Environmental factors with significant explanatory power are displayed. NPOC: non-particulate organic carbon; PCNM1–5: geospatial distance derived factors.
Environmental and spatial factors contributing to bacterial community variations based on distance-based linear modelling.
| All lakes (%) | Freshwater lakes (%) | Saline lakes (%) | Hyper-saline lakes (%) | |
|---|---|---|---|---|
| Salinity | 12.6 | 16.3 | 14.4 | 33.4 |
| pH | 6.5 | — | 7.2 | — |
| NPOC | 3.4 | — | 5.4 | — |
| Temperature | 3 | 20 | 4.1 | — |
| Elevation | 3 | — | 2.7 | — |
| Dissolved oxygen | 2.3 | — | 2.9 | — |
| TN | 1.2 | — | 2 | — |
| Total measured environmental factors | 32 | 36.3 | 38.7 | 33.4 |
| PCNM1 | 3.9 | — | 3.6 | — |
| PCNM2 | 1.8 | 8.8 | 3.7 | 46.8 |
| PCNM3 | 2.5 | — | 2.7 | — |
| PCNM4 | 4 | 11.8 | 3.2 | — |
| PCNM5 | 1.7 | — | 2.3 | — |
| Total geospatial factors | 13.9 | 20.6 | 15.5 | 46.8 |
| Total | 45.9 | 56.9 | 54.2 | 80.2 |
NPOC represents non-particulate organic carbon; PCNM1-5 are geospatial distance-derived geospatial factors; —indicates 0% of the community structure explained; total measured environmental factors include salinity, pH, NPOC, temperature, elevation, dissolved oxygen and TN; total geospatial factors include PCNM1-5.
The influence of salinity on the core and indicative bacterial subcommunities
We identified 113 OTUs (core OTUs) that were ubiquitous in all lakes, whereas 415, 16 and 165 OTUs were identified to be indicative of the freshwater, saline and hyper-saline lakes, respectively. The core OTUs were classified into nine phyla, but were predominately affiliated to Proteobacteria (48%), Bacteroidetes (30%) and Actinobacteria (13%, Supplementary Fig. 3). Indicative OTUs were also dominantly affiliated to the same three phyla as the core OTUs, but a diverse range of Planctomycetes OTUs were also indicative of the freshwater lakes.
Core OTUs dominated the bacterial community by accounting for 54.2%, 72.5% and 74.4% of the bacterial community by relative abundance in freshwater, saline and hyper-saline lakes, respectively. By comparison, freshwater lake indicative OTUs accounted for 28.8% of the freshwater bacterial community by relative abundance, whereas brackish and hyper-saline lake indicative OTUs accounted for 1.1% and 13.5% of the communities by relative abundance in brackish and hyper-saline lakes, respectively. The dbRDA ordination plots of the entire and core bacterial community were similar (Fig. 5A and B), whereas the indicative community better separated the freshwater and saline lake samples (Fig. 5C).
We performed correlation analysis to examine the sensitivity of core and indicative OTUs to salinity changes. Eighty-four percent of the indicative OTUs exhibited significant correlations between their relative abundance and salinity (Spearman correlation, significant at P < 0.05), 75% and 25% of which were negative and positive, respectively. By contrast, 68% of the core OTUs exhibited significant correlations between their relative abundance and salinity, with 73% and 27% negative and positive, respectively. Furthermore, the correlation strength (Spearman's Rho) of the indicative OTUs was significantly higher than that of core OTUs (Dunn's test, P = 0.005, Supplementary Fig. 4). The core OTUs, whose relative abundance positively correlated with salinity, were phylogenetically affiliated to Flavobacteriaceae and Rhodobacteraceae, whereas those that were negatively correlated with salinity were predominately classified as Flavobacteriaceae, Sporichthyaceae, Moraxellaceae and Sphingomonadaceae. By contrast, the relative abundance of indicative OTUs, which were predominately classified as Rhodobacteraceae, Ectothiorhodospiraceae, Microbacteriaceae and Nitriliruptoraceae, positively correlated with salinity, whereas the indicative OTUs classified as Planctomycetaceae, Chitinophagaceae, Sphingomonadaceae and Cytophagaceae correlated with salinity negatively.
DISCUSSION
Higher salinity increased bacterial co-occurrence network complexity
Currently, there is an increasing awareness of the importance of biotic contributions in shaping bacterial community structure (Weiss et al. 2016). It has been reported that community structure predictions based on biotic information are more accurate than those based on environmental factors (Lima-Mendez et al. 2015). Despite microbial interactions being difficult to measure and quantify, co-occurrence network analysis has been shown to be a good proxy for exploring the interactive effects of microorganisms (Barberan et al. 2012; Faust et al. 2012; Lima-Mendez et al. 2015; Weiss et al. 2016). The validity of using co-occurrence networks as an approximation for biotic interactions has also been confirmed by fluorescence microscopy (Lima-Mendez et al. 2015). In this study, 19.8–54.1% of the community structure variation was left unexplained by measured environmental and geospatial factors (Table 2), consistent with reports for oceans and lakes (Lima-Mendez et al. 2015; Zhong et al. 2016; Zhou et al. 2018). This suggests that biotic interactions potentially influence a substantial proportion of the bacterial community structure in the plateau lakes (Figs 3 and 4). Despite the importance of biotic interactions, our results also demonstrated that OTUs presented at high relative abundance typically correlated with an environmental factor in the network of hyper-saline lakes. Thus bacterial interactions may enhance bacterial tolerance to environmental changes, but do not overcome the influence of environmental filtering completely.
Our results clearly demonstrated that the topology of bacterial co-occurrence networks was heavily influenced by salinity. The network of hyper-saline lakes exhibited the highest number of correlations and a particularly higher proportion of negative correlations compared with freshwater and saline lakes (Table 2). Increased network complexity under environmental filtering has been reported to be a consequence of drought in grassland soils (Wang et al. 2018). However, drought increased positive correlations and co-occurrence network modularity, reflecting enhanced bacterial collaboration and niche-differentiation (Wang and Or 2013). This is in contrast to the enhanced negative correlations and reduced modularity observed in the present study (Table 2). We propose that this could be due to the fluidity differences of soil and water. The free-diffusion of nutrients and salts in lake water prevents niche-differentiation observed in soils. This possible explanation is in agreement with the coexistence theory, which suggests that high nutrient fluxes in well-connected habitats support the expression of competitive advantage and lead to exclusion of inferior species (Adler, HilleRisLambers and Levine 2007). This is supported by the lower bacterial richness, diversity and evenness observed in the hyper-saline lakes (Fig. 1) and the finding that OTUs with high relative abundance were positively correlated with environmental factors (Fig. 3).
Salinity influenced co-presence and mutual exclusion relationship dynamics
Positive correlations were substantial components in the networks of freshwater, saline and hyper-saline lakes (Figs 3 and 4). These relationships could be used to infer commensal, mutualistic, obligate syntrophic and parasitic relationships between bacterial species (Weiss et al. 2016). The number of co-presence relationships was substantially higher in the network of hyper-saline lakes than that of freshwater and saline lakes. This may suggest that the halotolerant or halophilic bacteria in the hyper-saline lakes responded to salinity changes with similar trends. The increased positive correlations coincided with the increased negative correlations (Table 1), and the negative correlations increased by a higher extent. The dynamics between positive and negative correlation relationships between microorganisms are complex, and have been reported to be dependent on resource availability (Zhao et al. 2016). It was proposed that the relationship between microorganisms occupying a similar ecological niche could change from commensalism (positive correlations) to competition (negative correlations) when nutrients become limited. Thus reduced ecological niche differentiation could also enhance co-presence relationships when nutrients are not limited, as observed in these Tibetan hyper-saline lakes (Yue et al. 2019).
Positive correlations between OTU relative abundance and salinity were only observed in the network of saline lakes, whereas those in the hyper-saline lakes were predominately negative (Fig. 4). This suggests that the influence of salinity is predominately inhibitory at high salinity, and that the competitive advantage of halotolerant and halophilic OTUs is the strongest in mesophilic environments with the freshwater species being forced into dormancy or reduced abundance (Aanderud et al. 2016). This is in contrast to the hyper-saline condition, where salinity tolerance is an essential functional trait for bacteria to survive, and intolerant species are absent due to an inability to maintain dormancy under such extreme salinity. Furthermore, the dominance of negative correlations with salinity in the network of hyper-saline lakes could be due to the gap between the salinity tolerance threshold and optimum growth salinity of halotolerant and halophilic bacteria. Typically, the optimum growth salinity is lower than the salinity threshold (Krieg et al. 2010), thus further increases in salinity beyond the optimum growth level will ultimately lead to inhibitory effects, as observed in the hyper-saline lakes.
Salinity shapes bacterial diversity in plateau lake waters
Our results confirm that salinity significantly reduces bacterial richness, diversity and evenness across a large salinity scale (Fig 1, Casamayor et al. 2002; Langenheder et al. 2003; Herlemann et al. 2011; Liu et al. 2013; Zhong et al. 2016). The negative correlations between salinity and bacterial community alpha-diversity indices were consistent with the ecological principle that more extreme environments are expected to be inhabited by less diverse microbes (Gaston 2000; Zhong et al. 2016). However, the influence of salinity on bacterial diversity could be scale-dependent, as certain saline lakes exhibited a similar or even higher level of bacterial diversity compared with freshwater lakes, and the highest bacterial diversity was also identified in the saline lakes (Fig. 1). This partially supports the highly debated intermediate-disturbance hypothesis (Fox 2013), which suggests that an ecosystem under mild disturbance would have maximal community diversity. Increased bacterial diversity with increasing salinity has been reported previously (Hewson and Fuhrman 2004; Wang et al. 2011; Zhong et al. 2016;). This has been attributed to increased nutrients and resources, or as a consequence of increased niche availability for both halotolerant and freshwater bacteria at an intermediate level of salinity (Wang et al. 2011).
The influence of salinity on bacterial community structure is scale-dependent
Our results revealed substantial influence of environmental filtering on community structure variations, with 32% of community variation explained by measured environmental factors across all lakes (Table 2). Within the proportion of community structure explained by measured environmental factors, 12.6% was attributed to salinity, therefore confirming the importance of salinity in shaping bacterial community structure in plateau lakes. However, for bacterial communities within a narrow salinity range (such as freshwater lakes) or adapted to the high salinity condition (hyper-saline lakes), alternative environmental (water temperature) or geospatial factors explained higher proportions of community structure variations than salinity. Therefore, it is crucial to differentiate the global and local distribution patterns when predicting the influence of salinity on bacterial communities in aquatic ecosystems. The influence of temperature on arctic (Adams, Crump and Kling 2010) or freshwater lakes (Lindström et al. 2005) has been reported previously. Its influence on bacterial community structure has been proposed to be caused by differences in enzyme temperature sensitivity, autotrophic productivity and bacterial adaptation strategies. For hyper-saline lakes, the importance of geospatial factors in shaping bacterial community structure suggests that community assembly could be the result of dispersal limitation and stochastic speciation. Alternatively, unmeasured environmental factors that co-vary with geographical distance could also substantially influence the bacterial community structure (Stegen et al. 2015).
Core and indicative bacteria responded to salinity differentially
Our results revealed distinct responses of core and indicative OTUs to salinity. It has been reported that a small fraction of bacterial taxa carry specific functional traits, allowing them to dominate global terrestrial ecosystems (Delgado-Baquerizo et al. 2018). By contrast, the majority of the bacteria occurs only sporadically, and at a much lower abundance in ecosystems (Pester et al. 2010). The core OTUs were typically generalist (Comte et al. 2014), and capable of surviving a large salinity gradient from 0.14 to 109 g/L. This was confirmed by the weaker correlations between their relative abundance and salinity compared with the indicative OTUs, thereby further confirming their high tolerance to a wide range of salinity. In contrast to the core OTUs, the relative abundance of indicative OTUs correlated with salinity more strongly, thus suggesting their much weaker salinity tolerance.
Flavobacteriaceae and Rhodobacteraceae have been reported to exhibit high salt tolerance in soil (Rath et al. 2019) and estuaries (Campbell and Kirchman 2013). These generic bacterial lineages are typically considered as organic compound degraders (Krieg et al. 2010), and thus are potentially involved in carbon and nitrogen catabolism across Tibetan lakes. By contrast, the indicative OTUs positively correlated with salinity were predominately classified as Ectothiorhodospiraceae and Nitriliruptoraceae. These lineages are known to perform unique metabolic functions such as anoxygenic photosynthesis (Thiel et al. 2010) and nitrile degradation (Aanderud et al. 2016), respectively. Thus, this suggests that crucial metabolic functions were performed by halophilic taxa in hyper-saline lakes instead of a complete loss-of-function due to the salinity intolerance of freshwater and mesohalophilic species (such as Cyanobacteria).
CONCLUSIONS
Our results confirm the dominant role of salinity in determining bacterial diversity in plateau lakes, and the variable response of different bacterial lineages to salinity. Enhanced environmental filtering with increased salinity potentially greatly impacted biotic interaction patterns with enhanced co-occurrence network complexity. Compared with terrestrial ecosystems, our results suggest that while the overall effects of environmental pressures on community structure can be similar, the underlying mechanisms can differ, thus requiring careful investigation. Further studies may be needed to explore the nature of enhanced bacterial competition in hyper-saline lakes.
ACKNOWLEDGEMENTS
This study was supported by the Chinese Academy of Sciences (XDA19070304, QYZDB-SSW-DQC033 and XDB15010203), National Natural Science Foundation of China (41771303), China Postdoctoral Science Foundation (2018M630211).
ETHICAL APPROVAL
This article does not contain any studies with human participants or animals performed by any of the authors.
Conflicts of interest. None declared.
