


ABSTRACT
The objective of the study was to evaluate changes in microbial communities with the predicted arrival of new species to Mediterranean forests under projected intensification of water stress conditions. For that, litter from three Mediterranean forests dominated respectively by Quercus pubescens Willd., Quercus ilex L. and Pinus halepensis Mill. were collected, and placed to their ‘home’ forest but also to the two other forests under natural and amplified drought conditions (i.e. rainfall reduction of 30%). Quantitative PCR showed that overall, actinobacteria and total bacteria were more abundant in Q. pubescens and Q. ilex than in P. halepensis litter. However, the abundance of both groups was dependent on the forest sites: placement of allochthonous litter to Q. pubescens and P. halepensis forests (i.e. P. halepensis and Q. pubescens, respectively) increased bacterial and fungal abundances, while no effect was observed in Q. ilex forest. P. halepensis litter in Q. pubescens and Q. ilex forests significantly reduced actinobacteria (A/F) and total bacteria (B/F) to fungi ratios. The reduction of rainfall did not influence actinobacteria and bacteria but caused an increase of fungi. As a result, a reduction of A/F ratio is expected with the plant community change towards the dominance of spreading P. halepensis under amplified drought conditions.
INTRODUCTION
Microorganisms are key actors in nutrient cycling and carbon turnover during litter decomposition (Gessner et al. 2010; Garcia-Pausas and Paterson 2011). At a global scale, it is estimated that the soil C coming from soil microbial biomass is about 16.7 Pg C, which represents approximately 2.3–2.4% of total organic C found in soil in the top 30 cm (Xu, Thornton and Post 2013). Heterotrophic respiration resulting from microbial litter decomposing activity can account for 10–90% of the CO2 efflux from soils and substantially affect the atmospheric CO2 concentration (Manzoni et al. 2012). However, annual reduction of rainfall by up to 30% predicted for the Mediterranean basin (Giorgi and Lionello 2008; IPCC 2014; Hertig and Tramblay 2017) may significantly impact microbial abundance and structure, and thus, also the overall C dynamics (Wardle and Putten 2002).
Studies have already demonstrated shifts in plant community composition in response to the changed climatic conditions (Morales et al. 2007; Bertrand et al. 2011; Guiot and Cramer 2016). In southern France, dominating downy oak (Quercus pubescens Willd.) is expected to be replaced by more drought tolerant species: the sclerophylls’ evergreen holm oak (Quercus ilex L.) and Aleppo pine (Pinus halepensis Mill.) (Barbero et al. 1990; Fortunel et al. 2009). Additionally, the increase of water stress may induce the synthesis of plant secondary metabolites (e.g. phenolics) known for their phytotoxic activities and anti-appetizing effects, which limit leaf consumption by fauna (Chomel et al. 2014). This investment in defence mechanisms over primary metabolic processes may result on the one hand to the decrease of primary productivity (Ogaya and Peñuelas 2007) and thus litter inputs, and on the other hand, in the reduction of litter quality through the increase of recalcitrant organic compounds (i.e. lignin, wax, polyphenolics) (Ormeño et al. 2006; Hättenschwiler and Jørgensen 2010; Sagova-Mareckova et al. 2011). Moreover, the reduction of moisture level may induce physiological stress and limit dispersal of microorganisms, enzymatic activities and substrate diffusion (Bouskill et al. 2013). Thus, the reduction of moisture levels and aboveground litter quality and quantity may impose new community dynamics belowground (Lunghini et al. 2013; Cleveland et al. 2014) and lead to a shift of soil microbial communities to more drought tolerant species, capable of using recalcitrant C sources and resistant to desiccation (Yuste et al. 2011; Peñuelas et al. 2012; Allison et al. 2013). Actinobacteria are known to thrive in low resource environments (Fierer, Bradford and Jackson 2007) and low soil moisture conditions (Yuste et al. 2011; De Vries and Shade 2013; Acosta-Martinez et al. 2014) reaching high abundance in arid soils (Okoro et al. 2009). They are well protected by a strong, thick interlinked peptidoglycan cell wall, which explains their high resistance to low osmotic potential conditions (Davet 2004). They produce enzymes able to degrade a wide range of biopolymers, whose building blocks including aromatic compounds (McCarthy and Williams 1992) have a vital role in organic matter turnover and humus formations (Anandan, Dharumadurai and Manogaran 2016). They produce a variety of secondary metabolites (Anandan et al. 2016), through which they interact with other microbial groups (Lewin et al. 2016). However, little is known about how microbial communities and actinobacteria in particular, would be affected by future reduction of rainfall, both directly by decrease of moisture level and indirectly through the plant species shift. In general, litter types sharing a common history with local microbial communities (autochthonous) have faster decomposition rates than litter types coming from distant (allochthonous) habitats (Gholz et al. 2000; Strickland et al. 2009). Consequently, changes in biochemical composition of local litter with the arrival of new species may constrain microbial activity and impact negatively litter decomposition (Schimel, Balser and Wallenstein 2007).
In here, we examine how reduction of rainfall and change in plant species may affect belowground microbial community's (actinobacteria, fungi and total bacteria) abundance and structure and consequently also the litter decomposition process. For that, we performed a litter transplanting experiment between three main Mediterranean forests (Q. pubescens Willd., Q. ilex L., and P. halepensis Mill.) occurring in Southeast of France, under natural and amplified drought conditions for simulating the 30% rainfall reduction. We hypothesised that the arrival of new litter under amplified drought conditions will have a negative impact on microbial abundance and litter decomposition.
MATERIALS AND METHODS
Sites description
This study was conducted at the three forest sites in the Mediterranean region in southern France: the Q. pubescens forest at Oak Observatory at the ‘Observatoire de Haute Provence’ (O3HP; Santonja et al. 2015a), the Q. ilex forest at Puéchabon (Limousin et al. 2008) and the mixed P. halepensis forest at Font-Blanche (Table 1). During the study period, the mean annual temperature was 12.1°C, 13.7°C and 14.0°C, and the cumulative annual precipitation was 609 mm, 794 mm and 632 mm, respectively (Table 1; Supplementary Figure 1, Supporting Information). There were no significant differences between sites in the mean annual temperature and cumulative annual precipitation during the study period (One-way ANOVA, P < 0.05). Each site included a control plot (natural drought—ND) and a rain exclusion plot (amplified drought—AD) to mimic the future reduction of rainfall predicted by the climatic model for the Mediterranean Region (about -30% yearly; Table 1 and Supplementary Figure 2, Supporting Information).
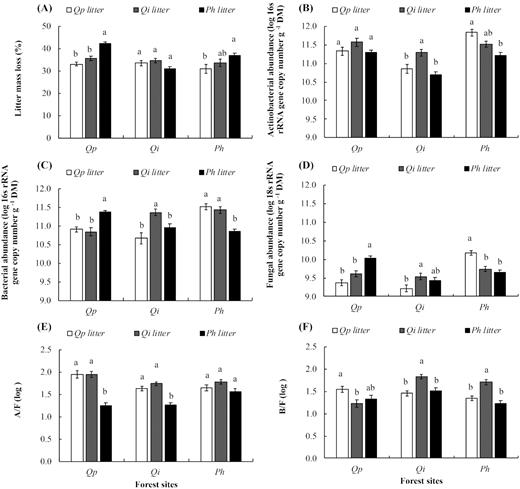
Leaf litter mass loss (A) and associated leaf litter microbial decomposers abundances (actinobacteria (B), bacteria (C), fungi (D)), actinobacteria to fungi (E) and bacteria to fungi (F) ratios, for the three forests and litter species (control and amplified drought conditions were combined). Values are mean ± SE (n = 14). Different letters denote significant differences between litter species within forest sites (e.g. both drought conditions combined), with a > b > c. DM = litter dry mass. Qp = Q. pubescens, Qi = Q. ilex, Ph = P. halepensis.
Main characteristics of the three forest sites selected for this study (for the study period: December 2014 to December 2015).
| Forests | Q. pubescens Willd. | Q. ilex L. | Mixed P. halepensis Mill. |
|---|---|---|---|
| Sites | Oak Observatory at the Observatoire de Haute Provence | Puéchabon | Font-Blanche |
| Location | 430 56' 115'' N, 050 42' 642'' E | 43° 44' 29''N, 3°35' 45''E | 43°14'27'' N, 5°40'45'' E |
| Altitude a.s.l. (m) | 650 | 270 | 425 |
| MAT (Mean Annual Temperature) (°C) | 12.25 | 13.71 | 14.01 |
| MAP (Mean Annual Precipitation) (mm) | 609 | 794 | 632 |
| Soil type | pierric calcosol | rhodo-chromic luvisol | leptosol |
| Soil texture | clay | clay loam | clay |
| Soil pH | 6.76 | 6.6 | 6.8 |
| Surface rocks cover (%) | 23 | 75 | 50 |
| Dominant tree species | Q. pubescens Willd. | Q. ilexL. | mixed P. halepensis Mill./Q. ilex L. |
| Other dominant plant species | Acer monspessulanum L | Buxus sempervirensL. | Quercus coccifera L. |
| Cotinus coggygria Scop. | Phyllirea latifolial L. | Phyllirea latifoliaL. | |
| Pistacia terebinthus L. | |||
| Juniperus oxycedrus L. | |||
| Tree density (stems/ ha) | 3503 | 4500 | 3368 |
| Forest structure | even-age (70 years) | even-age (74 years) | uneven-age (61 years) |
| Rain exclusion system dimensions (m2) | 300 | 140 | 625 |
| Rain exclusion (%) | 33 | 30 | 30 |
Experimental design and sample processing
In 2014, senescent leaves were collected in the control plot of the three forests. For that, litter traps were used during the abscission period that occurred from October to November for the broadleaves (Q. ilex and Q. pubescens) and from June to September for the needles (P. halepensis). Leaves and needles were air dried and stored at room temperature in paper boxes until the beginning of the experiment.
Litter decomposition was assessed by using the litter bag method (Swift et al. 1979). Four-mm mesh litter bags (20 × 20 cm) containing 10 g (air-dried) of the senescent material were used to perform the experiment. Litter transplants were made between each site for the three species considered, i.e. a litter bag containing the litter of each species placed on each forest site, under two drought conditions: natural (ND) and amplified (AD) (see Supplementary Figure 3, Supporting Information).
Thus, the experiment consisted in 18 modalities corresponding to the 3 forests Q. ilex, Q. pubescens and P. halepensis) × 3 plant species (Q. ilex, Q. pubescens and P. halepensis) × 2 drought conditions (ND and AD). In total, 126 litter bags (18 modalities × 1 sampling date × 7 replicates) were analysed. Litter bags were placed perpendicularly to the gutters system in Aleppo pine and holm oak forests and under the rain exclusion device in the downy oak forest, by using a transect in blocks (7 columns x 6 lines), equidistantly one from each other (1 m distance between the 7 columns and 0.6 m between the 6 lines). Transects were E-W oriented. They were disposed in the ground floor after the removal of litter layer and fixed to the soil with galvanised nails to prevent movement by animals or wind. Litter layer was then replaced over the litterbags.
Litter bags were retrieved after 1 year (December 2015). Litterbags were placed in zipped plastic bags to prevent the loss of biological material. In the laboratory, the soil and other debris were removed from the litter bags. Then, they were freeze-dried (Lyovac GT2) for 72 hours and the remaining dry mass (%) was calculated. A 1 g of dry mass aliquote was collected, grounded to powder (Retsch® MM400, 30 Hz during 30s) and kept at -20°C for posteriori microbial DNA analysis.
Initial litter chemical characteristics
At the beginning of the experiment, 5 replicates from each leaf species collected from trees in control plots were grounded to powder (Retsch® MM400, 30 Hz during 30s). Carbon (C) and nitrogen (N) were determined by thermal combustion on a Flash EA 1112 series C/N elemental analyser (Thermo-Scientific, U.S.A). Phosphorus (P) and cations (Ca, K, Mg and Na) were extracted from 80 mg of ground litter sample with 8 ml of nitric acid and 2 ml of H2O2 at 175°C for 40 min using a microwave digestion system (Ethos One, Milestone SRL, Sorisole, Italy). After the mineralisation, each sample was adjusted to 50 ml with demineralised water. Phosphorus concentration was measured at 720 nm using a microplate reader (Victor, Perkin Elmer, Waltham, MA, USA). Cations were determined using an atom absorption spectrometer (AAS, iCE 3000 series, Thermo-Scientific, China). Leaf structural compounds (lignin, cellulose and hemicellulose) and water-soluble compounds (WSC) concentrations were determined according to the van Soest extraction protocol (Van Soest and Wine 1967), using a fiber analyser (Fibersac 24; Ankom®, Macedon, NJ, USA). Total phenolic concentrations were measured by colorimetry according to the method of Peñuelas et al. (1996) using gallic acid as standard. Aqueous extracts were made by dissolving 0.25 g of litter powder in 20 ml of 70% aqueous methanol solution with shaking for 1 hour and filtered (0.45 μm). A total of 25 ml of extracts obtained were then mixed with 0.25 ml of Folin-Ciocalteu reagent (Folin and Denis 1915), 0.5 ml of saturated aqueous Na2CO3 (to stabilize the colorimetric reaction) and 4 ml of distilled water. After 60 min, the reaction was completed and the concentration of phenolics was measured at 765 nm using a UV / Vis spectrophotometer (Thermoscientific, U.S.A.).
To determine the water holding capacity (WHC), twenty-one freshly abscised leaves (3 species x 5 replicates) were soaked in distilled water for 24 hours, drained and weighted (wet weight). The dry weight was measured after drying the samples for 48 hours at 60°C. Water holding capacity (in %) was calculated according to the formula: (wet weight/dry weight) × 100 (Santonja et al. 2015b). Specific leaf area (SLA) was determined by using the Image J software (https://imagej.nih.gov/ij/, MA, USA). Specific leaf area was calculated as the ratio between leaf area and leaf dry weight.
DNA extraction
Environmental DNA from leaf litter samples was extracted with the NucleoSpin® soil kit (Macherey-Nagel, Düren, Germany), following the standard protocol with a slight adjustment. In brief, approximately 250 mg of dry litter was added to the NucleoSpin Bead tubes. Lysis conditions were performed by using buffer SL1 (700 µl, vortex for 5 min, room temperature, 11 000 x g for 2 min), and buffer SL3 (150µl, vortex 5 min, 0–4°C, 14 000 g for 1 min). This procedure was repeated twice using the same sample to optimise the DNA extraction. The filtration of the supernatant was performed in the NucleoSpin Inhibitor Removal Column followed by 11 000 x g for 1 min. DNA binding was done in the Nucleo Spin Soil column after adding 250 µl of Buffer SB to the supernatant followed by 11 000 x g for 1 min. A series of successive DNA washing was performed: 500 µl buffer SB (11 000 x g, 3 sec), 550 µl buffer SW1 (11 000 xg, 3 sec), 700 µl SW2 (2 sec vortex, 11 000 x g, 3 sec). At each step, flow-through were discarded. Finally, DNA was eluted in 30 µl of Buffer SE followed by incubation at room temperature for 1 min and 11 000 x g for 30 seconds and kept at -20°C until further analysis. DNA quantification was performed in the ND-1000 spectrophotometer (Nanodrop Technology, Wilmington, DE).
Quantitative real-time PCR analysis
Abundances of total bacteria, actinobacteria and fungi were assessed using a quantitative real-time PCR analysis (qPCR) method. Microbial abundance was quantified as copy number of a target gene. Partial 16S rRNA gene sequences were amplified from the total bacteria using primers COM1 (5′–CAGCAGCCGCGGTAATAC–3′) and 769R (5′–ATCCTGTTTGMTMCCCVCRC–3′, annealing temperature 59°C) (Dorn-In et al. 2015), and from actinobacteria using primers S-P-Acti-1154-a-S-19 (5′–GRDACYGCCGGGGTYAACT–3′ annealing temperature 59°C) and S-P-Acti-1339-a-A-18 (5′–TCWGCGATTACTAGCGAC–3′) (Pfeiffer et al. 2014). Partial 18S rRNA genes from fungi were amplified with primers FF390 (5′–CGATAACGAACGAGACCT-3′) and FR1 (5′–AICCATTCAATCGGTAIT-3′, annealing temperature 50°C) (Vainio and Hantula 2000). All PCR reactions were done 15 µl total volume containing 1 × SYBR® Green Gotaq PCR Master Mix (Promega), primers at 600 nM for total bacteria and fungi, and 200 nM for actinobacteria, and 0.2–2 ng environmental DNA. The cycling parameters were: 10 min at 95°C followed by 45 cycles at 95°C (15 sec), 59°C (30 sec), 72°C (30 sec). Melting curves were recorded to ensure qPCR specificity, and gel electrophoresis analyses were performed to confirm the expected size of amplified products. All qPCR reactions were run in triplicate on StepOne Plus Real-Time PCR System (Applied Biosystems, Foster City, CA). To quantify the target gene copy numbers, standard dilution curves of known concentrations of previously cloned standards of the target genes were determined. Baseline and threshold calculations and data analysis were performed with the StepOne v. 2.2.2 software.
The primer pair recommended by Dorn-In et al. (2015) for amplification of bacterial 16S rRNA gene fragment from plant samples, Com1/769R (Rastogi et al. 2010; Fredriksson, Hermansson and Wilén 2013) was used for quantitative real-time PCR analysis of the total bacteria. The primer pair does not amplify 16 rRNA genes from chloroplasts, however, consequently also its coverage of the domain Bacteria is incomplete. In silico analysis using TestPrime 1.0 (Klindworth et al. 2013) against the Silva database, release 132 (www.arb-silva.de), showed 75% overall coverage of Bacteria with varying representation of the phyla, e.g. 88% Proteobacteria, 81.9% Firmicutes, 93.6% Bacteroidetes, but only 56.2% Actinobacteria, 20.5% Acidobacteria and 17.5% Verrucomicrobia. Therefore, the results can be used as a proxy of bacterial abundance when comparing between samples, but not to compare with qPCR quantification of individual bacterial phyla or lower taxonomic units using group-specific primers.
Statistical analysis
All statistical analyses were performed in R v.3.1.3 software (R Development Core Team 2017). One-way analysis of variance (ANOVA) was used to determine differences between the initial parameters of litter plant species and between forest sites for each litter species and microbial group. Three-way ANOVA was also used to test the effects of forest sites (S), litter species (L) and drought treatment (D) on litter mass loss and microbial abundance (total bacteria (B), actinobacteria (A), fungi (F) and the respective B/F and A/F ratios, followed by post-hoc Tukey tests. Microbial abundance was log-transformed to fit the assumption of normality and homoscedasticity.
RESULTS
Initial litter composition
Initial litter characteristics varied significantly among species (Table 2, One-way ANOVA, P < 0.05). Quercus ilex showed a significantly higher N (9.62 mg g−1) and P (3.48 mg g−1) contents than the two other species, particularly P. halepensis (5.36 mg g−1 and 1.56 mg g−1), which resulted in a lowest C/N and C/P ratio for Q. ilex and highest ratios for P. halepensis (Table 2). Regarding the cations, Q. pubescens showed significantly higher content of Ca (32.90 mg g−1) and Mg (2.83 mg g−1), and lower content of K (0.84 mg g−1) and Na (0.04 mg g−1) than the two other species. Concerning the structural compounds of the leaves, Q. ilex had higher lignin (337.38 mg g−1) and cellulose content (204.99 mg g−1) than the two other species. Finally, Q. pubescens showed higher total phenolics content compared to Q. ilex, and the highest specific leaf area (133.13 mg g−1) and water holding capacity (146.90 mg g−1). Pinus halepensis showed higher water-soluble compounds (340.02 mg g−1) and lower water holding capacity (113.89 mg g−1).
Initial leaf litter quality of each litter species: Q. pubescens, Q. ilex and P. halepensis, the values are mean ± SE (n = 5) and the results of the one-way ANOVA to test differences between initial litter species are indicated (* P < 0.05, ** P < 0.01, *** P < 0.001 and different letters denote significant differences among species with a>b>c.)
| df | Q. pubescens | Q. ilex | P. halepensis | F-ratio | |||||
|---|---|---|---|---|---|---|---|---|---|
| Carbon | 2 | 462.6 ± 2.65 | c | 478.1 ± 1.4 | b | 516.1 ± 1.6 | a | 198.80 | *** |
| Nitrogen | 2 | 6.4 ± 0.2 | b | 9.6 ± 0.2 | a | 5.4 ± 0.1 | c | 146.30 | *** |
| Phosphorus | 2 | 1.9 ± 0.1 | b | 3.5 ± 0.2 | a | 1.6 ± 0.1 | b | 64.6 | *** |
| Calcium | 2 | 32.9 ± 0.8 | a | 25.1 ± 0.6 | b | 18.4 ± 0.2 | c | 168.1 | *** |
| Potassium | 2 | 0.8 ± 0.01 | c | 1.8 ± 0.1 | a | 0.95 ± 0.01 | b | 370.7 | *** |
| Magnesium | 2 | 2.8 ± 0.2 | a | 1.4 ± 0.01 | b | 1.5 ± 0.02 | c | 104.8 | *** |
| Sodium | 2 | 0.04 ± 0.00 | b | 0.11 ± 0.00 | a | 0.11 ± 0.00 | a | 149.6 | *** |
| Total phenolics | 2 | 40.8 ± 2.6 | a | 32.9 ± 1.58 | b | 38.6 ± 1.2 | ab | 4.7 | * |
| Lignin | 2 | 273.3 ± 9.0 | b | 337.4 ± 5.5 | a | 302.6 ± 10.6 | b | 13.8 | *** |
| Cellulose | 2 | 159.1 ± 8.0 | b | 205 ± 4.2 | a | 150.8 ± 12.9 | b | 10.3 | ** |
| Hemicellulose | 2 | 274.2 ± 22.5 | a | 270.0 ± 16.2 | ab | 206.6 ± 10.4 | b | 4.7 | * |
| Water-soluble compounds | 2 | 293.4 ± 12.1 | b | 187.6 ± 10.2 | c | 340.0 ± 7.1 | a | 60.9 | *** |
| Specific leaf area | 2 | 133.1 ± 0.4 | a | 51.5 ± 0.9 | c | 83.5 ± 2.2 | b | 690.7 | *** |
| Water holding capacity | 2 | 146.9 ± 1.0 | a | 137.2 ± 1.0 | b | 113.9 ± 1.03 | c | 285.5 | *** |
Litter mass loss
After 357 days of decomposition, litter mass loss was statistically different among sites and plant species with interaction effects (Table 3). On average, significantly higher mass loss occurred at Q. pubescens forest (36.94%) in comparison with Q. ilex forest (33.88%) and P. halepensis forest (33.80%). Regarding the litter, P. halepensis (36.81%) and Q. ilex (35.07%) lost significantly higher mass than Q. pubescens (32.72%). Concerning interactions, P. halepensis lost most of its mass at Q. pubescens and P. halepensis forests compared to the Q. ilex forest (Fig. 1A). No significant effect of rain exclusion was found on the litter mass loss (Table 3).
ANOVA table of F-Ratio and P-values for the effects of forest sites (S), litter species (L) and drought conditions (D) on the mass loss, microbial biomass (actinobacteria, bacteria and fungi) and actinobacteria/fungi (A/F) and bacteria/fungi (B/F) ratios.
| Mass loss | Actino (A) | Bacteria (B) | Fungi (F) | A/F | B/F | ||||||||
|---|---|---|---|---|---|---|---|---|---|---|---|---|---|
| df | F | P | F | P | F | P | F | P | F | P | F | P | |
| Sites (S) | 2 | 8.81 | 0.0008 | 33.92 | <0.0001 | 8.86 | 0.0003 | 30.38 | <0.0001 | 6.11 | 0.0030 | 11.78 | <0.0001 |
| Litter species (L) | 2 | 8.11 | 0.0022 | 16.31 | <0.0001 | 4.58 | 0.0122 | 2.41 | 0.0945 | 53.55 | <0.0001 | 11.34 | <0.0001 |
| Drought (D) | 1 | 3.70 | 0.0571 | 0.09 | 0.7602 | 1.91 | 0.1688 | 6.20 | 0.0143 | 12.08 | 0.0007 | 11.70 | 0.2828 |
| SxL | 4 | 7.03 | <0.0001 | 5.69 | 0.0003 | 20.56 | <0.0001 | 21.01 | <0.0001 | 7.67 | <0.0001 | 11.49 | <0.0001 |
| SxD | 2 | 0.43 | 0.6488 | 3.00 | 0.0539 | 7.25 | 0.0011 | 3.82 | 0.0251 | 0.18 | 0.8368 | 5.43 | 0.0056 |
| LxD | 2 | 0.14 | 0.8724 | 3.83 | 0.0246 | 1.36 | 0.2593 | 1.12 | 0.3313 | 3.34 | 0.0392 | 0.11 | 0.8973 |
| SxLxD | 4 | 0.10 | 0.9839 | 1.11 | 0.3540 | 2.72 | 0.0335 | 1.45 | 0.2229 | 2.12 | 0.0836 | 1.17 | 0.3293 |
Microbial abundance and structure
Abundances of actinobacteria, total bacteria and fungi differed significantly according to forest sites, when control and amplified drought conditions were combined (Table 3, Fig. 1) The highest abundances of all microbial groups were observed at P. halepensis forest and lowest at Q. ilex forest. However, it differed according to plant litter species producing a site x species interaction effect (Table 3; Fig. 1). Actinobacteria and total bacteria had the highest abundance in Q. ilex litter and lowest in P. halepensis at Q. ilex and P. halepensis forests, respectively (Fig. 1B and C). Roughly, higher abundance of fungi was observed in P. halepensis litter at Q. pubescens forest, Q. ilex litter at Q. ilex forest and Q. pubescens litter at P. halepensis forest (Fig. 1D). Regarding the actinobacteria to fungi (A/F) ratio, it was significantly higher in Q. pubescens and Q. ilex litter and lower in P. halepensis litter at Q. pubescens and Q. ilex forests (Fig. 1E). Total bacteria to fungi (B/F) ratio was significantly higher in Q. ilex litter and lowest in P. halepensis litter, at Q. ilex and P. halepensis forests (Fig. 1F).
Overall, there was a significant increase of fungal abundance and a decrease of A/F ratio under amplified drought (AD) in comparison with natural conditions (Table 3). No main effect of drought conditions was observed for actinobacteria, total bacteria and bacteria to fungi (B/F) ratio (Table 3). However, an interaction effect was observed between site and drought conditions for total bacteria, fungi and total bacteria to fungi ratio (Table 3; see Supplementary Table 1, Supporting Information). Thus, we observed a significant increase of total bacterial (Fig. 2A) and fungal abundance (Fig. 2B) under AD conditions at the P. halepensis forest, and a decrease of B/F ratio in Q. pubescens forest (Fig. 2C).
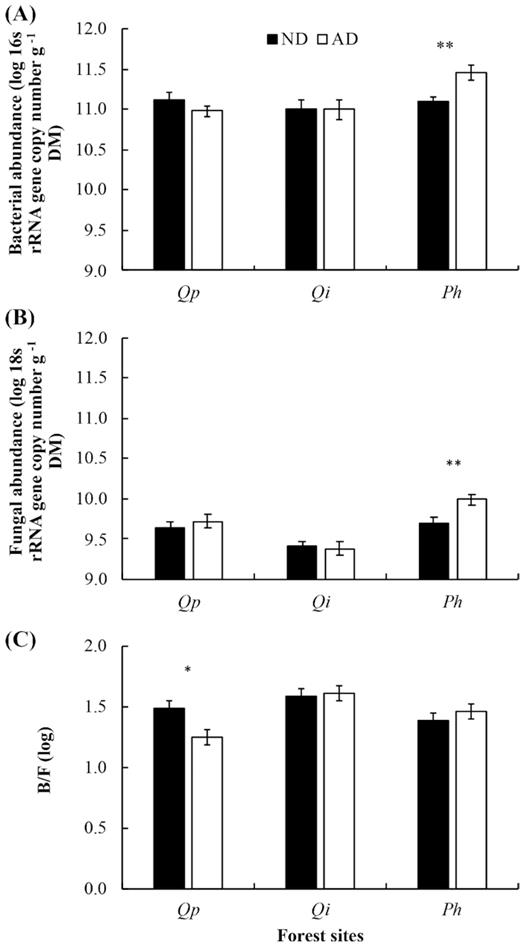
Effects of the two drought conditions (ND = natural drought: AD = amplified drought) on the total bacterial (A), fungal (B) abundances and bacteria to fungi ratio (C). Barplots are mean ± SE. Significant effects are indicated with respective symbols * for P < 0.05 and ** for P < 0.01. Qp = Q. pubescens, Qi = Quercus ilex, Ph = P. halepensis.
DISCUSSION
In this study, we evaluated how reduction of rainfall and change in plant species may affect belowground microbial community's abundance and structure and consequently the litter decomposition process in three dominant Mediterranean forests of southern France. Our findings are that (i) actinobacteria and total bacteria were more affected by changes of plant species than by the decrease of water availability; (ii) fungi were positively impacted by the reduction of rainfall and (iii) the future arrival of P. halepensis litter to Q. pubescens and Q. ilex forest and rainfall reduction could alter the relative proportion of fungi and bacteria in the community hence having implication in microbial decomposers activity.
Effects of litter quality on microbial communities and mass loss
Our results showed the importance of leaf litter initial litter with respect to microbial composition and litter mass loss dynamics. We observed higher abundance of actinobacteria and total bacteria in oak litter than in pine. This is in line with previous studies, which showed a preference of bacteria for high quality litter (i.e. low C/N, C/P, lignin: P and lignin/N ratio) (Hodge, Robinson and Fitter 2000; De Boer et al. 2005 ; Romaní et al. 2006). Both oaks Q. pubescens and Q. ilex are characterised by high N and P content, which are efficiently utilised by bacterial enzymes (Romani et al. 2006) and then are consistently considered key factors in litter decomposition and good predictors of litter mass loss (Moro and Domingo 2000; Garcia-Pausas, Casals and Romanya 2004; Güsewell and Gessner 2009). However, our results only partially corroborate with this by showing that Q. ilex and P. halepensis litter had higher mass loss than Q. pubescens. That is possibly due to higher initial content of total phenolics determined in Q. pubescens compared to Q. ilex, which are known to inhibit litter microbial communities and N mineralisation, during the early stage of decomposition (Lambers 1993; Souto, Chiapusio and Pellissier 2000; Ormeño et al. 2006; Chomel et al. 2014). This may explain the lower mass loss of its litter in comparison with Q. ilex and P. halepensis. The high mass loss of P. halepensis litter may be also explained by the leaching of high content of water-soluble compounds (Tripathi and Singh 1992; Kaushal et al. 2012) and high Na content (Gressel et al. 1995), which both are known to positive correlated litter decay. Gressel et al. (1995) observed that salt accumulation in P. halepensis needles enhanced their breakdown compared to Q. coccifera leaves in a typical Mediterranean mixed woodland.
Effects of litter-site interaction on litter decomposition processes
The influence of plant species on litter decomposition varied according to the forest sites as shown by strong litter-site interaction. At Q. pubescens forest, we observed the highest abundance of fungi associated with P. halepensis litter, associated to a reduction of the A/F ratio. This is consistent with the findings by Hodge et al. (2000) and Wardle et al. (2004) who showed that fungi are favoured by litter with high C/N ratio. In addition, fungi are rather considered specialists and are more equipped enzymatically to assimilate recalcitrant material than more generalist bacteria (Møller, Miller and Kjøller 1999; Romaní et al. 2006). The high abundance of total bacteria observed in P. halepensis litter may be explained by the synergistic relationship between bacteria and fungi because bacteria may benefit by the presence of fungi, which may provide them resources that bacteria were not able to acquire on their own (Romaní et al. 2006). At Q. ilex forest, microorganisms were more numerous with Q. ilex litter in comparison with the two other species, which suggests the high specificity of decomposers for decomposing the autochthonous litter in this forest (Ayres et al. 2009). However, this difference in microbial abundance did not lead to a significant difference in mass loss of Q. ilex litter in its own forest compared to the two other forests. This may due to the presence of decomposers able to use different sources of carbon. Decomposers can also develop preferences for some resources they are not used to (St John et al. 2011). Taking into account the three litter species, our results showed that P. halepensis forest had generally higher microbial abundance (actinobacteria, total bacteria and fungi) than other sites, possibly because this is the only mixed woodland out of the three studied forests and it was demonstrated that an increase of plant diversity promotes litter microbial growth (Chapman and Newman 2010; Santonja et al. 2017). Indeed, litter dissimilarity may decrease resource competition between functional groups and thus increase the abundance, activity, and hence efficiency of decomposers (Barbe et al. 2017).
Effects of rainfall reduction on litter mass loss and microbial community
Contrary to our expectations, amplified drought conditions (AD) had no effect on litter mass loss after 1 year of decomposition. This may be explained by the extremely dry year during which the study was performed (Saunier et al. 2018). Actinobacteria were not directly affected by AD conditions, contrary to previous studies (Bouskill et al. 2013; Felsmann et al. 2015). Nevertheless, a reduction in the A/F ratio was observed, probably due to the positive effect of AD conditions on fungal abundance. The increase of fungal abundance under drier conditions was also observed in other Mediterranean forests (Hawkes et al. 2011; Sherman, Sternberg and Steinberger 2012; Allison et al. 2013; Alster et al. 2013). It is well recognised that fungi are more resistant to drought than bacteria (De Vries and Shade 2013; Guhr et al. 2015) and might get competitive advantage over bacteria during dry periods (Six 2012; Yuste et al. 2011). Moreover, the expansion of fungal hyphae reported by some studies under drought periods (Allison et al. 2013; Zeglin et al. 2013) may result from the reduction of predatory pressure (i.e. grazers activity or number) under water stressed conditions (Davet 2004 ; Bapiri, Bååth and Rousk 2010; Barnard, Osborne and Firestone 2013). The observed decrease of the A/F ratio under AD conditions in Q. pubescens litter was possibly related to the persistence of phenolics due to the decrease of leaching processes under AD conditions, which delayed microbial colonisation by decomposers in that litter (Chomel et al. 2014). Contrary to fungi, total bacteria were not affected by changes in drought conditions. Bacterial biomass stability under drought was also observed by Hartmann et al. (2017), and it was explained by independence of bacteria on water film for dispersal (Mohammadipanah and Wink 2016). Nevertheless, those results varied according to forest site and litter type. For example, in the P. halepensis forest, an increase of total bacteria biomass was observed under AD conditions, which may be explained by (i) natural selection of the most drought-tolerant bacterial groups (Barnard, Osborne and Firestone 2013) and/or (ii) bacteria resilience to drought resulting from their predominating r-selected life strategy, which enables rapid recovery after a period of disturbance (i.e. drought) (Barnard, Osborne and Firestone 2013; Meisner, Rousk and Bååth 2015).
CONCLUSIONS
Our results showed that microbial litter decomposers respond differently to intensification of water stress conditions in the Mediterranean forests. Actinobacteria and total bacteria were more negatively affected by plant litter changes (Q. ilex and Q. pubescens higher than P. halepensis) than by the direct rainfall reduction. In contrary, fungal communities seemed to be more tolerant and even favored to water limitation. Also, the potential resilience of bacterial communities was proposed, while fungal response seemed to reflect a higher degree of adaptation to decreased water availability. Finally, the arrival of P. halepensis litter to a Q. pubescens and Q. ilex forest may change litter microbial communities, leading to a decrease of A/F and B/F ratios and promoting fungi and certain groups of bacteria, which are more capable of using complex carbon sources. Therefore, the intensification of drought conditions in Mediterranean forest may introduce a fungi dominated community over bacteria, by either the capability of degrading more recalcitrant litter or/and tolerance to future climate conditions.
ACKNOWLEDGEMENTS
We thank all the people that contributed in the set-up of the experiment and in the field campaigns especially to Sylvie Dupouyet, Jean-Philippe Orts and Jean-Marc Ourcival. We thank to Anne Haguenauer from Endoume Marine Station (Marseille, France) for her efficient orientation in the lab and whole team of CRI—Crop Research Institute (Prague, Czech Republic)—for their unconditional help and support. The three experimental sites were annually supported by the research infrastructure AnaEE-France (ANR-11-INBS-0001) and by Allenvi through the SOERE F-ORE-T. We acknowledge the se of the COOPERATE database (Reiter IM, Castagnoli G, Rotereau A 2015 "Cooperate database", https://cooperate.obs-hp.fr/db) run by the CNRS FR3098 ECCOREV and OSU-Pytheas with support from the Labex OT-Med . We also thank the French Region PACA and Europe for the PhD grant attributed to Susana Pereira.
AUTHOR CONTRIBUTIONS
SP, MM and VB wrote the manuscript. VB and CF conceived and designed the experiments. SP, AB, AA, and PM performed the experiments. SP, JK, MM, and VB analysed the data.
FUNDING
This research was financially supported by the Agence Nationale pour la Recherche (ANR) with the project SecPriMe2 (ANR-12-BSV7–0016-01), the BioDivMeX Mistrals program and partially by the Ministry of Education, Youth and Sports of the Czech Republic, European Regional Development Fund-Project No. CZ.02.1.01/0.0/0.0/16_019/0000845 and grant No. LTC17075 and Ministry of Agriculture of the Czech Republic, institutional support MZE-RO0418.
This work is a contribution to Labex OT-Med (ANR-11-LABX-0061) and has received funding from Excellence Initiative of Aix-Marseille University—A*MIDEX, a French ‘Investissements d'Avenir’ programme.
Conflict of interest None declared.
