


ABSTRACT
In boreal systems, soil profiles typically consist of distinct stratified horizons, with organic layers at the surface overlying deeper mineral horizons providing microhabitat variation along a depth gradient, and vertical stratification of fungal communities along such soil profiles is commonly observed. We studied fungal community structure in a coastal pine forest along a gradient of decreasing influence from the coast. In this system, the vertical stratification pattern of soil microhabitats (defined here as organic, mineral with roots and mineral without roots: O, MR and MN, respectively) is non-uniform; organic horizons are sometimes buried under drifting sand dunes. Our results show that soil microhabitats are distinct with respect to physiochemical characteristics, community composition and OTU richness. While community composition was partly related to depth and distance from the coastal forest edge, microhabitat appeared to have the strongest influence. A closer inspection of the OTUs with the highest relative sequence abundance within each microhabitat revealed that microhabitats support functionally distinct fungal communities with respect to trophic mode and growth morphology. These results suggest that in coastal pine forests, variation in soil microhabitats contributes to the high fungal diversity found belowground and may play an important role in optimizing nutrient cycling.
INTRODUCTION
Boreal forests serve as an important carbon sink for the planet, particularly due to their extensive distribution in the northern hemisphere, coupled with the disproportionate amount of carbon stored belowground in these forests (Pan et al. 2011). Recent studies have shown that a large proportion of the carbon stored belowground enters the soil via living plant roots and their associated fungi, as opposed to primarily from aboveground litter (Clemmensen et al. 2013). Most plant species rely on associations with mycorrhizal fungi to aid in the uptake of essential but hard-to-access nutrients, such as phosphorus and nitrogen, which are provided by the fungal symbiont in return for plant-derived carbon (Smith and Read 2008). The coniferous trees that dominate boreal forests are no exception and are highly reliant on symbiotic relationships with ectomycorrhizal (ECM) fungi (Smith and Read 2008). Given the important role of belowground fungal communities in facilitating tree nutrition and the importance of boreal forests as a global carbon sink, it is important to understand how abiotic and biotic aspects of the environment shape soil fungal communities.
Bruns (1995) hypothesized that soil depth is one potential factor maintaining high ECM species diversity that can be observed at local scales (even with only a single host tree species present) by serving as a gradient along which environmental factors such as pH, moisture and concentrations or forms of mineral and organic material could vary and therefore provide a framework for potential resource partitioning. Dickie et al. (2002) were the first to test the vertical niche hypothesis on fungal mycelium in soil using T-RFLP data. Their work demonstrated a non-random vertical distribution of ECM taxa across four soil horizons, with taxa ranging from highly horizon specific to broadly distributed, and with all horizons colonized by multiple ECM taxa. Subsequent studies demonstrated this vertical pattern of community structuring in boreal forest soils. Approximately half of the ECM species detected on root tips were restricted to the mineral horizons, and a similar taxon distribution was reported based on cloned DNA extracted from soil (Landeweert et al. 2003) or amplified and sequenced DNA extracted from root tips (Rosling et al. 2003). Vertical partitioning of saprotrophic (SAP) and ECM lifestyles also occurs, indicating that strategies for carbon and nitrogen acquisition of soil fungi mirror the distribution of available carbon and nitrogen resources that vary along a vertical gradient belowground (Lindahl et al. 2007). Vertical changes in root density along a soil profile have also been proposed as a factor shaping soil fungal communities (Peay, Kennedy and Bruns 2011). Soil depth is frequently demonstrated as a main gradient along which fungal communities shift, even when compared to gradients of changing host tree species (Asplund et al. 2019).
Coastal dune habitats of Lithuania represent a harsh environment for tree establishment, and development of effective reforestation methods has been a major concern in this area (Menkis et al. 2012, and citations therein). These dune environments are harsh, not only due to their sandy, dry, acidic, nutrient-poor soils but also their propensity for erosion and forest fires. For nearly two centuries, one approach to combat erosion and difficulties with tree establishment was to plant non-native, stress-tolerant Pinus mugo, particularly in the Curonian Spit of the southern part of the Lithuanian coast. Aučina et al. (2011) provided the first study exploring the ECM fungal community structure of P. mugo in this region and showed that P. mugo has been able to thrive in this habitat, a result that may be linked to the support provided by the associated ECM community. Another approach has been to optimize the practice of growing native Pinus sylvestris seedlings in forest nurseries and subsequently outplanting them. Efforts have included investigating the community structure of ECM fungi in these nurseries, and utilizing ECM-inoculated P. sylvestris seedlings to help improve establishment rates (Menkis and Vasaitis 2011; Menkis et al. 2012). Considering the ecological importance of pines in coastal environments for soil stabilization and inland wind protection, a better understanding of the soil fungal community structure could be useful for protecting these habitats.
Since organic soils are sometimes buried under mineral soils, this system also provides a unique opportunity to investigate whether vertical stratification of fungi in forest soils is the result of distance to the surface, niche characteristics or both. To our knowledge, this is the first study in which an attempt is made to decouple soil depth from vertical microhabitat variation in the field. We hypothesize that microhabitat will have a greater effect than soil depth on community composition in congruence with the vertical niche hypothesis as proposed by Bruns (1995). It seems logical to accept soil depth as a proxy of environmental characteristics potentially shaping microbial communities in soil, but it is also possible that soil depth could play a role in its own right. For example, the soil surface could be a primary location for spores travelling into and out of the soil environment for fungi that utilize aboveground spore dispersal methods. Distance from the soil surface might influence species distributions for these organisms regardless of the soil depth at which other fundamental niche requirements are satisfied. Other important factors could include proximity to newly fallen dead organic matter or exposure to different types of aboveground disturbance, both of which are by nature a function of distance to the surface.
In this study, we characterize three distinct soil microhabitats (mineral soil with or without roots and organic soil) along a forest floor developmental gradient from the forest edge just behind the coastal dunes into pine forest further inland on the Lithuanian coast. The main goals of this work were (i) to understand underlying drivers of community assembly across identified soil microhabitats, (ii) to identify and characterize the distribution patterns of functional traits that are potentially beneficial in this distinctive and vulnerable habitat and (iii) to make a first attempt at decoupling soil depth and niche characteristics. This work highlights the importance of soil microhabitats in maintaining high fungal diversity in sandy soils as well as their role in shaping functionally distinct fungal communities.
MATERIALS AND METHODS
Field site and sample collection
The field site was located in a planted pine (P. sylvestris) stand on the Lithuanian coast, north of Palanga (55°58.79N 21°04.35E; Fig. 1A). At this site, planted pines stabilize the soil, and low sand dunes separate the forest from the beach. The forest floor develops along a sharp gradient from the forest edge just behind sand dunes, with a forest floor almost entirely of pure sand with sporadic grasses, toward forest with gradually accumulated needle litter, followed by increasing moss cover and a gradually more continuous organic soil horizon (Fig. 1B). To sample this gradient, five transects (55–69 m long, transects A–E) were established perpendicular to the coast, ∼10 m apart. In August 2008, one soil core (3 cm diameter, and ∼1 m deep) was taken at five positions (gradient positions 1–5) along each transect (totaling 25 cores) to represent different stages of forest floor development (Fig. 1C). Gradient positions 2–5 were on average at 10, 26, 47 and 70 m inland from gradient position 1. Soil cores were collected using a PN425 JMC Sub-Soil Probe PLUS (JMC Soil Samplers, Newton, USA) with a new transparent plastic liner for each core.
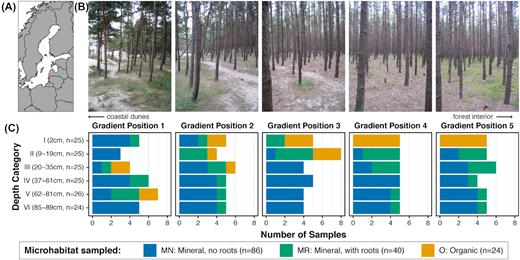
Characteristics of study site and sampling strategy, showing (A) geographic location of site, (B) photographs of forest floor developmental gradient and (C) number of times each microhabitat type (MN = mineral soil without roots, MR = mineral soil with roots, O = organic soil) was sampled at each gradient position and within each depth category.
Within each soil core, five regions were identified to represent visually distinct horizons, and their precise depth was recorded. For each of the five regions, a 4 cm deep section was marked on the liner to be sampled. In addition, the top 4 cm was marked for sampling on all cores, for a total of six samples per core. All organic horizons present in the 25 soil cores were sampled, which were located at varying depths between soil cores. In the field, the liners were placed on a tarpaulin and cut open using a scalpel with two slits along its length. This allowed us to open the liner and collect the layers marked using disposable plastic spoons. In this way, a total of 150 samples (six samples from each of 25 soil cores) with a known volume (0.028 L) were collected, placed in zip-lock bags and stored on ice overnight. Because samples were collected after visual identification to capture different soil layers in the profiles instead of sampling at uniform depths, we assigned them to one of the six depth categories based on the middle depth of the sample: I (2 cm, n = 25); II (9–19 cm, n = 25); III (20–35 cm, n = 25); IV (37–61 cm, n = 25); V (62–81 cm, n = 26) and VI (85–98 cm, n = 24).
The presence of roots in mineral samples was further recorded, and roots were transferred to separate zip-lock bags before homogenizing the mineral soil samples in their bags. Roots could not be distinguished in the organic soil samples and were thus not removed from these, however most organic soil samples appeared to have roots in them. Based on soil horizon and presence of roots, three distinct microhabitats were identified among the samples (24 organic soil samples, O; 40 mineral soil samples with roots, MR; and 86 mineral soil samples without roots, MN). Each soil sample was split into two parts: one was air-dried (to measure abiotic environmental characteristics) and the other was stored at −20°C within 24 h after sampling and freeze-dried within a week (to extract DNA for community characterization).
Abiotic soil characteristics
Pi was extracted and quantified in all samples according to the methods of Ali et al. (2009). Pi concentration was chosen as a measurement of nutrient availability because it can be quantified in a comparable way for both organic and dry, sandy mineral soils.
For samples from transects A, B and C, concentrations of exchangeable cations (Al, Ca, Fe, K, Mg, Mn and Na), the effective cation exchange capacity (CEC) and soil pH were measured in addition to soil moisture and Pi concentration. Exchangeable cations were extracted from 4 g of air-dried soil in 1:5 w/V of 0.1 M BaCl2 by shaking on a vertical shaker at 45 rpm for 2 h (Hendershot, Lalande and Duquette 1993). The supernatant was separated by centrifugation at 6000 rpm for 5 min at 4°C. Exchangeable cations were analyzed using an Optima 5300 DV ICP-OES System (Perkin Elmer, USA). CEC was calculated as described by Hendershot, Lalande and Duquette (1993). The cations used for the calculations were Al, Ca, K and Mg. The same extracts were used to measure pH (E632 Metrohm, Hesisau, Switzerland).
DNA extraction, PCRs and sequencing
Organic soil layer samples were homogenized in a ball mill. DNA was then extracted from all samples using a CTAB extraction method as previously described (Rosling et al. 2003). For each sample, forward primer gITS7 and reverse primer ITS4 were used to amplify the ribosomal internal transcribed spacer (ITS2) region, and an 8 bp unique sample tag was added to the ITS4 primer (White et al. 1990; Ihrmark et al. 2012). To minimize biases introduced by PCR amplification, the number of PCR cycles was optimized for each sample by quantitative PCR, ensuring that PCR was terminated in the exponential phase (Bödeker et al. 2016). Three replicate PCRs were performed for each sample. Purification, quantification and library pooling were all performed as previously described (Bödeker et al. 2016). A GL FLX Titanium system (Roche, Basel, Switzerland) was used by LGC Genomics GmbH (Berlin, Germany) to perform the 454 sequencing. Over 300 000 sequences were generated.
Processing of sequence data
To analyze fungal community composition, sequence data were quality filtered and clustered into operational taxonomic units (OTUs). Initial quality filtering, de-multiplexing and clustering of sequences were conducted with the SCATA pipeline (https://scata.mykopat.slu.se/, (Clemmensen et al. 2013)). Homopolymers were collapsed to 2 bp, and single-linkage clustering at 98.5% sequence similarity was used to delimit OTUs. The most abundant sequence genotype in each cluster was used as the representative sequence for the OTU. ITSx (version 1.0.11; Bengtsson-Palme et al. 2013) was used to extract the ITS2 region from each representative sequence, specifying ‘Fungi’ as the only list of organisms to search. Further, ITS2 sequences for which either the first or last position of the ITS2 region could not be identified were excluded from the dataset (5.8S not found, n = 41, beginning of LSU region not found, n = 2). A check for chimeric sequences was not conducted, as formation of chimeric sequences in the ITS2 region using 454 sequencing is much less frequent (0.2% of total reads) than for 16S or 18S analyses, and false positives are prevalent for this region using common chimera-checking algorithms (Bjørnsgaard Aas, Davey and Kauserud 2017). Taxonomic identity was determined using the SINTAX classifier (cutoff = 0.8) in usearch (version 11.0.667; Edgar 2016) and the UNITE USEARCH/UTAX reference dataset (version 8.0; UNITE Community 2019) available on the UNITE database (Kõjalg et al. 2005). OTUs that could not be identified as belonging to the fungal kingdom were removed from the dataset. Of the 1688 OTUs, 21.9/41.4% was identified to species/genus level (representing 55.5/76.1% of the sequences (Table S1, Supporting Information)). Raw sequence data, tagged primer sequences, OTU count/sample matrix with the results of the SINTAX classifier and online FUNGuild tool appended to it, soil sample metadata and a FASTA file of the ITS2 sequences extracted from the 1688 representative OTU sequences are all archived in Dryad (doi:10.5061/dryad.6m905qfvs).
Data Visualization and Statistical analyses
Species accumulation curves were generated to assess the coverage of OTUs sampled, and measures of richness, evenness, and diversity were calculated to compare diversity of the three microhabitats. The captured fungal richness of the entire dataset, and of each microhabitat separately, were visualized using species accumulation curves based on a random sampling without replacement for 100 permutations using the vegan R package (Oksanen et al. 2018). To assess diversity of samples, richness was estimated using both ACE and Chao indices using the ‘estimate’ function in the vegan R package (Oksanen et al. 2018). Richness was also evaluated using a rarefied dataset (rarefied to the smallest sequencing depth among the samples, 169 sequences) by rarefying the dataset 10 times and calculating the mean of the observed richness for each. Pielou's evenness and Shannon's diversity index were calculated as the average of 10 calculations of the rarefied dataset. Significant differences between samples were determined using permutation tests of independence and post-hoc pairwise permutation tests with a false discovery rate (FDR) P-value correction (Mangiafico 2016). R software (version 3.5.1; R Core Team 2018) used within RStudio (RStudio Team 2016) was used for all statistical analyses and for generating figures.
Principal component analysis (PCA) was used to analyze the variation of samples with regard to soil environmental characteristics (% soil moisture, pH, Pi, Al, Ca, Fe, K, Mn, Mg and Na) using data from transects A, B and C. Samples with missing data were not included, leaving a total of 85 samples (9 O, 30 MR and 46 MN) for analysis. All variables except pH were log transformed to approach normality, centered and scaled before analysis. Relative strength of patterns relating to gradient position, depth and microhabitat were tested using Pearson correlation to the first three principal components (PCs). Permutation tests of independence and post-hoc pairwise permutation tests of independence using FDR P-value correction were used to test for significant differences between the microhabitats for these variables (Mangiafico 2016). Marginal permutational analysis of variance (PERMANOVA) tests were also used to test the relative influence of microhabitat (factor), dune-forest gradient (factor) and depth (continuous variable) using the ‘adonis2’ function in the vegan R package (Oksanen et al. 2018). Gradient position was treated as a categorical variable because each position represents a different forest floor developmental stage. For depth, the actual recorded measurement was used and treated as a continuous variable, since the depth categories vary widely in the range of depths contained within each (from no depth variation in category I, up to a range of 24 cm in category IV).
Non-metric multidimensional scaling (nMDS) was used to visualize the distribution of samples based on the dissimilarity of their fungal communities. A Bray–Curtis dissimilarity matrix was generated, based on per-sample relative abundances, and nMDS was conducted with two dimensions and a maximum of 200 random starts. The relative strength of correlation of microhabitat, gradient position and depth was determined using the ‘envfit’ function in the vegan R package (Oksanen et al. 2018). Marginal PERMANOVA tests were also used to test the relative influence of microhabitat, dune-forest gradient, and depth. A standard PERMANOVA was conducted to test for the explanatory power of microhabitat, and post-hoc pairwise PERMANOVAs were conducted using a Bonferroni correction.
The variation in taxonomic and functional assignment of fungal communities associated with the three microhabitats was analyzed by identifying a core community consisting of OTUs that occur in at least 50% of samples in at least one microhabitat and account for at least 0.5% average relative ITS2 sequence read abundance in that microhabitat. The core community was determined on a per microhabitat basis to account for the difference in number of samples of each microhabitat type, and was also based on the average relative abundance to account for variation in sequencing depth. Taxonomy assignment predicted with the SINTAX classifier (Edgar 2016) was used to infer trophic and functional characteristics by utilizing the FUNGuild database (Nguyen et al. 2016) and information of taxa available in the primary literature. OTUs were first categorized based on the trophic mode (ECM, SAP, pathotrophic (PATH), root-associated (root) or unknown). When possible, the OTUs were further categorized based on the growth morphology (medium-distance (mat-forming subtype) or short-distance ECM (ECMmat, ECMshort), dark septate endophyte (DSE) or ect-endomycorrhizal (EE) root-associated fungi (rootDSE, rootEE), and molds and yeasts (SAPmold)) (Agerer 2001; Agerer 2006; Smith and Read 2008; Clemmensen et al. 2013). The average relative sequence read abundances per microhabitat of each OTU were scaled to a mean of zero and a variance of one, and a heatmap was used to illustrate the variation between microhabitats using the gplots R package (Warnes et al. 2016). Hierarchical clustering was also used to determine the overall similarity between microhabitats based on the distribution of these prominent OTUs.
RESULTS
Soil environmental characteristics
The relative frequencies of soil microhabitats sampled (O, MR and MN) did not change dramatically along the developmental gradient, but the vertical distribution patterns of the microhabitats did (Fig. 1C). For O samples, gradient position and depth are significantly correlated (r = −0.7, P ≤ 0.0001) with organic soil layers only found as topsoil at gradient positions 4 and 5. Depth and gradient position were not significantly correlated for the two mineral microhabitats. All abiotic variables tested are significantly different with respect to microhabitat (Table S2a, Supporting Information). In brief, organic samples had the highest average chemical concentrations, highest average CEC, lowest average pH and highest average soil moisture. The MR microhabitat was characteristically somewhere in between the O and MN microhabitats for most variables. PCA of the abiotic variables also demonstrates that samples tend to separate along the first PC axis (60.74% of the total variation) based on microhabitat, along PC2 (12.92%) with gradient position, and along PC3 (8.88%) with depth (Fig. 2; Figure S1, Supporting Information). All three of these observed correlations are statistically significant (Table 1a). PERMANOVA analysis shows that microhabitat has a larger marginal effect than both the dune-forest gradient and depth, indicating that of the three, it explains the most abiotic variation among the samples (Table 1b).
![PCA of physiochemical variables [soil moisture (%), pH, Pi concentration (NaHCO3 extractable PO4; µg/kg soil), cation concentration (Al, Ca, Fe, K, Mn, Mg, Na; mg/kg soil)] with relation to microhabitat type [MN = mineral soil without roots (n = 46), MR = mineral soil with roots (n = 30), O = organic soil (n = 9)]. All variables except pH were log transformed, centered and scaled prior to analysis. Percentage of variance explained by each PC is given in parentheses. Values are based on data for 85 samples from transects A, B and C. Samples with missing data were excluded in analysis. See Figure S1 (Supporting Information) for PCA displayed to show patterns relating to gradient position and depth.](https://oup.silverchair-cdn.com/oup/backfile/Content_public/Journal/femsec/95/11/10.1093_femsec_fiz149/4/m_fiz149fig2.jpeg?Expires=1750031249&Signature=4IH3LruCDGOvWflAer7iQn57MtPWkq-PLQwzSV9Y6Izt5sHRHEqcW9itu-qcWYa1UphluYHm8cgm1lGl0c5aceGimWo1HBy1fK7jwn3eNFxd1adzAa5pusESsm8LnQXnMC-YCrJPFpMwQqVa7av-yt0MevCk0ne4V4BocaQfZh~FCyuWfnso5md6fRXeJvgsSg-2gaAoJUZ7IRhMrwE0tGaDEN5crqffeCtV9WcNsId7HfeEg0uKyJ-oFo5j8TNz-0cQpGAxTBHlLcHT9w-YPhFdIFRIS4Dk7sWj8PTvq-tSdDlW5mvcuEzeR5XsB~tyoe6VrFdydDw0O7h7Vz9SYA__&Key-Pair-Id=APKAIE5G5CRDK6RD3PGA)
PCA of physiochemical variables [soil moisture (%), pH, Pi concentration (NaHCO3 extractable PO4; µg/kg soil), cation concentration (Al, Ca, Fe, K, Mn, Mg, Na; mg/kg soil)] with relation to microhabitat type [MN = mineral soil without roots (n = 46), MR = mineral soil with roots (n = 30), O = organic soil (n = 9)]. All variables except pH were log transformed, centered and scaled prior to analysis. Percentage of variance explained by each PC is given in parentheses. Values are based on data for 85 samples from transects A, B and C. Samples with missing data were excluded in analysis. See Figure S1 (Supporting Information) for PCA displayed to show patterns relating to gradient position and depth.
(a) Pearson correlations between microhabitat type, position along forest floor developmental gradient and soil depth with the first three PCs of the soil physiochemical characteristics PCA (Fig. 1). Percentage of variation explained by each principal component is given in parentheses. (b) Marginal PERMANOVA tests for relative effect of microhabitat, gradient position and soil depth on physiochemical characteristics of soil samples.
| (a) | |||||
|---|---|---|---|---|---|
| PC1 (60.74%) | PC2 (12.92%) | PC3 (8.88%) | |||
| Microhabitat | r = 0.80 (P = 0.0000) | r = 0.14 (P = 0.1952) | r = −0.06 (P = 0.6072) | ||
| Dune-forest gradient | r = 0.20 (P = 0.0608) | r = −0.31 (P = 0.0040) | r = −0.17 (P = 0.1305) | ||
| Depth (cm) | r = −0.41 (P =0.0000) | r = −0.19 (P = 0.0852) | r = 0.48 (P = 0.0000) | ||
| (b) | |||||
| df | SS | R2 | F | Pr(>F) | |
| Microhabitat | 2 | 334.65 | 0.39839 | 37.6743 | 0.001 |
| Dune-forest gradient | 4 | 52.97 | 0.06306 | 2.9817 | 0.003 |
| Depth (cm) | 1 | 27.11 | 0.03227 | 6.1031 | 0.006 |
| Residual | 77 | 341.98 | 0.40712 | ||
| Total | 84 | 840.00 | 1.00000 | ||
Microhabitat types: MN = mineral soil without roots (n = 86), MR = mineral soil with roots (n = 40), O = organic soil (n = 24)
Sequence data and captured diversity
A final dataset of 235 927 fungal ITS2 sequences representing 1688 OTUs remained after quality filtering in SCATA, removal of global singletons and removal of sequences that could not be identified as a complete ITS2 sequence of fungal origin. The three microhabitats were on average sequenced to the same depth (Table S3, Supporting Information). Species accumulation curves show that sampling was not exhaustive, but each curve appears to be approaching an asymptote (Figure S2, Supporting Information).
Effects of microhabitat on community composition and functional diversity
A similar pattern to abiotic variation of samples was revealed when taxonomic composition was analyzed using nMDS, where samples overall seem to vary more with respect to microhabitat than to depth or gradient position (Fig. 3A). While all three are significantly correlated with community composition, correlation with microhabitat is the strongest (Table 2a). Marginal PERMANOVA tests confirm the relative explanatory power of microhabitat (Table 2b), and pairwise PERMANOVA tests indicate that the communities in these three microhabitats are compositionally distinct (Table 2c). The average relative ITS2 sequence read abundance per microhabitat indicate that on average, Agaricomycete OTUs make up ∼2/3 of the MN habitat, and form the most well-represented class in all three microhabitats (Fig. 3B). Eurotiomycetes appear to be most commonly found in MR, and the abundance of Leotiomycetes increases from MN to MR to O, whereas Archaeorhizomycetes are found almost exclusively in the O microhabitat (Fig. 3B). The three microhabitats also significantly differ in estimated OTU richness, diversity and evenness, with O being the most OTU rich, diverse and even, and MN being the least (Table S2b, Supporting Information).
![Relationship between microhabitat type [MN = mineral soil without roots (n = 86), MR = mineral soil with roots (n = 40), O = organic soil (n = 24)] and community composition displayed using (A) nMDS based on Bray–Curtis dissimilarities between samples (stress = 0.2; n = 150 samples, 1688 OTUs) and (B) stacked bar plots of average relative proportion of ITS2 sequence reads for prominent fungal classes within each habitat. Dissimilarity matrix was calculated after transforming the OTU counts to per-sample relative sequence read abundances (A). Per-sample relative sequence read abundances were calculated before pooling samples by microhabitat type (B).](https://oup.silverchair-cdn.com/oup/backfile/Content_public/Journal/femsec/95/11/10.1093_femsec_fiz149/4/m_fiz149fig3.jpeg?Expires=1750031249&Signature=CwQLUWBmqUhm9n~6qErATWnYp3-vemB8MrT3O0hvEost7ZJ~-v7dBz8UN7f6gWDNJy-ftyRd7Uke288ahOc08nTE5Hyf~f53J1noKIeLEEcGXkRJHitQLu78KEg8R~djuYIYeQtkPjMXUHNUiupMfrnJsFEakESR7X9Ad1qpUaw5naHF16iawuf7EIC5VwAq4odm9269yVWXeXODUp7qOiXlkUiefhlGgAO6XTeyrBN5tfVP71ZucU9bYskVCWajC6aj7r7vJf53OhDJZ8RX6AVX0~Vy7Vm3Sq41ogXdfPXoRHYXui9ZINTCl1sdoHLFpUdpZ5jTxE0YrBN1rz3wQQ__&Key-Pair-Id=APKAIE5G5CRDK6RD3PGA)
Relationship between microhabitat type [MN = mineral soil without roots (n = 86), MR = mineral soil with roots (n = 40), O = organic soil (n = 24)] and community composition displayed using (A) nMDS based on Bray–Curtis dissimilarities between samples (stress = 0.2; n = 150 samples, 1688 OTUs) and (B) stacked bar plots of average relative proportion of ITS2 sequence reads for prominent fungal classes within each habitat. Dissimilarity matrix was calculated after transforming the OTU counts to per-sample relative sequence read abundances (A). Per-sample relative sequence read abundances were calculated before pooling samples by microhabitat type (B).
Relative effects of microhabitat, position along the forest floor developmental gradient and soil depth on fungal community composition. (a) Strength and significance of correlation between microhabitat, gradient position and soil sample dissimilarities (displayed in Fig. 3A). (b) Marginal PERMANOVA tests of relative impact of microhabitat, gradient position and soil depth on community composition. (c) PERMANOVA and post-hoc pairwise PERMANOVA (with Bonferroni P-value correction) tests of variation between microhabitats with relation to community composition.
| (a) | (b) | ||||||
|---|---|---|---|---|---|---|---|
| r2 | Pr(>r) | df | SS | R2 | F | Pr(>F) | |
| Microhabitat | 0.3574 | 0.001 | 2 | 5.201 | 0.09491 | 8.5545 | 0.001 |
| Dune-forest gradient | 0.0595 | 0.030 | 4 | 2.399 | 0.04378 | 1.9731 | 0.003 |
| Depth (cm) | 0.2729 | 0.001 | 1 | 1.043 | 0.01904 | 3.4315 | 0.001 |
| Residual | 142 | 43.167 | 0.78771 | ||||
| Total | 149 | 54.800 | 1.00000 | ||||
| (c) | |||||||
| R2 | P | Padj | |||||
| Microhabitat | 0.14815 | 0.001 | – | ||||
| Pairwise: | |||||||
| MN vs MR | 0.08454 | 0.001 | 0.003 | ||||
| MN vs O | 0.14732 | 0.001 | 0.003 | ||||
| MR vs O | 0.09501 | 0.001 | 0.003 | ||||
Microhabitat types: MN = mineral soil without roots (n = 86), MR = mineral soil with roots (n = 40), O = organic soil (n = 24)
Using the criteria of at least 50% frequency and 0.5% average relative sequence read abundance within any microhabitat, a core community of 31 OTUs was identified. Nearly all of the 31 core OTUs appear to vary in average relative abundance between the three microhabitats (Fig. 4). The two PATH OTUs detected are most commonly associated with mineral microhabitats (MN+MR; Heterobasidion occidentale and Resinicium bicolor). SAP OTUs can be most closely associated with any of the individual microhabitats (MN: Trichoderma sp.; MR: Penicillium sp., Umbelopsis sp., Saccharomycetales sp., Cryptosporiopsis sp.; O: Umbelopsis sp., Hyaloscyphaceae sp., Cladophialophora sp.), or both mineral microhabitats (Eurotiales sp.), and many grow as yeasts or molds (Fig. 4). Three of the six OTUs that most closely associate with the MR microhabitat are yeast or mold forming SAP OTUs (and the other three are unknown Helotiales species). Short-distance exploring ECM taxa are most closely associated with O (Tylospora sp.) or O+MR (Cenococcum geophilum), while mat-forming ECM taxa tend to be associated with MN (Sarcodon glaucopus, Sarcodon calvatus, Sarcodon squamosus, Sarcodon scabrosus). Root-associated (and possibly mycorrhizal or facultatively mycorrhizal) taxa are most closely related to O microhabitats (DSE Phialocephala sp., and root-associated Archaeorhizomyces sp.) or O+MR (EE Wilcoxina rehmii, and DSE Cadophora finlandica). Three OTUs are denoted as DSE in Fig. 4 (marked with an asterisk), because the representative sequences were similar to known DSE taxa (species of Oidiodendron and Meliniomyces) based on BLAST searches against the UNITE database (Kõjalg et al. 2005) when INSD sequences were included. Approximately half of the core OTUs have their highest relative abundance in O microhabitats, with a few of those also appearing to have an average relative abundance that is almost as high in MR microhabitats. Functional characteristics could not be assigned for seven OTUs (Fig. 4). OTUs seem to be most closely associated either with a single microhabitat, or a combination of O+MR or MN+MR, but not MN+O, further indicating that the MR microhabitat is in some ways an intermediate microhabitat between MN and O.
![Association between core community OTUs and microhabitat type [MN = mineral soil without roots (n = 86), MR = mineral soil with roots (n = 40), O = organic soil (n = 24)]. Average relative ITS2 sequence read abundance (%) for each OTU within each microhabitat type is indicated within each cell. Cell color is based on row-wise centered and scaled values (mean = 0, standard deviation = 1). Warm cell colors indicate positive association. OTUs are labeled with highest assigned taxonomy and unique OTU identifier. Colors along right side indicate functional characteristics relating to trophic mode and growth morphology (ECMmat = ectomycorrhizal, medium-distance mat-forming exploration type; ECMshort = ectomycorrhizal, short-distance exploration type; root = root-associated; rootEE = root-associated, ect-endomycorrhizal; rootDSE = root-associated, dark septate endophyte; SAP = saprotrophic; SAPmold = saprotrophic, molds and yeasts; PATH = pathotrophic; unknown = trophic mode and growth morphology unknown).](https://oup.silverchair-cdn.com/oup/backfile/Content_public/Journal/femsec/95/11/10.1093_femsec_fiz149/4/m_fiz149fig4.jpeg?Expires=1750031249&Signature=1ftxeBG3sDlFvuQRzsLoR1CY2-Iqy5M2AvobKWhHop2NC~3vS5aCaehXOkpcohmq27AahXrT1wKwYQls94gUTK1ODVEWjz-oLYwZaOyhKrZ-XjmMnoqaA9K-6NObGV~w9nwA6DsTFV4PF3cbUedJVeyTQFVlERo23VikH9j~NnMK60dQWkL2O3Il5~9t0cBJVcr5aUQC5loa6hyVL--pHMxZ3JvJuUaA4Bufi3~naQneL97zMDTdrtWeuIOtRaO~0SGDWjUW9VB10Ito76-~LgXaz7NcvMgzI0ZJ5-YZFppjUjoEPPg8KTjL~bWVXPqOpakwpHlSPHpTNsjhR-~OHw__&Key-Pair-Id=APKAIE5G5CRDK6RD3PGA)
Association between core community OTUs and microhabitat type [MN = mineral soil without roots (n = 86), MR = mineral soil with roots (n = 40), O = organic soil (n = 24)]. Average relative ITS2 sequence read abundance (%) for each OTU within each microhabitat type is indicated within each cell. Cell color is based on row-wise centered and scaled values (mean = 0, standard deviation = 1). Warm cell colors indicate positive association. OTUs are labeled with highest assigned taxonomy and unique OTU identifier. Colors along right side indicate functional characteristics relating to trophic mode and growth morphology (ECMmat = ectomycorrhizal, medium-distance mat-forming exploration type; ECMshort = ectomycorrhizal, short-distance exploration type; root = root-associated; rootEE = root-associated, ect-endomycorrhizal; rootDSE = root-associated, dark septate endophyte; SAP = saprotrophic; SAPmold = saprotrophic, molds and yeasts; PATH = pathotrophic; unknown = trophic mode and growth morphology unknown).
DISCUSSION
Several studies have shown that fungal communities are structured vertically along the soil depth profile in boreal forests (Landeweert et al. 2003; Rosling et al. 2003; Lindahl et al. 2007; Clemmensen et al. 2013; Asplund et al. 2019). However, the consistent layering pattern of boreal soil horizons, with various mineral layers layered below organic layers, has hindered disentangling of the relative importance of depth versus niche characteristics for fungal community assembly across soil profiles. Here, we utilize a coastal pine forest where organic horizons are sometimes buried below mineral soils, and our results suggest that variation in fungal communities is shaped more by microhabitat characteristics than by distance from the surface alone; depth may simply be correlated with environmental factors that shape fungal communities as opposed to shaping communities directly. While environmental characteristics such as pH, soil moisture, CEC and inorganic phosphorus availability may vary consistently with depth, our results show that abiotic soil characteristics in this unique habitat are likely more closely related to the microhabitat type (O, MN or MR) of the soil than to either distance from the surface or position along the horizontal gradient (from the forest edge closest to the coastal dunes into the forest interior). Our results also reveal a similar relationship between the fungal communities that inhabit these soils and microhabitat type, suggesting that niche characteristics are more important than depth for shaping fungal communities.
Studies of vertical stratification of soil fungal communities have shown functional differentiation with depth based on trophic mode (Lindahl et al. 2007; Clemmensen et al. 2013). Similarly, we find that functional traits relating to growth morphology and trophic mode are non-randomly distributed, indicating ecologically relevant functional differentiation between microhabitats. We find that short-distance ECM OTUs and root-associated DSE and EE OTUs are more commonly associated with O and MR habitats, while OTUs with a medium distance mat-forming exploration type are found in habitats without roots (MN). We considered all four Sarcodon OTUs to be medium distance mat-forming based on a genus level assessment; however, it is not always the case that all species in a genus share an exploration type (Tedersoo and Smith 2013). W. rehmii, formerly known as the ‘E-strain’ fungus, often forms ectomycorrhizas with pine, and the EE lifestyle is sometimes considered a type of ECM (Yu, Egger and Peterson 2001, and references therein). The ecological roles and mycorrhizal status of DSE fungi (e.g. C. finlandica and Phialocephala sp.) are less well-understood than those of ECM or arbuscular mycorrhizal fungi (Knapp, Pintye and Kovács 2012), but they likely exhibit a symbiosis with host plants that has important implications for host nutrient uptake (Mandyam and Jumpponen 2005). In areas of low root density, long-distance exploration types are more common, whereas short-distance exploration types are more prevalent in areas of high root density for tree islands in a Mediterranean climate; root density may therefore be playing a similar role in the observed vertical distribution in studies of other forest types (Peay, Kennedy and Bruns 2011). Our results support the functional morphology hypothesis (Peay, Kennedy and Bruns 2011; O'Hanlon 2012) for the core ECM and root-associated fungal community, some of which are often considered ECM (Rinaldi, Comandini and Kuyper 2008, but see Tedersoo, May and Smith 2010). Interestingly, many of the identified core OTUs produce hydrophobic mycelial mats (e.g. Sarcodon spp.; Lilleskov, Hobbie and Horton 2011) or melanized mycelia (e.g. C. geophilum, DSE fungi; Smith and Read 2008; Fernandez and Koide 2013). In light of the characteristically dry, sandy soils found in this coastal pine forest, hydrophobic mycelial mat formation and melanin production capabilities may provide a competitive advantage for OTUs in their respective microhabitats (Unestam 1991; Unestam and Sun 1995; Butler and Day 1998; Grishkan 2011; Fernandez and Koide 2013).
Another emerging hypothesis in fungal ecology is the phylogenetically defined niche hypothesis, which states that closely related species often share a similar fundamental niche (O'Hanlon 2012). Differentiation of the realized niche as a result of competitive outcomes can occur for closely related taxa with presumably similar fundamental niche requirements (e.g. Mujic et al. 2016). In contrast, we found that four of the most prominent OTUs belong to the same genus (Sarcodon) and tend to dominate and co-occur in the MN microhabitat (but can also co-occur in MR and occasionally O). Considering the small volumes of the soil samples in this study, we can infer that the species were truly co-occurring. Co-occurrence of Bankeraceae species has been previously reported (Holec and Kučera 2018). Many Sarcodon species are considered to be rare, some being red-listed in several western European countries, so the presence of a single Sarcodon taxon with high relative sequence abundance, let alone several, is striking. S. glaucopus, for example, represents on average 33% relative sequence abundance for MN samples, and frequently represents >70% abundance in a single sample. It is plausible that the inferred high abundance and co-occurrence of Sarcodon species is a real phenomenon, suggesting that this habitat is unique in ways that make it particularly suitable for this group of fungi, but methodological complications cannot be ruled out as a possible explanation. The ecological significance or the reason for the high relative abundance of these mat-forming taxa cannot be determined with confidence from the data available, but it could be hypothesized that they play a role in soil stabilization, or are particularly well suited for catching nutrients that percolate through the sandy soils found in this environment. These characteristics make Sarcodon spp. a potentially interesting group for future inoculation experiments for improving tree establishment rates in these types of coastal systems (Menkis et al. 2012).
Little is known about intraspecific ITS sequence variation or ITS copy number for Sarcodon. High intraspecific ITS sequence variation could inflate the number of OTUs observed if a single taxon splits into multiple OTUs based on sequence similarity. In this study, separation of the four core Sarcodon OTUs seems to reflect actual biological diversity based on similarity between the OTU representative sequences and sequence data for four distinct Sarcodon species available in the UNITE database (Kõjalg et al. 2005). Variation in ITS copy number is a known issue rendering metabarcoding studies based on the ITS region only ‘semi-quantitative’, but seems to be correlated with phylogenetic relatedness (Lamb et al.2019; Lofgren et al. 2019). It is possible that the observed relative abundance of Sarcodon is artificially inflated by characteristically high ITS copy numbers, and that the presence of multiple Sarcodon species could be magnifying this hypothetical effect. One final but important caveat of this study is that the data provide insight into relative taxon abundance within each sample, but aspects of absolute abundance and metabolic activity are unknown. Therefore, while a taxon may have the highest average relative sequence abundance in one microhabitat, it may have a higher average biomass or level of metabolically active biomass in another.
Niche differentiation based on three microhabitats delineated here can explain a large proportion of the fungal community variation, but not all of it. While significantly different, the communities of the three microhabitats do overlap and vary within. Some of this variation is likely the result of uncharacterized biotic or abiotic factors. For instance, undocumented characteristics such as mycorrhizal colonization and health of the roots present in MR samples may be contributing variation within this microhabitat. Despite the rather large number of samples (150) included and the high overall OTU richness captured in the current study, species accumulation curves suggest that the total diversity was not exhaustively sampled. This was particularly true for the organic samples (which have the highest average OTU richness) and is the microhabitat sampled the least (24 of 150 samples).
Soil microhabitats delineated based on soil type and root presence can explain a significant proportion of the fungal community variation in coastal sand dune pine forests and may play a crucial role in promoting fungal diversity. Microhabitats may, in turn, support forest health by supporting a variety of fungal taxa that play important and functionally diverse roles in nutrient cycling. These microhabitats vary with respect to nutrient availability, soil moisture and presence or absence of pine roots, all of which may serve as important niche-defining characteristics. It is these niche characteristics, many of which often correlate with depth in forest soils, that are likely to shape fungal communities belowground, as opposed to simple distance from the surface. To conclude, this work contributes to a better understanding of the environmental factors that shape fungal communities in this unique habitat, and this understanding could potentially be useful for optimizing pine seedling establishment in planted coastal pine forests.
ACKNOWLEDGEMENTS
We are thankful to Dr Karelyn Cruz-Martinez, Nina Janelm, Maria Johnsson, Christine Källman and Magnus Rosling for laboratory assistance. We also thank Briana Whitaker, Tanya Cheeke and Natalie Christian for valuable feedback on earlier versions of the manuscript.
FUNDING
This work was supported by the European Commission, Marie Curie Actions [LITCOAST MTKI-CT-2006–042622], the Swedish Research Council for Sustainable Development [2015–1504 to AR] and the Department of Forest Mycology and Plant Pathology at the Swedish University of Agricultural Sciences.
Conflicts of interest. None declared.
