


ABSTRACT
Microbes transported by glacial meltwater streams are thought to be a product of passive dispersal from both supra- and subglacial sources, though studies investigating the origins of these assemblages are scarce. Here, we conducted a survey within a large catchment containing multiple glaciers on Qeqertarsuaq (Disko Island), west Greenland, to investigate whether meltwater-exported microbial assemblages in suspended sediments differ between glacial meltwater streams, and if they reflect corresponding bulk subglacial and extraglacial sediment communities. Using 16S rRNA gene amplicon sequencing, we found proglacial stream assemblages substantially differ from one another, despite their close spatial proximity. Furthermore, proglacial stream assemblages were composed of greater proportions of Cyanobacteria compared to bulk subglacial sediment communities, dominated by Betaproteobacteria, demonstrating large contributions of meltwater and microbial cells from supraglacial habitats. Corresponding physico-chemical characteristics of meltwater suggest that streams draining smaller glaciers had more equal contributions of both supra- and subglacial inputs compared with the main catchment outlet, aligning with observed changes in assemblage structure, such as the decreased proportion of Cyanobacteria. These results suggest that glacier size and hydrological drainage systems may influence the structure of exported microbial assemblages, and collectively provide insights into their formation and fate in thiscurrent age of deglaciation.
INTRODUCTION
Microbes play critical functional roles in river and coastal ecosystems, yet much remains to be learned about how microbial assemblages are formed and maintained. This is especially true in the Arctic, where glacial meltwater streams entrain and export supra- and subglacially derived cells, along with terrestrial material from the ice-free landscape, and deliver them to estuaries (Cameron et al.2017a; Dubnick et al.2017). Despite the potential biological (Decho 2000; Fortunato et al.2013; Hauptmann et al.2016; Cameron et al.2017b) and geochemical (Yde et al.2014; Lawson et al.2014a,b; Hawkings et al.2015, 2016, 2017; Kohler et al.2017) implications of these downstream fluxes, studies addressing the formation and structure of exported assemblages are scarce, though vital to understanding the role of glaciers in regional biogeochemical cycling.
Glaciers may host different microbial communities depending on their size and position in the catchment, which affects the proportion and magnitude of microbial inputs to glacial ecosystems from extraglacial habitats (i.e. habitats located adjacent to glaciers) and relative importance of the extraglacial communities compared to autochthonous glacial communities (Edwards et al.2013; Zarsky et al.2013; Stibal et al.2015). Altitude affects the vegetation of the extraglacial habitats and thus may constrain the diversity of microbial communities in contact with the glacial system. The size of a glacier may also influence its basal thermal regime and thus to the seasonal development and configuration of its subglacial drainage system (Irvine-Fynn et al.2011), which has implications for the subglacial community and its meltwater mobilization (Tranter, Skidmore and Wadham 2005; Dubnick et al.2017).
Glacial meltwater streams drain large areas of ice surface. In Greenland, the supraglacial ecosystem itself is colonized by diverse microbial communities (Stibal et al.2015; Cameron et al.2016), which are mobilized by meltwater. Surface meltwater either drains supraglacially to the ice margin, where it entrains moraine or proglacial sediments, or it is routed into the englacial drainage system via moulins and crevasses. At the bed of the glacier, meltwater erodes and entrains subglacial sediment, including its microbial communities (Yde et al.2010; Stibal et al.2012). Glacial meltwater streams thus contain supra-, sub-, and extraglacially derived material as a result (Bhatia et al.2013), including microbial cells (Dieser et al.2014; Cameron et al.2017a; Dubnick et al.2017). Therefore, meltwater stream microbial assemblages may be primarily structured by mass effects (i.e. cell dispersal exceeds effects of species interactions and environmental heterogeneity; Leibold et al.2004), and elucidating the sources of potential cell reservoirs is paramount to understanding patterns in assembly.
Most studies of glacial meltwater assemblages have thus far investigated one or a few contrasting sites (Sheik et al.2015; Dubnick et al.2017), or longitudinal transect variability of a given stream (Hauptmann et al.2016; Cameron et al.2017a). However, no studies to date have elucidated the differences between glaciers within the same catchment as a potential source of variability, despite its potential to help disentangle some of these aforementioned assembly mechanisms. In this study, we investigate two main questions: First, do exported microbial assemblages show significant variability between glaciers within the same catchment? Second, do proglacial stream assemblages reflect the respective bulk subglacial sediment communities?
We hypothesize that if passive transport is the dominant structuring mechanism, then bulk subglacial sediment communities should be a subset of the proglacial stream assemblages. Furthermore, we predict that differences in hydrological drainage and surface area of individual glaciers contribute to observed differences in meltwater assemblages. To address these questions, we utilized a unique catchment with surging polythermal glaciers on Qeqertarsuaq, west Greenland. We sampled both the meltwater microbial assemblages and recently exposed subglacial sediments found adjacent to each stream portal area from the retreating glaciers, for comparison.
MATERIALS AND METHODS
Field site
Qeqertarsuaq (Disko Island), the second largest island in Greenland after Greenland mainland itself, is located in the Disko Bay on the central west coast of Greenland. Kuannersuit Glacier (hereafter ‘KG’, 69°46′ N, 53°15′ W) is an outlet glacier of the island’s largest ice cap, Sermersuaq, located within the Kuannersuit Valley in the island center. The ice-free areas are comprised of Tertiary basalts (Yde, Knudsen and Nielsen 2005), providing glacial meltwater with a reddish-brown color (Hauptmann et al.2016) in high contrast to the porridge-grey meltwater typical of Greenland Ice Sheet rivers draining Precambrian shield bedrock (Cameron et al.2017a; Kohler et al.2017). The KG is part of the Qeqertarsuaq-Nuussuaq surge cluster (Yde and Knudsen 2007), and it recently surged 10.5 km down-valley during the period 1995–98 (Larsen et al.2010). Since the termination of the surge event, the front of KG has been thinning and retreating.
The surrounding glacierized catchments were identified by map and aerial imagery, and individual unnamed glaciers numbered according to their location within the catchment area (Fig. 1). Briefly, Glacier 6 is a high elevation outlet glacier from a small ice cap to the west of KG. It has no record of past surge activity, although its fluted forefield indicates basal fast flow during ice advance. Meltwater from this glacier flows down to a hanging valley floor covered with peaty vegetation, and terminates as a 20 m waterfall and subsequently enters the subglacial drainage system of KG at the bottom of the cliff. Glaciers 10 and 11 are adjacent and located in the northwestern part of the catchment. Glacier 13 is the most distant from the main meltwater river and located in the north-northwestern part of the catchment. Glacier 10 surged in 1953/54, but has receded significantly in recent decades (Yde and Knudsen 2007). Glaciers 11 and 13 are classified as surge-type glaciers due to the presence of distinct surge-diagnostic features such as surface potholes (Yde and Knudsen 2007). The forelands of these glaciers consist of active proglacial outwash plains and a drained ice-marginal lake, which was dammed by KG during the last surge advance of KG. Hence, these three glaciers drain relatively poorly developed soils with presumably low organic content, and drain into the subglacial drainage system of KG from the west.
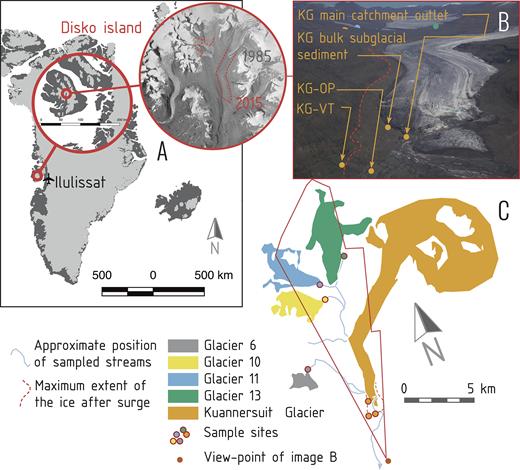
Map and scheme of sampling sites. (A) Position of Kuannersuit Valley in the central part of Disko Island. The red outline indicates the present position of the Kuannersuit glacier and stream, which has advanced since the time the aerial picture was taken (1985). (B) KG sampling sites and the loss of ice mass along the western margin of Kuannersuit glacier between the surge culmination in 1998 and the summer 2015 (dashed red line). (C) Schematic of glaciers interconnected with streams. The red outline shows the cut-out captured by the photograph above.
KG River flows beneath KG downstream of the confluence with these three streams, before emanating from the glacier terminus of KG near to the intersection with an adjacent glacierized valley to the east, where it was sampled (Fig. 1 and Table 1). This main catchment outlet sample site primarily represents a mixture of bulk meltwaters from the sampled sub-catchments and from the KG sub-catchment. The subglacial sediment beneath the recently advanced lower part of the KG is presumably much richer in organic material due to its lower elevation and the long quiescent phase of at least 100 years of the surge-type glaciers on Qeqertarsuaq (Yde and Knudsen 2007). Aerial photos from before the surge event confirm that the valley was covered by vegetation (Yde, Knudsen and Nielsen 2005). The extraglacial areas have abundant vegetation and contain permafrost landforms such as pingos, indicating that these areas have not been affected by any of the most recent surge events. The KG River enters into the fjord (Kangerluk, Diskofjord) approximately 10 km from the glacier portal at the terminus of KG. The GPS positions of sampling sites were recorded using a handheld Garmin GPS device. The glacier surface area covering the catchment area of each respective glacier was calculated from the Google Earth Pro 2015 satellite data using ImageJ 1.43u (Schneider, Rasband and Eliceiri 2012), excluding ice in the slopes with no connection to the main glacier body.
Selected physical parameters of sampling sites (GPS coordinates, altitude, glacier surface area and TSS), water chemistry (pH, conductivity, DOC, TDN and SRP) and gene copy number assessed by qPCR.
| Site | Position | Altitude [m] | Glacier surface area [km2] | TSS [g L−1] | pH | Conductivity [µS cm−1] | DOC [µg L−1] | TDN [µg L−1] | SRP [µg L−1] | 103 gene copies ml−1 |
|---|---|---|---|---|---|---|---|---|---|---|
| Kuannersuit (KG) river, downstream sample site | N69° 41.250′ W53° 17.487′ | 67 | 165 | 1.9 | 8.7 | 13.8 | 190 | 26 | 23 | 0.24±0.15 |
| Glacier 6 | N69° 42.950′ W53° 26.497′ | 770 | 1.5 | 0.1 | 7.2 | 7.9 | 190 | 23 | 9.1 | 64±56 |
| Glacier 10 | N69° 46.003′ W53° 24.804′ | 687 | 7.0 | 0.8 | 8.7 | 7.7 | 150 | 64 | 18 | 2.7±2.0 |
| Glacier 11 | N69° 47.043′ W53° 25.632′ | 693 | 9.7 | 0.2 | 6.9 | 9.9 | 130 | 350* | 18 | 29±7 |
| Glacier 13 | N69° 48.109′ W53° 22.554′ | 720 | 18 | 0.2 | 7.5 | 9.0 | 160 | 70 | 30 | 20±3.3 |
The KG catchment area is located within the continuous permafrost zone (Yde, Knudsen and Nielsen 2005). The mean annual air temperature (MAAT) in the inner part of Qeqertarsuaq is unknown, but it is likely to be lower than −3.9°C, which is the observed MAAT (1960–90) at the coast 50 km to the south of the catchment area (Yde, Knudsen and Nielsen 2005). The glaciers and ice caps on Qeqertarsuaq are considered to be polythermal, consisting of an upper layer of cold ice and an interior at the pressure melting point. Ice-penetrating radar measurements on KG conducted after the surge event indicated the glacier bed was temperate and showed an ice thickness of c. 300 m at the central area of the advanced glacier tongue (Yde and Knudsen 2005). Also, the geothermal heat flux on Qeqertarsuaq is high, as reflected by the presence of warm (>10°C) springs, providing additional energy for melting of basal ice (Hjartarson and Armannsson 2010). Hence, the subglacial drainage systems beneath the glaciers included in this study most likely consist of discrete fast-flow channels and a distributed slow-flow network.
Sampling
Suspended sediment was collected from bulk meltwater exiting the four small glaciers, as well as from the KG River itself, in August 2015. All the streams were sampled in late afternoon (Table S1, Supporting Information), roughly corresponding with diurnal peaks in runoff. Three replicate microbiological samples were taken from the water column near the glacier portal of each site using a sterile syringe. 300 ml of water were passed through a Sterivex filter (Millipore, Billerica, MA, USA) for all sites, except for Glacier 6, where 600 ml was filtered because of the low suspended sediment load. Filtered streamwater samples are hereafter referred to as 'suspended sediments' and the community they captured 'proglacial stream assemblage'. Water was flushed from filters, which were subsequently filled with nucleic acid preservation buffer (LifeGuard, MO BIO, Carlsbad, CA, USA), and stored frozen at −20°C in a portable field freezer.
Subglacial sediments recently exposed by the retreat of the surging glaciers were identified adjacent to each stream outlet to compare to proglacial stream assemblages. Bulk subglacial sediment samples were transferred into sterile 2 ml tubes with an EtOH rinsed, flame-sterilized spatula and treated with nucleic acid preservation buffer (LifeGuard) before being frozen. Additional extraglacial bulk sediment samples were taken from the KG outwash plain (KG-OP, proglacial sediment) during a period of low flow, as well as an old vegetated terrace (KG-VT), which was undisturbed by the last glacial surge, to approximate the ambient regional soil microbiological community (Fig.1). These samples are hereafter collectively referred to as 'bulk sediments'.
Chemical analysis
Conductivity and pH of glacial meltwater were measured in situ with a Multi 3430 Digital pH and conductivity meter (WTW, Weilheim, Germany). Conductivity was measured based on a reference temperature of 25°C for temperature compensation, using a non-linear temperature compensation method. The pH sensor was calibrated with a 4 and 7 two-point buffer calibration before sampling.
A known volume of meltwater (300–500 ml) was filtered through a 47 mm 0.45 µm cellulose nitrate filter (Whatman, Maidstone, UK) in order to assess the total suspended solids (TSS) in meltwater. Filters were dried in an oven overnight at 50°C and weighed, and TSS determined by subtracting the average filter weight.
Meltwater samples were taken alongside suspended sediment samples at each site to determine the chemistry of meltwaters. Samples for nitrate (NO3−), ammonium (NH4+), total dissolved nitrogen (TDN) and soluble reactive phosphorus (SRP) were filtered through a 0.45 µm polyethersulfone GD/XP syringe filter (Whatman) into acid-washed 30 ml Nalgene HDPE bottles and frozen at −20°C until analysis. Nutrient concentrations were determined colorimetrically using a LaChat QuikChem 8500 flow injection analyser (QuikChem Methods 10-107-04-1-B (NO3−), 10-107-06-1-Q (NH4+) and 31-115-01-1-I (SRP)). TDN was determined using the same method as NO3− above, following persulphate digestion (Koroleff 1983). Analytical precision for NO3− and TDN was ± 1.5% (n = 5), for NH4+ was ± 7.3% (n = 6) and SRP was ± 0.1% (n = 6), using a standard within the range of measured samples. Analytical accuracy of gravimetrically weighed standards for NO3− and TDN was −4.7%, for NH4+ was +6.3% and −0.1% for SRP.
Samples for dissolved organic carbon (DOC) were filtered through a 0.20 µm Filtropur polyethersulfone filter (Sarstedt, Nümbrecht, Germany) into acid-washed 30 ml Nalgene HDPE bottles, and immediately frozen at −20°C until analysis. DOC concentrations were determined using a Shimadzu TOC-L analyser (Shimadzu, Kyoto, Japan) with high sensitivity catalyst. Analytical precision was ± 4.4% (n = 5), and accuracy of gravimetrically weighed standard was −5.4%.
Samples for dissolved major ions (F+, Na+, K+, Mg2+, Ca2+, Cl−, SO42−) and dissolved silica were taken with a clean, 1 l triple stream rinsed Nalgene bottle. The water was filtered through a 47 mm, 0.45 µm cellulose nitrate filter membrane (Whatman) mounted on a Nalgene filter tower at the field camp into a 30 ml HDPE Nalgene bottle, and kept refrigerated (∼4°C). Major anions and cations were analyzed simultaneously by ion chromatography on a Thermo Scientific Dionex ICS5000+ capillary system as described by Hawkings et al. (2015), and dissolved silica was measured using a LaChat QuikChem 8500 flow injection analyser (QuikChem Method 31-114-27-1-D) as described by Hawkings et al. (2017). Analytical precision for dissolved silica was ± 0.2% (n = 6), and accuracy of gravimetrically weighed standard was −0.9%. Analytical precision for major cations and ions was < ± 3% (n = 5) for all analytes, and accuracy ranged from −4.3 to +3.1%.
Nucleic acids extraction, quantification and sequencing
RNA and DNA were extracted from the bulk sediment samples using the RNA PowerSoil Total RNA Isolation Kit with the RNA PowerSoil DNA Elution Accessory Kit (MO BIO Laboratories, Carlsbad, CA, USA) following the manufacturer’s instructions. Approximately 2 g (wet weight) of bulk sediment was used for each extraction, and a blank containing 2 ml of DEPC water (MO BIO) was extracted in parallel. RNA was below detection in all samples. DNA from the suspended sediment samples was extracted using the PowerWater Sterivex DNA Isolation Kit (MO BIO) following the manufacturer’s protocol. An unused Sterivex filter was extracted alongside each batch of extractions as a procedural control. The DNA was purified using Genomic DNA Clean & Concentrator (Zymo Research, Irvine, CA, USA) and quantified using a Qubit fluorometer and Qubit dsDNA HS Assay Kit (Invitrogen, Carlsbad, CA, USA).
Prokaryotic 16S rRNA gene copy concentrations in DNA extracts were determined by quantitative PCR (qPCR) using a CFX96 Touch system (Bio-Rad, CA, USA). Reaction mixtures (20 µl) contained 1 µl of template DNA diluted with molecular grade water (MO BIO Laboratories), 10 µl of SYBR Premix DimerEraser (TaKaRa, Kusatsu, Japan) and 0.6 µl of forward and reverse primers (10 pmol µl−1). The primers used were 341F (5′-CCTACGGGAGGCAGCAG-3′) and 518R (5′-ATTACCGCGGCTGCTGG-3′) (Muyzer, De Waal and Uitterlinden 1993). The cycle program was 95°C for 30 s followed by 50 cycles of 95°C for 30 s, 55°C for 30 s and 72°C for 30 s. The reaction was completed by a final 72°C elongation step for 6 min and followed by high-resolution melt curve analysis in 0.5°C increments from 72°C to 98°C. All qPCR reactions were performed in triplicate and were prepared under DNA-free conditions in a pressurized clean lab with an HEPA-filtered air inlet and nightly UV irradiation. Standards of bacterial 16S rRNA genes were prepared by extracting DNA from a serially diluted culture of Escherichia coli. Due to the dilute nature of our samples, potential inhibition due to humic acid or other inhibitory compounds was considered unlikely and was not evaluated.
Template DNA samples were shipped to the Mr. DNA laboratory (Shallowater, TX, USA) where 16S rRNA gene V4 region primers 515/806 with barcode on the forward primer were used in a 28 cycle PCR using the HotStarTaq Plus Master Mix Kit (Qiagen, Hilden, Germany) with an initial melt step of 94°C for 3 min, followed by 28 cycles of 94°C for 30 seconds, 53°C for 40 seconds and 72°C for 1 minute. After amplification, PCR products were checked in 2% agarose gel and the samples were pooled together in equimolar proportions. Pooled samples were purified using calibrated Ampure XP beads. Sequencing was performed on an Illumina MiSeq platform following the manufacturer’s guidelines. Annotated sequence data from this study are available through GenBank access codes in Table S2 (Supporting Information) and the quality checked dataset is available in the MG-RAST database (Meyer et al.2008) under the accession number mgp83892.
Bioinformatic analysis
Sequence data were analyzed by the pipeline SEED v2.0.4 (Větrovský and Baldrian 2013). Paired ends were joined by fastq-join (Aronesty 2011). All of the sequences with mismatches in tags were removed from the dataset. Chimeras were detected and the non-chimeric sequences were clustered into operational taxonomic units (OTUs) using UPARSE implementation in USEARCH 8.1.1861 (Edgar 2013), with a 97% similarity threshold. The consensus from each OTU was constructed from an MAFFT alignment (Katoh, Asimenos and Toh 2009), based on the most abundant nucleotide at each position. The OTUs with an abundance of at least 2% in at least one sample were identified, their putative metabolism and ecological role were assessed by megaBLAST and BLASTn algorithms against the GenBank nt/nr database. OTUs identified as obvious PCR contaminants (i.e. human pathogens, organisms strikingly incompatible with the glacier environment, and known contaminants of DNA isolation kits) were deleted. One replicate of KG suspended sediment was completely removed from further analysis due to having roughly a tenth of the sequences of the other two KG replicates and a high proportion of obvious contaminants.
A phylogenetic tree was constructed using non-singleton bacterial and archaeal 16S rRNA gene sequences under the GTRCAT model in RAxML (Stamatakis 2014). The tree was used in phylogenetic dissimilarity calculations, and UPGMA clustering of the communities performed in Mothur (Schloss et al.2009). The pairwise dissimilarities of the microbial communities (weighted UNIFRAC) were used for a comparison of variability both within the proposed microenvironments and among them. Microbial biodiversity was quantified by calculating OTU richness and the Shannon–Wiener Diversity Index (SWDI).
Statistical analysis
Multivariate analyses were performed with the Canoco 5 software (ter Braak and Šmilauer 2012) in order to analyze potential drivers of microbial community dissimilarity in our study. An NMDS of UNIFRAC distances was performed with no variation estimate and projection to three axes, where the first two axes were displayed in the plots in order to visualize the dissimilarity among samples, both between all samples compiled, and for suspended sediment samples only. To find the main drivers of assemblage structure, we used a distance-based redundancy analysis (db-RDA) with forward selection. The input data for the db-RDA were the weighted UNIFRAC square matrix of all types of sediment, and explanatory variables loaded into the global model included glacier name, sediment type (bulk subglacial, outwash plain, vegetated terrace, or suspended) and glacier surface area (log-transformed) as the explanatory variables. The ‘source area’ for bulk samples was estimated as infinitesimally small (10 m2) compared to the total catchment size (258 km2) in order to capture contrast between the microbial assemblage sources. For testing the difference between variability represented by suspended and bulk sediments, the db-RDA was performed without the outwash plain and vegetated terrace samples, which did not have a corresponding suspended sediment sample. The P values were adjusted using false discovery rate.
RESULTS
Physico-chemical characteristics
The estimated glacier surface areas ranged from 1.5 km2 (Glacier 6) to >165 km2 for the KG catchment, which includes all the other glaciers studied and some additional minor glaciers. The post-surge area of KG itself has been estimated to ∼103 km2, while the total catchment area of KG is ∼258 km2 (Yde and Knudsen 2005). The glacial meltwater streams varied in chemical characteristics, as shown in Table 1 and in more detail in Table S1 (Supporting Information). Glacier 6 had the lowest nutrient concentrations and conductivity (NH4+, NO3−, TDN and SRP) among all glacier streams, and the conductivity, NH4+, SRP and TDN concentrations in meltwater stream waters generally increased with glacier surface area. The pH of the streams ranged from 6.9 (Glacier 11) to 8.7 (KG). One water sample (Glacier 11) was abnormally elevated in TDN, probably due to contamination, and the sample is marked with an asterisk in Table 1. The TSS concentration of 1.9 g L−1 in the KG river was more than 5-fold the average value in other glaciers in the sub-catchments, indicating that soil and sediment from the proglacial area covered by the glacier surge are mobilized by the KG river, causing enhanced TSS concentrations more than 15 years after the termination of the surge event. However, the TSS concentration is low compared to the TSS concentrations of 1.9–8.1g L−1 (mean TSS concentration of 4.0 g L−1) observed during the initial post-surge phase in 2001 (Knudsen, Yde and Gasser 2007), suggesting that the sediment supply is abating as a function of time after the surge event.
Community composition and diversity
The qPCR revealed the lowest gene copy concentrations in the KG river (235 ± 147 gene copies ml−1 stream water) in compare to other tributaries (mean 28,962 ± 1372 gene copies ml−1). In total, we determined 12 929 OTUs at a 97% similarity level among 1 824 128 sequences from 28 samples. The sequencing depth in analyzed samples varied from 1960 to 141 932 sequences per sample. After rarefaction, the total number of OTUs identified within the whole sample set was 3467. Of these, 2320 (67% of the total number of OTUs) were found in suspended sediment samples, 980 (28%) in bulk subglacial sediment samples, 480 (14%) in fresh bulk proglacial sediment (KG outwash plain) and 1203 (35%) in extraglacial soil (KG old vegetated terrace). Relative abundances of bacterial (and one archaeal) phyla in suspended and bulk sediment samples are provided in Fig. S1 (Supporting Information) and the proportions of shared OTUs among different habitats are shown in Fig. 2. Suspended sediment shared 511 OTUs (15% of the total) with bulk subglacial sediments, 273 OTUs (8%) with the fresh bulk proglacial sediment and 750 OTUs (22%) with the vegetated soil samples. Subglacial sediments shared 291 OTUs (8%) with the fresh subglacial sediment and only 303 OTUs (9%) with the extraglacial soil. The KG River samples had similar SWDI (4.5 and 5.1; Fig. 3) as the tributary streams (4.9 ± 0.17, n = 12), and lower OTU richness (193 and 444) than the tributary streams (488 ± 65, n = 12).
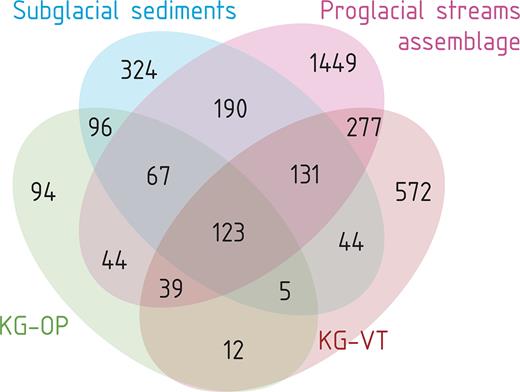
Venn diagram showing the shared and habitat-specific OTUs in subglacial sediment (five samples in duplicates), proglacial streams assemblage (five samples in triplicates), outwash plain and vegetated terrace (one sample each in duplicates).
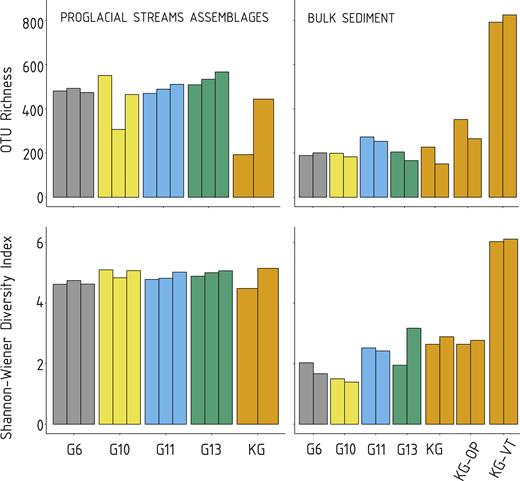
OTU richness and Shannon-Wiener index for proglacial streams assemblages (left) and bulk sediment samples (right). The colors match the scheme in Fig. 1. KG old vegetated terrace is marked as KG-VT and KG outwash plain as KG-OP.
Marked differences in alpha diversity were observed between the suspended and bulk subglacial sediment samples (Fig. 3). Average OTU richness reached 463 OTU per sample in suspended sediments and 306 OTU per sample in bulk subglacial sediments. The highest diversity was observed in the KG old vegetated terrace sediments (Fig. 3). These sediments also showed the lowest proportion of OTUs exceeding 5% of the respective sample (Fig. S1, Supporting Information), and therefore the greatest OTU evenness.
The most abundant bacterial OTU in all bulk subglacial sediment samples (∼21% of sequences) was Rhodoferax sp., a common facultatively anaerobic heterotroph capable of phototrophy (Table S2 and Fig. S1, Supporting Information). In the suspended sediments, the highest number of sequences (∼8.7%) was attributed to the cyanobacterium Loriellopsis sp. In general, Cyanobacteria (mean ± st.dev.: 10% ± 2.8%), and Verrucomicrobia (26% ± 8.0%), were abundant in suspended sediments, but rare (1.7% ± 4.2% and 0.4% ± 0.2%, respectively) in bulk sediments, suggesting that members of these phyla were washed from the glacier surface and did not come from subglacial sediments. The remaining microbes were mostly common heterotrophic bacteria, including the facultatively phototrophic Rhodobacter spp. Only a few OTUs were related to strictly anaerobic microorganisms (Propionivibrio sp., Opitutus sp., Chloroflexi members). Several methylotrophic taxa were identified (Methylophilus sp., Methylopila sp., Methylobacterium sp.). Archaea were rare, the exception being Nitrososphaera sp., representing ∼5% of sequences in one bulk subglacial sediment sample from Glacier 13.
Community similarity
The UNIFRAC distances projected using NMDS (Fig. 4) showed tightly clustered suspended sediment samples surrounded by bulk sediment samples (including subglacial as well as extraglacial bulk sediment samples) with largely varying distances even among replicates (Fig. 4A). The NMDS of suspended sediment samples only (Fig. 4B) showed greater similarity between replicates from the same location compared to that between localities. Axis 1 (i.e. the x-axis) was associated with glacier size, with glacier six samples (the smallest glacier from our study) located farthest to the left, while KG glacier samples (the largest glacier from our study) were located farthest to the right.
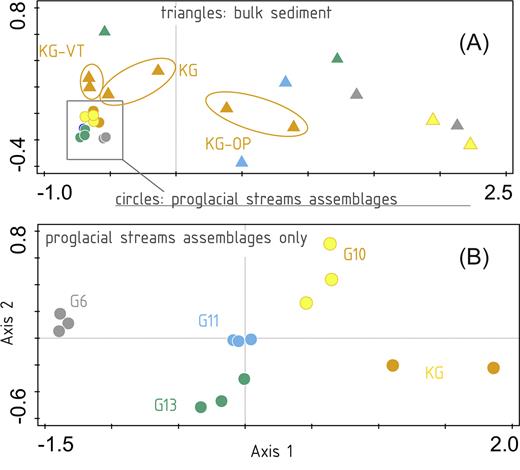
NMDS plots of all samples (A) based on UNIFRAC distances demonstrating the difference in variability of proglacial streams assemblage (circles) and bulk sediment samples (triangles), (B) variability of proglacial streams assemblages from different glaciers only. The colors of symbols correspond to the map in Fig. 1.
The db-RDA explained 51% of the total variation in the data. Sediment type explained 35.4% (contribution 54.3%, pseudo-F = 14.3, P = 0.012) and glacier surface area 8.2% (contribution 12.6%, pseudo-F = 4.6, P = 0.024) of the total variation. Glacier name was not a significant factor and was removed in the forward selection. When only bulk subglacial sediment samples were tested, the same explanatory variables accounted for 56.8% of total variability, with 45.2% explained by sediment type (contribution of 73.4%, pseudo-F = 18.2, P = 0.008) and 8.1% by surface area (contribution 13.1%, pseudo-F = 3.6, P = 0.06).
DISCUSSION
We investigated microbial assemblages from a network of five Arctic glaciers differing in their surface area by almost two orders of magnitude (from 1.5 to >165 km2) to assess whether suspended assemblages in meltwater streams reflect corresponding bulk subglacial sediment communities, and whether they differ between glaciers within a catchment. Our results show substantial overlap in the OTUs between assemblages from all studied sediment types. Suspended and bulk subglacial sediments shared a substantial proportion of OTUs (52% of the bulk subglacial sediments OTUs), while habitat-specific OTUs were also identified. The bulk subglacial sediments also exhibited higher variability in community composition and lower diversity compared with suspended sediments. While suspended sediment samples were more similar to each other, substantial variability was observed, much of which likely reflects differences in glacier size, affecting hydrological drainage patterns and thus supra- and subglacial contributions. Collectively, these observations provide valuable insights into processes influencing the composition of cells exported by glacial meltwater.
Sources of proglacial stream assemblages
We propose that the diversity of glacially exported microbial assemblages is driven by the diversities of the source communities in the extra-, supra- and subglacial environments, and subsequently, the passive process of mixing of these sources. In support of this, tributary meltwater assemblages in our catchment contained greater proportions of Cyanobacteria than the KG River and were more dilute in solutes, both of which indicate elevated inputs from supraglacial or adjacent terrestrial habitats, since we expect Cyanobacteria to indicate source habitat permitting photosynthesis. Conversely, the KG River had low measured abundances of Cyanobacteria, high solute concentrations, and was by far the most sediment-rich stream sampled (1.93 g l−1 vs. 0.32 g l−1 average TSS in other streams). Therefore, it is likely that KG River exported proportionately more subglacial microbes than the smaller tributary glaciers, and this greater homogenization of source limited its microbial diversity captured in our main catchment outlet samples. Yet, even though the KG suspended sediment source may have been more homogeneous, it was sourced from a larger geographic area, and thus a greater number of OTUs may have been released from this subglacial environment than the much smaller subglacial environments of the tributary glaciers.
Differences between habitat types
The mean proglacial stream microbial diversity was almost twice as high as that of bulk subglacial sediments. This likely reflects the inherent qualities of and differences between the samples types, with proglacial stream assemblages being sourced from large areas of both supra- and subglacial habitat, while the bulk sediment samples representing points in the subglacial habitat only. While the use of different DNA extraction kits could partially contribute to these differences, and thus they should be interpreted with caution, we argue that the consistent and intuitive outcomes from our study, which are a function of the conspicuous differences between sample types, are likely to persist despite methodological differences.
Our results show proglacial stream assemblages were distinct from the corresponding bulk subglacial and extraglacial sediments, yet shared almost 38% of their OTUs with other habitats. Our OTU numbers were not corrected for sample numbers for different habitats, including the underrepresented extraglacial samples (namely the vegetated terrace and outwash plain, both represented only by one sample in duplicate), so the higher OTU richness of suspended and bulk subglacial sediments relative to the vegetated terrace and outwash plain sediment almost certainly reflects the higher number of samples collected from the former. Where the sample numbers are comparable, there was an almost 5-fold higher proportion of habitat-specific OTUs in suspended sediment than in bulk subglacial sediment. This is almost certainly due to the entrainment of upstream microbial communities sourced from habitats that were not captured by our bulk sampling, e.g. from supraglacial habitats and adjacent extraglacial sources, and from a wider range of subglacial habitats spanning redox gradients.
The overall low abundance of anaerobes in the bulk subglacial sediments, was not surprising given the dynamic nature of this environment, with possible pulses of oxygen-rich water from the surface, favoring the facultative anaerobes even in predominantly anaerobic conditions (Yde et al.2010; Stibal et al.2012; Dieser et al.2014). This is supported by the high abundance of Rhodoferax, a facultative anaerobe (Hiraishi, Hoshino and Satoh 1990; Finneran, Johnsen and Lovley 2003) typical of the subglacial environment (Foght et al.2004; Skidmore et al.2005; Yde et al.2010; Nixon et al.2017), detected in both suspended sediment and bulk subglacial sediment samples.
The extraglacial samples represent communities potentially sourced from glacial habitats at different timescales, from hours and days to centuries and millennia, respectively. Approximately 40% of the outwash plain and 75% of the vegetated terrace OTU pools were absent in the bulk subglacial sediments, which reflects the establishment of new community members during the process of ecological succession. However, the higher evenness of the vegetated terrace community structure would presumably result in a faster increase of new OTUs with increasing sequencing depth or number of replicates compared to other sediment types. The relatively high proportion of vegetated terrace OTUs observed also in suspended sediments (nearly 50%) and the low (15%) proportion of OTUs shared with the outwash plain community demonstrate a potential similarity of developed soils and other extraglacial sources in the upstream regions of the catchment. This suggests a possible contribution of adjacent terrestrial habitats to the proglacial stream microbial pool.
Assemblage formation in stream networks
Suspended streamwater microbial diversity is predicted to decrease downstream as the stream widens due to a proportional reduction in lateral versus distal connectivity (Savio et al.2015), and this pattern appears to hold true in glacial stream systems as well. For example, Cameron et al. (2017a) showed minimal alterations of prokaryotic assemblage structure between meltwater generated from the Greenland Ice Sheet in southwest Greenland to its estuary ∼30 km downstream, indicating an overall lack of downstream assemblage-structuring mechanisms aside from passive transport (i.e. mass effects). In another study conducted on Qeqertarsuaq (approximately 50 km south and not connected to our study system), proglacial stream bacterial assemblages were sampled over the longitudinal length of the Red River to its mouth, and the authors similarly found diversity to decrease downstream, despite the addition of two tributaries to the main river (Hauptmann et al.2016). Furthermore, proglacial stream assemblages shared a substantial fraction of taxa with the terrestrial community, which is consistent with past work in other localities (e.g. Crump, Amaral-Zettler and Kling 2012).
In this study, we found that the KG River, which drains four tributary glaciers, had similar or lower diversity than the inlet streams that drain into it, rather than exhibiting an accumulation of OTUs downstream, despite its much greater hydrological catchment area. These results might be anticipated based on the abovementioned studies, as well as given the high suspended sediment concentration and discharged meltwater from the glacier compared with the proportionately minor quantities entering the river from the surrounding landscape and tributary glaciers. However, it must be noted that KG River samples also produced the lowest numbers of sequences per sample in our study, likely due to the high sediments loads, which can interfere with and inhibit DNA extraction. Therefore, it is likely that the diversity of our downstream KG River samples was underestimated, and more research on this topic in the future is necessary to validate these results.
CONCLUSIONS
Our results from a glacierized catchment on Qeqertarsuaq (Disko Island) suggest that microbial assemblages in glacial meltwaters are shaped through the mobilization of available source material, as reflected in the OTU overlap between suspended sediment and bulk subglacial sediment samples. Understanding how these meltwater assemblages are structured is important for understanding the biogeochemistry and trophic relationships of hydrologic systems throughout the Arctic, as evacuated cells may have important ecological roles downstream. These findings improve our understanding of microbial export from glacierized catchments, and contribute to future efforts to delimitate the fate of microbial communities in the current age of deglaciation.
SUPPLEMENTARY DATA
Supplementary data are available at FEMSEC online.
ACKNOWLEDGEMENTS
We thank Alex Anesio, Pia Bach Jakobsen, Pernille Stockmarr, Jasna Vukić, Scot Dowd at Mr. DNA, and the mosquitos at Camp Diskomfort.
Author Contributions: JDZ, TJK, JCY and MS designed the study and performed the fieldwork. JDZ, GLG and TJK extracted DNA and prepared samples for sequencing, LF performed and interpreted bioinformatical analyses, JRH and JEH performed geochemical analyses, JDZ, LF and MS performed statistical analyses, and JDZ, TJK, MS and LF wrote the manuscript with contributions from all authors.
FUNDING
This research was supported by a Czech Science Foundation Junior Grant (GACR 15-17346Y) and Charles University Foundation (GAUK 279715). TJK was supported by Charles University Research Centre program No. 204069.
Conflict of interest. None declared.
