


Abstract
It is well documented that antibiotics have pronounced modulatory effects on the intestinal bacterial community of both humans and animals, with potential health consequences. The gut microbiota of mink has however attracted little attention due to low bacterial load and fast gastrointestinal transit time, questioning its relevance. In this study, we hypothesise that oral amoxicillin treatment affects the gut microbiota in mink. This was investigated in a controlled trial including 24 animals of which 12 were treated with amoxicillin for 7 days. By applying 16S rRNA gene sequencing, we found that the faecal microbiota was markedly altered already after 2 days of treatment, with a surprising increase in diversity to resemble the feed. The diversity within the mucosa at termination was however reduced, which indicates this compartment as an important colonisation site in mink. No impact on blood biochemistry, lipid metabolism, serum amyloid A, vitamins A and E and histomorphology of the gut and liver was found; however, a slight decrease in fat digestibility was observed. We suggest that early-life use of amoxicillin in mink production may be counteractive as dysbiosis of the microbiota during infancy is increasingly being recognised as a risk factor for future health.
INTRODUCTION
The rich microbial community residing in the intestinal tract of humans and animals is collectively termed the gut microbiota. There is a growing body of evidence manifesting that the function of this gut microbiota is not only restricted to general digestion of nutrients in the intestine but also plays a tremendously important role in relation to general health including programing of the immune system especially in early life (Matamoros et al.2013; Albenberg and Wu 2014; Round and Mazmanian 2014). In addition, the gut microbiota has the capacity to synthesise vitamins B and K (LeBlanc et al.2013), deconjugate bile acids (Jones et al.2008) and produce short chain fatty acids and antimicrobial compounds, which overall may limit pathogen colonisation and proliferation (Kamada et al.2013). Perturbation of the intrinsic balance between the hundreds of different species within this ecosystem is especially profound following exposure to antimicrobial compounds, and it is well established that oral antibiotic treatment may cause large shifts in intestinal bacterial community composition in humans (Panda et al.2014), rodents (Tulstrup et al.2015) and numerous other animals representing both vertebrate (Grønvold et al.2010) and invertebrate species (Raymann, Shaffer and Moran 2017). The effect of antibiotic treatment on the gut microbiota is highly dependent on the class and spectrum of the drug in question (Tulstrup et al.2015), and different studies have demonstrated both short- and long-lasting effects of antibiotics not only on pathogens but also on the resident gut microbiota (Cochetière et al.2005; Jernberg et al.2007; Dethlefsen et al.2008). The extent of the disturbances additionally depends on the dose and the route of administration as well as the general pharmacokinetic and pharmacodynamic properties of the drug (Edlund and Nord 2000; Sullivan, Edlund and Nord 2001).
To date, very few studies have investigated the effects of antibiotics on the gut microbiota in carnivorous animals (Suchodolski et al.2009; Grønvold et al.2010), and to our knowledge, no studies have specifically investigated the impact of antibiotics on farm mink (Neovison vison). Recently, high-throughput techniques using 16S rRNA gene sequencing of mucosa-associated intestinal samples obtained from mink have showed that the gut microbiota in adult mink is commonly dominated by bacteria belonging to the phylum Firmicutes (especially the class Clostridia) with few Bacteroidetes, but may also contain high numbers of both Proteobacteria and Fusobacteria (Bahl et al.2017). The dominance of Firmicutes is in accordance with similar studies sequencing faecal samples from cats and dogs (Handl et al.2011; Garcia-Mazcorro et al.2012), indicating that mink may be a useful animal model for studying other carnivorous animals as well. Mink have a relatively short intestinal tract and a fast gastrointestinal transit time of 3–5 h (Bleavins and Aulerich 1981; Szymeczko and Skrede 1990). A bacterial density up to 108 CFU g−1 has been detected in the colon of mink, which is much lower than numbers of bacteria found in many other mammals including dogs (Davis et al.1977; Williams, Buddington and Elnif 1998). Collectively, these characteristics could suggest a relatively restricted effect of antibiotics administered orally on the gut microbiota.
In Danish mink production, the largest amount of antibiotics is used during the lactation period in May–August (Chriél et al.2012; Jensen et al.2016). At this stage, mink kits have a thinner mucus layer lining the gut wall, different enzyme-related properties in the gastrointestinal tract (Hedemann, Clausen and Jensen 2011), and a different microbial community composition compared to adult mink (Williams, Buddington and Elnif 1998) potentially making them more sensitive than adult animals. The broad-spectrum antibiotic, amoxicillin, is the most frequently used antibiotic in mink and is utilised for treatment of various infectious diseases including diarrhoea, urinary tract infections, pneumonia, pleuritis and abscesses (Pedersen et al.2009; Chriél et al.2012). Reports of antimicrobial use in mink in recent years reveal that the oral administration route constitutes 98% of the antimicrobial use measured in defined animal daily dose (Jensen et al.2016). Since oral administration of antimicrobials for mink may involve treatment of either part of or the entire farm, including both sick and asymptomatic animals, there is a need to understand the potential impact of the oral antimicrobial administration on the microbiota of the healthy mink gut.
This study was designed to investigate the induced changes in the bacterial community composition of the gut microbiota as well as changes related to biochemical profile, vitamin A and E levels, lipid metabolism, levels of acute phase reactant serum amyloid A, and histomorphological parameters in the gut and liver following a standard treatment period of 7 days with daily oral amoxicillin administered to clinically healthy growing male mink.
MATERIALS AND METHODS
Ethical statement
All institutional and national guidelines for the care and use of laboratory animals were followed. The handling of the animals and the experimental procedures were approved by the Danish Animal Experiments Inspectorate (licence no. 2016–15-0201–00965) and all personnel involved in handling and care of the animals were trained for carrying out animal experiments (FELASA certification).
Animals and housing
The study was carried out at the Danish Fur Breeders Association research farm, Kopenhagen Fur, Holstebro, Denmark from 12 to 26 September 2016. Twenty-four male mink (Neovison vison) at 4.5 months of age of the colour type brown (also referred to as colour-type wild) were selected for the study. The mink were all littermates in pairs from 12 different litters with a minimum of five kits. The average body mass was 2809 ± 300 g (mean ± SD) with 584 g as the maximum body mass variance between siblings. All animals had received standard vaccinations (Distemink® Vet., Biovet ApS and Biocom-P Vet., Biovet ApS) at the age of 10 weeks and the farm was tested negative for Aleutian disease virus. The mink were housed indoors individually in metabolic cages modified from Jørgensen and Glem Hansen (1973) with the possibility for manual ventilation. The average ambient temperature and humidity was 21 ± 1.8°C and 68.3 ± 4.2%, respectively. All mink were fed 180 g of a diet produced at the local central of feedstuff once a day in the morning and had free access to tap water. The same batch of feed was used throughout the entire study.
Experimental design
The study was designed as a parallel group experiment. Mink were allocated in two groups by randomised stratification with one littermate in each group (Fig. 1). Amoxicillin (Octacillin Vet. 800 mg g−1, amoxicillin trihydrate corresponding to 697 mg amoxicillin), 20 mg kg−1, was administered orally to the treatment group (AMX) from day 0 and for seven consecutive days while no treatment was given to the control group (CON). The antimicrobial compound was mixed in the feed ration. General health checks were made in the morning and afternoon throughout the study.
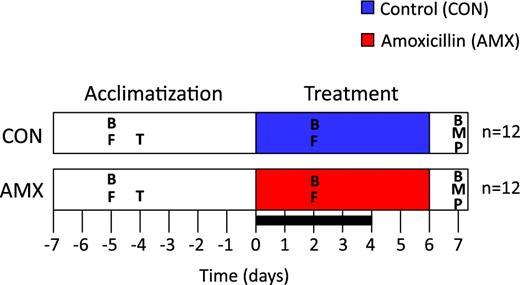
Timeline of experimental period. The acclimatisation period was from day 7 to day 0 and treatment period from day 0 to day 6. All animals were euthanised on day 7. Blood samples (B) as well as faecal samples (F) and mucosal samples (M) were collected as indicated. Gastrointestinal transit time analysis (T) was performed on day 4, and pathological examination (P) was performed during dissection. A digestibility trial (box) was performed from day 0 to day 4 during the treatment period.
Gastrointestinal transit time
On day 4 (relative to the antibiotic intervention), a study of the feed transit time was conducted to verify that the transit time in the gastrointestinal tract (GI-transit time) did not differ between the two groups before the intervention (Fig. 1). All mink received 100 plastic Hama beads (2.5 × 2.5 mm, assorted colours, Malte Haaning Plastic A/S), which have been used as a marker of GI-transit time elsewhere (Hernot et al.2005). The beads were mixed in 50 g of feed in the morning. When the 50-g ration was ingested or after 1 hour the rest of the daily ration without beads was given. Two hours after beads were ingested the mink started defecating, and faeces were collected every 15 min. Beads were counted after washing the faeces in a sieve under running water. The time lapse until the first bead appeared in the faeces was considered the feed transit time for the individual animal.
Collection of blood and faeces and biochemical analyses
On days 5, 2 and 7, blood was obtained by puncture of vena cephalica antebrachii and directly transferred to EDTA-coated (plasma) and non-coated (serum) tubes (BD Vacutainer Systems, Preanalytical Solutions, Belliver Industrial Estate, UK). Tubes were centrifuged at 2000 g for 10 min, and isolated plasma and serum was transferred to 0.5-ml eppendorf tubes, respectively. Samples for analysing biochemical parameters in serum as well as parameters related to lipid metabolism in plasma were kept at 5°C and analysed by Advia® 1800 Clinical Chemistry System, Siemens, at Centrallaboratoriet, Department of Veterinary and Animal Sciences, University of Copenhagen, Denmark. Serum samples for analysing acute phase reactant serum amyloid A were stored at –18°C and analysed by a standard ELISA kit (Phase SAA assay, Tridelta Development Ltd, Kildare, Ireland) at the National Veterinary Institute at the Technical University of Denmark. Plasma samples for analysing vitamin A and E were stored at –18°C and subsequently analysed by PerkinElmer Series 200 HPLC System at Foulum, University of Aarhus, Denmark (Jensen, Engberg and Hedemann 1999).
On days 5 and 2, faeces was collected from a sterile plastic drape placed under the cages using disposable forceps and directly transferred to cryovials after voiding (CryoPure Tube 1.8 ml, SARSTEDT, Germany). Samples were kept on dry ice until they were transferred to storage at –80°C. On day 7, all mink were euthanised by initial sedation with a mixture of 0.6-ml ketamine (Ketaminol® Vet. 50 mg ml−1, MSD Animal Health) and medetomidin (Domitor® Vet. 1.0 mg ml−1, Orion Pharma Animal Health) administered intramuscularly followed by an intracardiac injection with 1-ml pentobarbital (Euthanimal 200 mg ml−1, corresponding to 182 mg ml−1 pentobarbital, ScanVet Animal Health A/S).
Digestibility trial
A digestibility trial was performed on all animals during the intervention period day 0–day 4 (Fig. 1). Total faeces from each animal were collected separately once a day in the morning from a clean chute placed under the wire cage. The faeces were transferred to an individual foil tray and stored at –18°C. In addition, feed not consumed was also collected for each animal transferred to a foil tray and stored at –18°C. Accumulated feed weighing between 20 and 100 g at the end of the trial was analysed for content of dry matter. Faeces and samples of the feed were analysed for dry matter, protein, fat and ash. Chemical analysis was made in accordance with EU regulations (Commission Regulation 152/2009) at the analysis laboratory at Dansk Pelsdyr Foder A/S. Calculations of the apparent digestibility was made in accordance with existing literature (Ahlstrom and Skrede 1998).
Dissection of animals
Dissection was performed lege artis immediately after euthanasia. Tissue samples from the liver, the duodenum as well as the colon and the mesenteric lymph node were removed and transferred to 10% neutral buffered formalin prior to processing for histology. Intestinal content obtained from the distal colon was collected and stored as described for faecal samples by the use of a disposable forceps. The collection and storage of mucus (and associated bacteria) was done as previously described (Bahl et al.2017). After processing and haematoxylin and eosin staining, liver sections were graded for hepatic steatosis based on a scoring system applied for classification of non-alcoholic fatty liver disease (Brunt 2007), while the intestine and the mesenteric lymph node were evaluated in the software programme ZEN 2.3 blue edition (Carl Zeiss microscopy GmbH, 2011, Göttingen, Germany) after scanning by Zeiss type Axiostar Plus (Carl Zeiss). For the section of intestine to be evaluated, a minimum of five representative areas on each slide were to be present.
Extraction of bacterial community DNA
Total community DNA from mucus, faeces and feed samples was extracted using the MoBio Power Soil®-htp 96 Well Soil DNA Isolation Kit (MoBio Laboratories, Carlsbad, CA, USA) according to the manufacturer's recommendations, with minor modifications as previously reported (Tulstrup et al.2015). DNA concentrations were measured with the Quant-iT dsDNA HS kit (Life Technologies).
Bacterial community composition and diversity
The bacterial community composition was determined by partial 16S rRNA gene sequencing of the extracted community. DNA amplification of the V3 region was performed following a dual PCR strategy with universal bacterial primers PBU (5΄-CCTACGGGAGGCAGCAG-3΄) and PBR (5΄-ATTACCGCGGCTGCTGG-3΄) as described previously (Bahl et al.2017). Sequencing of the 16S rRNA gene libraries was performed on the Ion OneTouch and Ion PGM platform with a 318-Chip v2. Sequencing was performed by the DTU in-house facility (DTU Multi-Assay Core (DMAC), Technical University of Denmark. Sequencing data were imported into CLC Genomic Workbench (version 8.5. CLC bio, Qiagen, Aarhus, Denmark) and were demultiplexed trimmed to remove barcodes and PCR primers. Quality filtering (maxee 1.5), dereplication, OTU clustering (minsize 2), chimera filtering (RDP_gold database), mapping of reads to OTUs (97% similarity) and generation of an OTU table were done according to the UPARSE pipeline (Edgar 2013), generating a total of 2254 non-chimeric OTUs. Taxonomy was assigned using the RDP multiclassifier ver. 2.10.1 with a confidence threshold set to 0.5 recommended for sequences shorter than 250 bp (Wang et al.2007). A phylogenetic tree was created with FastTree based on PyNAST alignment of representative OTU sequences with an archaea (Methanosarcina) sequence added as outgroup for rooting. In QIIME (Caporaso et al.2010), the OTU table was filtered to exclude OTUs classified as Cyanobacteria/Chloroplast and to exclude OTUs with average relative abundance below 0.005% of the total community (Bokulich et al.2013), resulting in 377 OTUs. Relative taxon abundances and alpha diversity (observed OTUs and Shannon diversity index) and beta diversity based on unweighted UniFrac distances were calculated using QIIME (core_diversity_analyses.py), with the sequencing depth rarefied to 4700 sequences per sample. Sequencing data are deposited in the NCBI Sequence Read Archive with the accession number SRP110733.
Data handling and statistics
Statistical analysis was performed in GraphPad Prism (version 7.0b; GraphPad Software Inc., La Jolla, CA). Differences between groups were assessed by paired t-test, unpaired Student's t-test or t-test with Welch correction if data had unequal variances. For non-parametric data, Mann-Whitney, Wilcoxon or Fischer's exact test was used as appropriate. Levels of biochemical blood parameters and vitamins were compared between groups on separate days (day 5, day 2 and day 7) as well as through a trend analysis comparing differences between the sampling days. Levels of acute phase reactant serum amyloid A and parameters related to lipid metabolism were compared between the two groups at the end of the study (day 7). Statistical significance threshold was set at P < 0.05. Identification of differentially abundant bacterial taxa based on 16S rRNA gene sequencing was performed by permutation-based tests adjusting for multiple comparisons, with a false discovery rate threshold q = 0.05 (Pike 2011).
RESULTS
Effects on the host animals
No morbidity or mortality was recorded during the animal experiment, and no gross pathological findings were recorded in necropsy procedures.
At day 4 prior to the intervention, no differences were found in gastrointestinal transit time between the CON group and the AMX group (2.9 ± 0.65 and 3.1 ± 0.98 h, respectively) (Fig. 2A). Generally, mink in both groups lost body mass during the study (day 5 to day 7), but no difference was seen between groups (Table 1) and no significant difference in feed intake was observed during the intervention (Fig. 2B) or before treatment (data not shown).
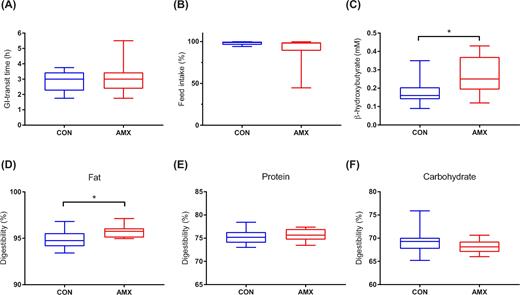
Gastrointesinal transit time calculated at day 4 (A), percentage feed intake during the intervention calculated from day 0 to day 7 (B), serum β-hydroxybutyrate concentration determined on day 7 (C) and digestibility of fat (D), protein (E) and carbohydrate (F) during the intervention (day 0–4). Boxplots show median and first and third quartile for the control group (CON, n = 11–12), and the amoxicillin group (AMX, n = 12) with whiskers indicating range. *P < 0.05.
Animal body mass and histomorphological parameters of the intestine.
| Control group | Amoxicillin group | P-value | |
|---|---|---|---|
| Initial body mass (g)a | 2789 ± 93 | 2829 ± 83 | 0.75 |
| Final body mass (g)a | 2661 ± 86 | 2652 ± 73 | 0.94 |
| p-value | <0.001 | < 0.001 | |
| Duodenum | |||
| Villus-crypt complex (μm)b | 1053 ± 85.6 (n = 12) | 1096 ± 76.2 (n = 11) | 0.78 |
| Goblet cellsc | 27.1 ± 12.0 (n = 12) | 28.7 ± 12.3 (n = 11) | 0.93 |
| Tunica muscularis (μm) | 413.3 ± 15.0 (n = 10) | 424 ± 30.8 (n = 11) | 0.75 |
| Colon | |||
| Crypt depth (μm) | 459.5 ± 25.5 (n = 12) | 409.9 ± 20.2 (n = 11) | 0.15 |
| Tunica muscularis (μm) | 932.7 ± 96.8 (n = 10) | 1117 ± 71.4 (n = 12) | 0.13 |
Body mass measured at day 5 and 7 respectively.
Villus-crypt complex measured from villus apex to the base of the crypt.
Goblet cells counted on a 400 μm piece of villus apex. Means ± SEM are shown.
In this study, no apparent changes in histomorphological parameters related to neither the duodenum nor colon were seen between the two groups after the treatment (Table 1). Furthermore, no reaction in the mesenteric lymph nodes was recorded, and no difference in grading of hepatic steatosis was present between groups (data not shown).
Treatment with amoxicillin for 7 days had no significant influence on uptake of fat-soluble vitamins A and E, the level of acute phase reactant serum amyloid A, nor parameters related to lipolysis e.g. triglycerides and non-esterified fatty acids (data not shown); however, significantly higher levels of β-hydroxybutyrate was found in the AMX group on day 7 (Fig. 2C). There were no differences between groups in the parameters included in the biochemical profile (data not shown).
A slight increase in digestibility of fat was seen in the group of mink receiving amoxicillin when compared to the control group during the treatment period (Fig. 2D–F). Data from one control mink in the digestibility trial were excluded from the study because of extremely abnormal values.
Effects on the microbiota
On day 5 before the treatment period, no differences in the community composition of the faecal microbiota between the CON and AMX groups were observed (Fig. 3 and 4). Furthermore, no differences in alpha diversity indices were found between groups before the intervention (Fig. 5) and also no separation of groups according to beta diversity was seen on day 5 as assessed by principal coordinates analysis (PCoA) of unweighted UniFrac distances (Fig. 6). After 2 days of amoxicillin treatment (day 2), the number of observed species in the AMX group was significantly higher than in the CON group (P < 0.05), and the Shannon index was also higher although not significantly (Fig. 5A and B). PCoA of beta diversity showed that faecal samples obtained from amoxicillin-treated animals on day 2 appeared to cluster together with feed samples and separate from the control animals (Fig. 6B), which is further supported by community composition histograms, where samples from the AMX group day 2 and feed samples appear very similar (Fig. 3). On day 2, the relative abundance of numerous bacterial genera was different between the CON and AMX groups (Fig. 4; Table S1, Supporting Information).
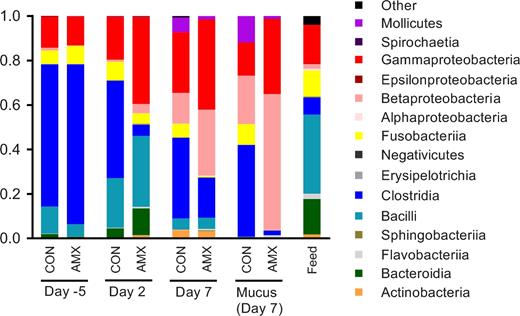
Average bacterial community composition at the class level in faecal samples collected on day 5, day 2 and day 7, as well as in mucus samples obtained on day 7 for the control group (CON, n = 12) and the amoxicillin group (AMX, n = 11–12). The bacterial community composition in feed samples collected at the end of the study (feed, n = 5) is also shown.
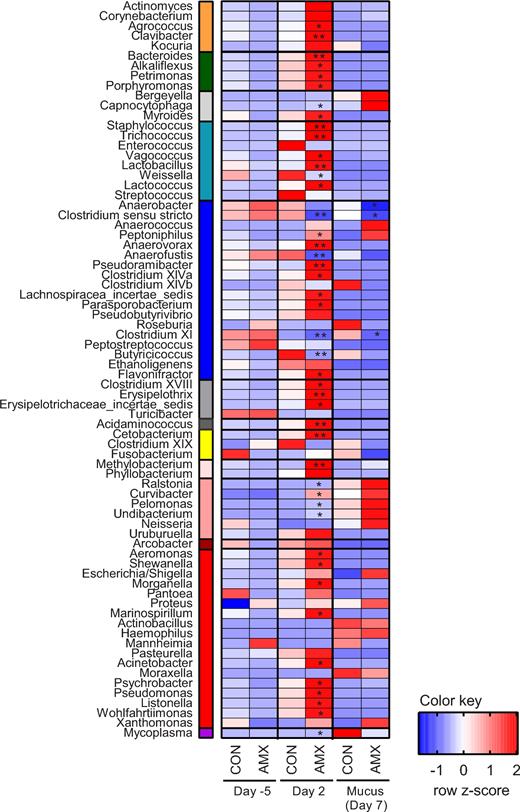
Heatmap of z-scores calculated based on average relative abundance within each row for the control group (CON, n = 12) and the group receiving amoxicillin (AMX, n = 11–12) on day 5, day 2 and mucus sample (day 7). The bacterial genera depicted represent above 25% prevalence collectively in all samples. Asterisks indicate significant difference between the control group and the antibiotic treatment group compared at the same treatment time (FDR-corrected permutation based t-test). *P < 0.05, **P < 0.01. The left-hand colour bar shows the taxonomic classification of bacterial genera at the class level (Orange: Actinobacteria, dark-green: Bacteroidia, light-gray: Flavobacteria, light-blue: Bacilli, blue: Clostridia, grey: Erysipelotrichia, dark-grey: Negativicutes, yellow: Fusobacteria, faint-pink: α-Proteobacteria, salmon: β-Proteobacteria, dark-red: χ-Proteobacteria, red: γ-Proteobacteria and violet: Mollicutes.
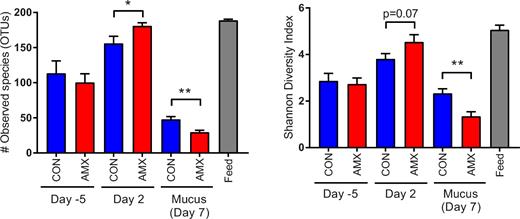
Alpha diversity of the bacterial communities in the faeces samples, mucosal scraps as well as feed samples. Bacterial richness (number of observed OTUs) (A) and Shannon diversity index (B) are shown for faecal samples obtained on day 5 and day 2, mucus samples obtained post mortem on day 7 and feed samples obtained at the end of study. Columns show mean values of the control group (CON, n = 12), the amoxicillin group (AMX, n = 12) as well as feed samples (feed, n = 5) with standard error of the means indicated by error bars. Significant differences between groups are indicated by asterisks *P < 0.05 and **P < 0.01.
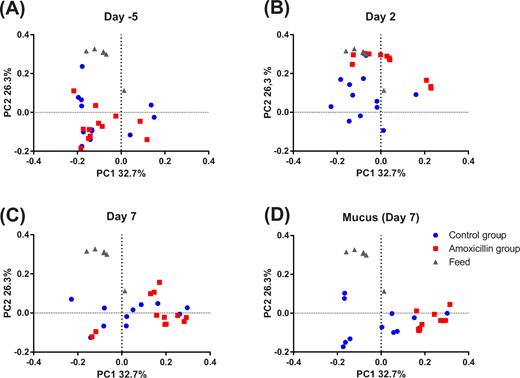
Beta diversity represented as PCoA based on unweighted UniFrac distance matrix at day 5 (A), during the treatment period at day 2 (B), at the end of treatment at day 7 (C) as well as mucusa-associated microbiota samples collected post mortem at day 7 (D). Each dot represents a faecal or mucus sample from individual animals in the control group (blue, n = 12) and amoxicillin group (red, n = 12). Feed samples obtained at the end of the study are also included (grey, n = 5).
Analysis of mucus-associated bacterial community obtained at the end of the treatment period (day 7) revealed significantly lower alpha diversity in the AMX group compared to the CON group in terms of both number of observed species and Shannon diversity index (Fig. 5A and B) which appeared consistent with the community composition analysis based on relative abundance of bacterial classes (Fig. 3) and the separation of the two groups by PCoA (Fig. 6D). Three bacterial genera belonging to the Clostridia class, namely Clostridium sensu stricto, Anaerococcus and Clostridium XI, were found to have a lower relative abundance in the mucus layer in the AMX group compared to the CON group.
No faecal samples were obtained on day 7; however, intestinal luminal samples were taken with disposable forceps directly from the distal part of the colon during the dissection. These samples appeared similar to mucus samples obtained on the same day in terms of bacterial composition (Fig. 3). The same tendency is also seen in beta-diversity (principal coordinate analysis) where intestinal samples from day 7 and mucosa samples from day 7 appear to be similar (Fig. 6C and D), which may be due to the fact that the colon contained a sparse amount of luminal content making it difficult to avoid collecting mucus in those samples. For this reason, luminal samples obtained from day 7 are not included in further analysis, as they are not deemed comparable to faecal sample taken on day 5 and day 2.
DISCUSSION
To our knowledge, this is the first study to demonstrate that the intestinal microbial community composition of mink changes considerably during treatment with amoxicillin. However, during the short-term intervention, no changes in parameters included in the biochemical profile, vitamin A and E levels, level of acute phase reactant serum amyloid A, parameters related to the general lipid metabolism nor histomorphological parameters related to the gut nor the liver were observed. The general loss in body mass observed in both groups may be due to a less intensive feeding strategy as well as stress factors during the study period.
No difference in GI-transit time was observed prior to the intervention and the community composition in the faecal microbiota between the two groups before the intervention did also not differ (Figs 2–4). Thus, the observed difference in microbiota composition during the administration of amoxicillin is a direct consequence of treatment. The early onset of changes in the gut microbiota after 2 days of treatment with amoxicillin is consistent with other studies (Cochetière et al.2005). The observed increase in alpha diversity in the faecal microbiota after 2 days of treatment (Fig. 5) was surprising and not consistent with previous studies in dogs, rats and humans, which all show a significantly decreased microbial alpha diversity after treatment with β-lactams and vancomycin (Grønvold et al.2010; Panda et al.2014; Vrieze et al.2014; Tulstrup et al.2015). In this study, we find it very likely that the inhibitory effect of amoxicillin combined with the very fast intestinal transit time in mink and the high bacterial load associated with mink feed (Bahl et al.2017) result in a population structure in faecal samples from amoxicillin-treated animals comparable to that found in the feed. As mink feed has a relatively high microbial alpha diversity in terms of both number of observed species and Shannon diversity, this results in an apparent increased count of observed species in these animals, which is thus a reflection of allochthonous microbes from the feed ingredients (Savage 1977). Interestingly, within the mucosa the amoxicillin treatment has the opposite effect of reducing the alpha diversity significantly (Fig. 5) which is consistent with other studies (Grønvold et al.2010; Panda et al.2014; Vrieze et al.2014; Tulstrup et al.2015). Within the mucosa (day 7), a couple of specific genera within the Clostridia were found to be affected by the amoxicillin treatment after correcting for multiple testing, which is supported by the global shift in community composition (Fig. 6D); however, a much more pronounced effect was found at the genera level in the faecal samples obtained on day 2 (Fig. 4). This supports the notion that genetic material detected in the faecal samples on day 2 (AMX group) is predominantly from feed-associated bacteria and thus not colonising microbes. To investigate whether these bacteria are living or dead, a quantification of genetic material could have been applied as performed in other studies (Pérez-Cobas et al.2012). The observed effects within the mucosa-associated bacteria (Figs 3, 4 and 6) occur despite the very fast GI-transit time in mink (Bleavins and Aulerich 1981; Szymeczko and Skrede 1990) allowing limited time for uptake or direct effect of antimicrobials administered in the feed. The observed faecal microbiota in the mink may be partly driven by the resident bacterial community in the mucosa and partly by feed-associated bacteria. We therefore speculate that the colonising microbiota associated with the mucus layer is substantially inhibited by amoxicillin on day 2 since the composition ingested appears similar to that detected in the faeces. An increased renewal of the colonic mucosa is essential given the fast GI-transit time. This is consistent with a recent study showing that a fast transit time is associated with an increased mucosal turnover in the gut and generally related to the bacterial composition and diversity (Roager et al.2016). As there is a link between gastrointestinal-transit time and bacterial composition and diversity, it would have been interesting to have investigated transit time during the treatment period as well.
The elevated level of β-hydroxybutyrate in the AMX group could be caused by reduced appetite in this group even though no significant difference in feed intake was observed (Fig. 2). Fasting is known to induce lipolysis from adipose tissue and the formation of ketone bodies (VanItallie and Nufert 2003); however, no alterations in triglycerides or non-esterified fatty acids were observed as would have been expected in the case of a physiological reaction to fasting (Mustonen et al.2005; Rouvinen-Watt et al.2010).
In this study, no changes were seen in histomorphological parameters related to the gut and the liver regarding characteristics of villus-crypt complex, goblet cells, crypt depth, thickness of tunica muscularis or grading of hepatic steatosis, respectively. A previous study with broilers, which are also characterised by having a fast GI-transit time (Ferrando et al.1987), reported increased villus height and improved performance, in terms of significant weight gain after antibiotic growth promoter administration (Sayrafi et al.2011).
Maintenance of the host barrier function in the gut is enhanced by the commensal bacterial community, which forms a colonisation barrier by competitive metabolic interactions, occupying intestinal niches and induction of the host immune system (Kamada et al.2013). Furthermore, some metabolites, namely butyric acid, from the digestion of oligosaccharides serve as an important energy source for colonocytes (Wang et al.2012) and modulate tight junctions near the apical surface of epithelial cells (Ohata, Usami and Miyoshi 2005). A compromised barrier function may lead to the invasion of bacteria or bacterial by-product initiating an inflammatory response in the host. Results from this study, however, did not show any increased levels of acute-phase reactant serum amyloid A in the amoxicillin-treated animals, which is a marker of inflammation (Jain, Gautam and Naseem 2011).
In broilers, antimicrobials have been shown to enhance apparent absorption of alpha-tocopheryl acetate (vitamin E) and fatty acids due to decreased deconjugation of bile acids by Clostridium perfringens (Knarreborg et al.2004). In the current study, the amoxicillin-treated animals showed a lower proportion of Clostridium sensu stricto (group containing C. perfringens) and a slightly higher digestibility with no effect on protein or carbohydrate digestibility nor the levels of vitamins A and E. According to Hedemann, Clausen and Jensen (2011), the biliary bile acids are exclusively taurine conjugated, but it is not known to which extent they are deconjugated by the gut microbiota.
It has been reported for laboratory rodents that antibiotic-induced perturbations of the intestinal microbiota may alter the host susceptibility to enteric infection (Stecher et al.2007; Sekirov et al.2008; Endt et al.2010). It would be of great practical relevance for the mink production to investigate whether the observed alterations in the gut microbiota following antimicrobial treatment in mink are associated with increased susceptibility to pathogens. This may especially be relevant in young animals. The current study contributes with useful information regarding experimental design for future studies within this field. Additionally, our findings may contribute to the understanding of gut health in other carnivorous animals subjected to antibiotic treatment.
SUPPLEMENTARY DATA
Supplementary data are available at FEMSEC online.
Acknowledgments
We thank Susanne Kronborg, Bettina Gjedsted Andersen, Elisabeth Wairimu Petersen, Peter Heegaard and Ronja Mathiesen for technical assistance and Marlene Danner Dalgaard at the DTU Multi-Assay Core facility for performing the 16S rRNA sequencing.
FUNDING
This work was supported by the Danish Fur Breeders Research Foundation and the University of Copenhagen.
Conflict of interest. None declared.
