


Abstract
Thraustochytrids are unicellular fungi-like (heterotrophic) marine protists that have long been considered to play an important role in the biogeochemical cycles of the coastal oceans. However, the significance of their ecological functions and their diversity in marine ecosystems remain largely unknown. In this report, we examined the spatial and temporal variations of planktonic thraustochytrids, their relationship with other environmental factors, and their diversity in the subtropical coastal waters of China. The abundance of planktonic thraustochytrids ranged from 2.56 × 10⁵ to 17.57 × 10⁵ cells L−1 with highest abundance detected in polluted coastal water in the Spring (March) season. The thraustochytrid biomass was greater than the bacterial biomass in most seawater samples, ranging from 32.29 to 359.51% that of bacterioplankton. The abundance of thraustochytrids appeared to be largely related to that of bacterioplankton and to chemical oxygen demand in water columns. High-throughput sequencing analyses revealed a total of 105 OTUs (97% similarity), which were members of genera Thraustochytrium, Aplanochytrium, Oblongichytrium, Ulkenia, Labyrinthula and undescribed novel phylotypes. Results of this study indicated unprecedented high diversity of labyrinthulomycetes as well as the presence of novel labyrinthulomycete and thraustochytrid lineages, and also provided new information on the significant role of thraustochytrids in microbial food webs in a coastal marine ecosystem.
INTRODUCTION
Unicellular protists are major contributors to the ocean productivity and play a key role in the global carbon cycle (Worden et al.2015). Marine coastal waters have high productivity and microbial diversity with a large fraction of primary organic matter available to consumers as detritus (Newell 1982; Jickells 1998; Danovaro and Pusceddu 2007). This detrital organic matter is thought to be largely degraded and mineralized by heterotrophic bacteria and archaea before entering higher trophic levels (Manini et al.2003; Pusceddu et al.2003). Nevertheless, large populations of heterotrophic (unicellular eukaryotic) protists are also known to occur in coastal ecosystems, but their ecological functions and diversity remain less well characterized.
Thraustochytrids (Labyrinthulomycetes, Stramenopiles)are osmo-heterotrophic unicellular protiststhat are widely distributed in marine environments (Porter 1990; Kimura, Fukuba and Naganuma 1999; Santangelo, Bongiorni and Pignataro 2000; Yang et al.2010). They have been reported to play important ecological roles in salty and decaying mangrove ecosystems (Raghukumar 2002; Raghukumar and Damare 2011) and have also been identified as sources of various degradative enzymes with a high level of activity towards highly refractory substrates (Taoka et al.2009; Nagano et al.2011). Their absorptive mode of nutrition marks them as probable agents for dissolved organic matter (DOM) consumption (Raghukumar 2002). Their multifarious trophic modes enable them to broadly participate in the oceanic carbon cycle (Worden et al.2015). Like other heterotrophic marine protists, thraustochytrids can utilize both DOM and particulate organic matter (POM) as energy sources. Thus, thraustochytrids have been considered to occupy a distinct ecological niche in marine ecosystems with potentially significant functions in marine biogeochemical cycles.
The abundance of thraustochytrids has been reported in several different marine habitats, including the Seto Inland Sea, Japan (Naganuma, Takasugi and Kimura 1998; Kimura, Fukuba and Naganuma 1999; Kimura et al.2001), the Mediterranean Sea (Santangelo, Bongiorni and Pignataro 2000; Bongiorni and Dini 2002), Greenland and Norwegian seas (Naganuma et al.2006), the equatorial Indian Ocean (Damare and Raghukumar 2008) and Hawaiian waters (Li et al.2013). The coastal waters of southern China receive a large nutrients input due to the development of aquaculture, and culturable thraustochytrid strains belonging to different genera were isolated from this area in our previous study (Liu et al.2014). However, the abundance and biogeochemical contribution of thraustochytrids in the coastal waters of southern China remain largely unknown.
The diversity of thraustochytrids also remains poorly characterized. To date only about 40 thraustochytrid species have been reported from marine habitats (Liu et al.2014). Like other marine microbes, the vast majority of thraustochytrids cannot be cultivated under axenic conditions. Therefore, the diversity of thraustochytrids remains to be discovered. Culture-independent methods have been applied for the efficient investigation of the diversity of microbial communities in different natural environments (Buée et al.2009; Blaalid et al.2012; Bowman et al.2012). At this point, clone library construction identified 25 OTUs from station ALOHA with the vast majority (80%) of them having close affiliation with Aplanochytrium sp. (Li et al.2013). Fifteen amplicons of thraustochytrids were identified from sediment and seawater samples collected from four sites around Long Island, New York (USA) (Collado-Mercado, Radway and Collier 2010). Thus, the previous reports suggested low diversity of thraustochytrids in marine environments, but utilized low throughput techniques. Due to the widely known limitation of 18S rRNA clone library construction and cultivation-dependent approaches, the diversity of thraustochytrids is still an elusive subject in the ecology of marine heterotrophic protists.
In this study, the spatial and temporal abundance of thraustochytrids and bacterioplankton was analyzed in the coastal waters of southern China at five different stations in three different seasons. Biomasses of thraustochytrids and bacterioplankton were compared for all the seawater samples. Molecular diversity of thraustochytrids was determined using SSU tag 454 pyrosequencing. The ultimate goal was to address the ecological significance of thraustochytrids in the subtropical coastal waters of southern China.
MATERIALS AND METHODS
Collection of samples
Five sampling stations were selected in the coastal habitats of Pearl River Delta of southern China. Three of the stations were in Mirs Bay: A (StA, 114.47°N, 22.53°E), B (StB, 114.46°N, 22.53°E) and C (StC, 114.46°N, 22.50°E). The other two stations were in Daya Bay: D (StD, 114.53°N, 22.57°E) and E (StE, 114.51°N, 22.58°E) (Fig. S1, Supporting Information). Environmental parameters including temperature, pH, salinity, nitrogen and phosphate concentrations, were determined according to the methods in ‘Sea water quality standard of China (GB 3097-1997)’. Mirs bay is the home for several aquafarms containing a relatively high level of nutrients. As shown in Table S1, the NO2-N, NO3-N and NH4-N concentrations in Mirs Bay (StA, StB and StC) in March were almost four times those in Daya Bay (StD and StE). Daya Bay contained much less nutrients. NO2-N and NO3-N were barely detectable in Daya Bay (StD and StE) in October. The PO4-P concentrations in stations A, B and C in Mirs Bay were also higher than that in the other two stations (Table S1, Supporting Information). Water samples were collected at the depths of 0, 5 and 10 m with a 5 L seawater sampler in March, July and October of 2012. An aliquot of seawater samples was fixed immediately with 3% formalin for direct counting of thraustochytrids and bacterioplankton. For molecular analysis, 500 mL seawater was filtered through 47 mm diameter, 0.22 μm pore-sized filters (Millipore, USA) and stored at −80°C for DNA extraction.
Abundance and biomass of thraustochytrids and bacteria
Cell counting of thraustochytrids was carried out using the acriflavine direct detection method (Raghukumar and Schaumann 1993). Acriflavine is able to simultaneously stain thraustochytrid cell walls containing sulfated polysaccharides red and their nucleus yellow-green, thus distinguish thraustochytrids from various protists and detritus in natural samples (Raghukumar and Schaumann 1993). To be specific, each 25 mL of seawater sample was filtered through 0.22 μm pore-sized black polycarbonate filters (diameter, 25 mm; Isopore, Millipore, USA). The resulting membranes were stained with 4 mL of 0.05% acriflavine in 0.1 M citric buffer (pH 3.0) for 4 min, and vacuum-drained. One milliliter of 70% isopropanol was further added on the membranes for 1 min. The filters were then rinsed with sterile distilled water and placed on a microscope slide. Cell enumeration was then carried out with an Olympus BX53 epifluorescence microscope.
Bacterioplankton abundance was detected using the fluorescent dye acridine orange. For bacterial cell counting, 1 mL of seawater was filtered through 0.22 μm pore-sized black polycarbonate filters (diameter, 25 mm; Isopore, Millipore). The bacterial cells on the filters were stained with 4 mL of 0.01% acridine orange in 10 mM phosphate buffer (pH 8.0) for 4 min (Kimura et al.2001). The filters were put on a microscope slide after rinsing with sterile distilled seawater. Bacterial cells fluoresce green after acridine orange staining.
Counting of thraustochytrids and bacteria for all the other samples was done in 10 microscope fields based on their fluorescing characteristic in triplicate, but bacterial counting for samples collected in March 2012 was done in five microscope fields. Thraustochytrid and bacterial biomass was estimated based on a value of 20.6 × 10⁻¹² and 30.2 × 10⁻¹⁵ g of carbon (C) per cell, respectively (Fukuda et al.1998; Kimura, Fukuba and Naganuma 1999; Li et al.2013).
Principal components analysis (PCA) for thraustochytrid and bacterial biomass as well as the environmental variables of all the samples was performed with the Canoco 5 program. Data were centered and standardized by environmental variables. In addition, a multiple stepwise linear regression model was applied to determine the main factors structuring thraustochytrid biomass using IBM SPSS Statistics 22.
DNA preparation and library construction
Based on their distant location and varied environmental conditions, the total genomic DNA of seawater samples taken from stations A and D in March 2012 and station D in July 2012 were extracted using the Ezup Soil DNA extraction kit (Sangon Biotech, China), following the manufacturer's guidelines. The DNA yield was quantified using a UV-Vis spectrophotometer Nanophotometer P300 (Implen, Germany). The genomic DNA of three depths from the same station for each sample was pooled, resulting in a total of three DNA samples, namely, sample StA-3 (March), StD-3 (March) and StD-7 (July). The specific labyrinthulomycete 18S rRNA primer set, LABY-A (5΄-GGGATCGAAGATGATTAG-3΄) and LABY-Y (5΄-CWCRAACTTCCTTCCGGT-3΄) (Collado-Mercado, Radway and Collier 2010), was used for subsequent PCR and sequencing analyses. The PCR program was run for initial denaturation at 95°C for 5 min, followed by 35 cycles of 0.5 min at 95°C, 0.5 min at 50°C and 1.5 min at 72°C, and a final extension at 72°C for 20 min. The quality and quantity of amplified products (∼450 bp) were checked by agarose gel electrophoresis and Nanophotometer. Separate clone libraries were constructed for each PCR product and sent for sequencing at Beijing Genomic Institute (BGI) in Shenzhen, China. The obtained sequences were processed with Mothur (Schloss et al.2009). Sequences were aligned to the SILVA alignment database with the needleman algorithm by the align.seqs command (Dumbrell et al.2011). The chimeric sequences were detected and excluded using UCHIME. The dist.seqs command was further applied to calculate the uncorrected pairwise distances and generate the distance matrix between the remaining high-quality aligned DNA sequences. A similarity cutoff of 97% was applied to determine the operational taxonomic units (OTUs). Maximum likelihood phylogenetic trees were then generated using MEGA 4 software (Tamura et al.2007) with 1000 bootstrap replicates. The 18S rRNA gene sequences from all clone libraries were submitted to GenBank under the accession numbers of KF793528–KF793716 and KM603074–KM603170.
Pyrosequencing analyses
The pyrosequencing analysis was done with the Roche GS FLX system using 454 A or B sequencing adapters fused to the barcode primer set. PCR was carried out in a 20 μL reaction mixture containing 2 μL of 2.5 mM dNTPs, 0.8 μL each of 5 μM forward and reverse primers (LABY-A and LABY-Y), 0.4 μL of TransStart Fastpfu DNA polymerase (TransGen Biotech, China), 4 μL of 5× Fastpfu buffer and 10 ng of template DNA. The PCR cycling parameters were as following: initial denaturation at 95°C for 2 min, 40 cycles of 30 s at 95°C, 30 s at 48°C and 30 s at 72°C, followed by a final extension at 72°C for 5 min. Triplicate reaction mixtures of each sample were pooled and purified with an AxyPrepDNA kit (Axygen, USA). PicoGreen® dsDNA quantitation reagent combined with the QuantiFluorTM-ST fluorometer (Promega, USA) were applied for the quantification of PCR products. emPCR was conducted using a Roche emPCRAmp-Lib-L kit before pyrosequencing. The pyrosequencing project was carried out at the Majorbio Company (Shanghai, China).
Pyrosequencing data analyses
Analyses of 18S raw data resulting from pyrosequencing were mainly done using the program Mothur (Schloss et al.2009). Sequences matching the specific barcodes into different samples were sorted first, and those receiving a quality score less than 25 and measuring less than 200 bp in length and those containing any ambiguous bases were subsequently removed and excluded from further analyses. These trimmed sequences were then aligned to the SILVA alignment database with the needleman algorithm using the align.seqs command (Dumbrell et al.2011). The pre.cluster command was further applied to reduce sequencing noise of the reads, which differed only by 1 bp (Huse et al.2010). Sequences were then clustered to OTUs at 97% sequence identity by USEARCH 8.0.1623 (Edgar 2010). Chimeric sequences were detected and excluded by UCHIME. Individual sequence was assigned to the taxonomy by the assign_taxonomy.py script of QIIME with the SILVA SSUrRNA database (SSU119), and the cutoff value set to 90%. The script make_otu_table.py of QIIME tabulates the number of times an OTU is found in each sample, and adds the taxonomic predictions for each OTU if a taxonomy file is supplied (Caporaso et al.2010).
Community diversity and richness estimators of Shannon index, Simpson index, Chao1, Ace estimators and Good’s coverage were generated with Mothur (Luo et al.2013).
RESULTS
Abundance of thraustochytrids and bacteria in the water column
The results for thraustochytrid and bacterial densities for all the seawater samples collected in March, July and October 2012 are presented in Fig. 1. The abundance of thraustochytrids ranged from 2.56 × 10⁵ to 17.57 × 10⁵ cells L−1. Tukey’s test (P < 0.05) performed with SAS 9.4 indicated that for most samples collected from the same month, no significant difference in thraustochytrid abundance was observed in different stations with the same depth or in different depths at the same station. Higher numbers of thraustochytrids were detected at the surface layer (0 m) of stations B and E, whereas the lowest concentration was found at 10 m depth of station C in March (Fig. 1). Concentrations of chlorophyll a and nitrogen nutrients were also found to be highest in March (Table S1, Supporting Information). Relatively lower densities of thraustochytrids were observed for most of the samples in October (Fig. 1). Bacterioplankton abundance, ranging from 1.12 × 10⁸ to 9.48 × 10⁸ cells L−1, also peaked in March at the surface layer (0 m) of Station B (Fig. 1). And their average abundance in March was higher than that in July and October. As regard to spatial distribution, bacterioplankton cell densities varied greatly amongst different stations.
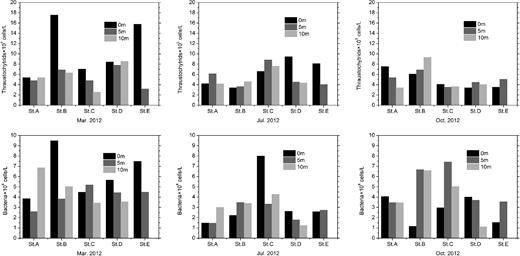
Temporal and spatial variation of thraustochytrid and bacterioplankton abundance in the water column.
While the concentration of bacterioplankton and thraustochytrids differed by about a thousand-fold, their estimated carbon biomass was more similar. The biomass of thraustochytrids and bacterioplankton in the seawater column ranged from 5.27 to 36.20 μg carbon L−1 and 3.38 to 28.65 μg carbon L−1, respectively. A comparison of thraustochytrid and bacterioplankton biomass in individual water samples showed a relative percentage of thraustochytrids to bacteria ranging from 32.29% to 359.51% (Fig. 2). Moreover, the biomass of thraustochytrids was greater than that of bacteria in most seawater samples (Fig. 2). Thus, thraustochytrids can play a significant role in the carbon cycling of the investigated tropical coastal marine ecosystems.

Relative biomass of thraustochytrids and bacterioplankton in the water column; bars from top to bottom represent relative biomass at depths of 0, 5 and 10 m for individual stations.
Correlation of thraustochytrids with bacterioplankton and other environmental factors
A principal components analysis (PCA) for thraustochytrid and bacterial biomass as well as another two biotic and 19 abiotic environmental variables was conducted for all samples (Fig. 3). The first and second principal components, respectively, explained 39.87% and 18.52% of the total environmental variation, and thus cumulatively explained 58.39% of the total environmental variation. Samples collected in the same month (March, July or October) clustered in the PCA ordination plot. Temperature was determined to be the primary factor of the first principal component. Bacterial biomass was found to be positively related to inorganic nutrients such as NH4-N, PO4-P, NO3-N, NO2-N and silicate, whereas thraustochytrid biomass was positively related to organic factors such as chlorophyll a and chemical oxygen demand (COD). Interestingly, from the PCA ordination plot, it appeared that different heavy metals had different correlations with thraustochytrid biomass. For example, Zn and Pb concentrations were positively related while Hg and Cr concentrations were negatively related to thraustochytrid biomass.

Principal compenent analysis (PCA) ordination plot for thraustochytrid and bacterioplankton biomass as well as environmental variables of all the samples.
We also explored the possibility of predicting thraustochytrid biomass with a multiple stepwise linear regression model using bacterial biomass and all the environmental parameters (Table 1). Three significant factors (bacterial biomass, COD and NH4-N) with P value of 0.05 or less were selected by the exploratory analysis. Analyses with these three variables indicated that they had a strong correlation with thraustochytrid biomass, showing a significance of P < 0.001 (bacterial biomass), P = 0.003 (COD) and P = 0.020 (NH4-N). The entire model explained 73.7% of the variability. Looking at the β-coefficient of each variable, which represents their relative potential at predicting thraustochytrid biomass, bacterial biomass had the highest weight (β = 0.802) followed by COD (β = 0.532), implying that thraustochytrids might cooperate with bacteria to decompose and utilize organic matter. The weak negative effect (β = −0.394) of NH4-N on thraustochytrid biomass may have resulted from hindering effects of NH4-N on growth of the thraustochytrid population because inhibition effects of ammonia on marine microalgae were noticed in the previous study (Källqvist and Svenson 2003).
Coefficient index showing the significant parameters structuring thraustochytrid biomass by multiple stepwise linear regression model. COD, chemical oxygen demand.
| Coefficient | Bacterial | COD | Ammonia- |
|---|---|---|---|
| biomass | nitrogen | ||
| P value | 0.000 | 0.003 | 0.020 |
| Standardized coefficient (β) | 0.802 | 0.532 | −0.394 |
| Adjusted R square of model | 0.737 | ||
| Coefficient | Bacterial | COD | Ammonia- |
|---|---|---|---|
| biomass | nitrogen | ||
| P value | 0.000 | 0.003 | 0.020 |
| Standardized coefficient (β) | 0.802 | 0.532 | −0.394 |
| Adjusted R square of model | 0.737 | ||
Diversity of thraustochytrids
A total of 290 106 trimmed 18S rRNA sequences with an average length of 393 bp were obtained from the three pooled samples using pyrosequencing analysis. The number of sequences derived from StA-3 and StD-3 was 104 914 and 113 358, respectively. A comparatively lower number of sequences (71 834) was recovered from sample StD-7 (Table 2). Further removal of repetitive and chimeric sequences resulted in a total of 102 395 sequences. Thereafter, 14 665 sequences were obtained by filtering singletons and grouped into 459 OTUs (318, 327 and 216 OTUs for sample StA-3, StD-3 and StD-7, respectively) at the similarity of 99%. At 97% cutoff, a total of 105 OTUs were obtained with 75, 72 and 54 OTUs for sample StA-3, StD-3 and StD-7, respectively. Rarefaction analysis (data not shown) and the community richness estimator (Ace and Chao1) results suggested that sample StA-3 had the highest richness level (Table 2). The community diversity, as reflected by Shannon and Simpson indexes, was highest in sample StA-3 and lowest in sample StD-3 (Table 2).
Mean values of richness and diversity for multiple OTU definitions obtained by pyrosequencing.
| Cutoff value | Sample ID | Reads | Ace | Chao1 | Good’s coverage | Shannon | Simpson |
|---|---|---|---|---|---|---|---|
| StA-3 | 104 914 | 239 080 | 97 415 | 0.807120 | 5.93 | 0.084 | |
| Unique | StD-3 | 113 358 | 210 550 | 88 462 | 0.850533 | 5.07 | 0.1528 |
| StD-7 | 71 834 | 154 880 | 62 679 | 0.814678 | 5.65 | 0.1095 | |
| StA-3 | 26 840 | 17 990 | 0.941081 | 5.28 | 0.0867 | ||
| 0.03 | StD-3 | 21 557 | 14 962 | 0.958653 | 4.55 | 0.1537 | |
| StD-7 | 15 009 | 10 247 | 0.950627 | 4.94 | 0.1119 | ||
| StA-3 | 13 678 | 10 009 | 0.967048 | 4.66 | 0.111 | ||
| 0.05 | StD-3 | 11 157 | 8378 | 0.977087 | 3.93 | 0.2094 | |
| StD-7 | 7864 | 6003 | 0.971923 | 4.39 | 0.1227 | ||
| StA-3 | 4526 | 3722 | 0.988169 | 3.7 | 0.1524 | ||
| 0.10 | StD-3 | 3686 | 3129 | 0.991795 | 2.77 | 0.3315 | |
| StD-7 | 2783 | 2361 | 0.989225 | 3.31 | 0.2047 |
A complete list of taxonomic assortments for the reads is shown in Table S2 according to the Mothur SILVA SSUrRNA database. Among all the three samples, Stramenopiles emerged as the major phylum comprising the majority of the reads (98.07%). Apart from thraustochytrids, a fraction of other protists such as Neoceratium, Amoebophrya, Alexandrium and Labyrinthula, were also detected (Table S2, Supporting Information). The identification of the top 50 ranked OTUs (at 97% cutoff) showed that 12 of them were uncultured labyrinthulomycetes. In addition, a group of OTUs (40% of the top OTUs) were identified as family Thraustochytriaceae without specific genus assignment, indicating these OTUs belong to unclassified Thraustochytriaceae, and probably are novel species. Phylogenetic analysis (Fig. 4) of the top 50 ranked OTUs (at 97% cutoff) revealed that most of the OTUs were clustered to genera Thraustochytrium, Aplanochytrium, Oblongichytrium, Ulkenia and Labyrinthula. Therein, the most represented genera were Thraustochytrium, Aplanochytrium and Oblongichytrium, which was consistent with the diversity analysis by traditional clone library sequencing (Fig. S2, Table S3, Supporting Information). The five represented genera were detected in all samples, suggesting their homogeneous distribution in the study area. Finally, the observed sequence divergence in phylogenetic analysis also indicated the presence of novel labyrinthulomycete lineages (Fig. 4).
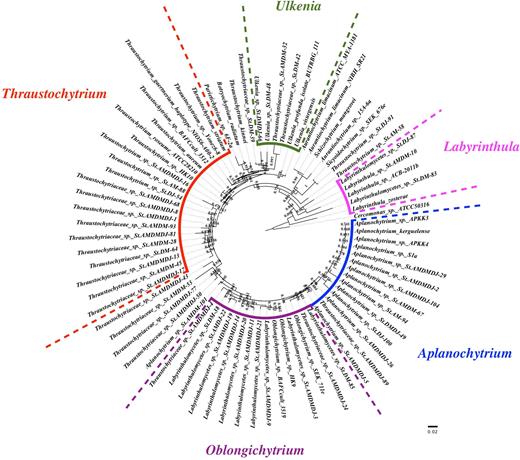
Phylogenetic affiliation of the top 50 ranked OTUs recovered from all three stations by pyrosequencing (the OTUs were denoted as: taxon name+sample name+OTU number. For example, Ulkenia sp. StDM-48 means OTU48 was identified as Ulkenia sp. and detected in StD at March. And Thraustochytriaceae sp. StAMDMDJ-13 means OTU13 was identified to family Thraustochytriaceae without specific genus assignment, i.e. unclassified Thraustochytriaceae, and was detected in StA in March, StD in March and StD in July.)
Overall, the diverse phenotypes obtained by different analysis processes in our study indicated the high diversity of thraustochytrids in the coastal seawater of southern China. The wide range of evolutionary distances, together with the unassigned and unclassified reads revealed a great number of novel thraustochytrid species in the study area.
DISCUSSION
Abundance of thraustochytrids and bacterioplankton and their correlation with environmental factors
The abundance of both thraustochytrids and bacterioplankton has been reported in only a handful of previous studies using direct detection techniques (Naganuma, Takasugi and Kimura 1998; Damare and Raghukumar 2008; Li et al.2013). The abundance of thraustochytrids detected in the present study was relatively high, indicating the nutrient-rich and biologically productive nature of the coastal ecosystems of southern China. Nevertheless, the abundance of thraustochytrids in this study is close to the maximum detected in the Arabian Sea (Raghukumar, Ramaiah and Raghukumar 2001), the equatorial Indian Ocean (Damare and Raghukumar 2008) and the Hawaiian waters (Li et al.2013).
The distribution of thraustochytrids in the oceanic waters differs from that in coastal waters. Thraustochytrids exist in patches of very high density in terms of both their frequency of occurrence and abundance in the open ocean, such as in the equatorial Indian Ocean (Damare and Raghukumar 2008) and Hawaiian waters (Li et al.2013). This general patchy distribution pattern has been ascribed to the feature of particle-dependence (Damare and Raghukumar 2008). On the other hand, no significant difference in thraustochytrid abundance between different stations was observed in the present study, indicating that thraustochytrids display relatively low spatial variations in marine coastal ecosystems, which may be explained by the unique presence of particles in the coastal waters (Naganuma, Takasugi and Kimura 1998; Kimura, Fukuba and Naganuma 1999; Kimura et al.2001). Previous studies have indicated that the distribution of thraustochytrids in the water column is also affiliated with marine aggregates, such as mucus particles (Raghukumar, Ramaiah and Raghukumar 2001). Apart from particulate organic carbon, other factors have also been reported to be correlated with thraustochytrid abundance, such as dissolved organic carbon, chlorophyll a and salinity (Naganuma, Takasugi and Kimura 1998; Kimura et al.2001; Li et al.2013). Unlike the open ocean, both allochthonous and autochthonous matter can affect the thraustochytrid distribution in coastal areas (Kimura, Fukuba and Naganuma 1999; Li et al.2013). Temporally, thraustochytrids were found to be most abundant in March (Fig. 1). The value of chlorophyll a in March was also highest, i.e. 23.28 μg L−1 (Table S1, Supporting Information), whereas, during other seasons it was found to be much lower (0.92–8.71 μg L−1). In contrast, thraustochytrids have been reported to be highly abundant during October (Damare and Raghukumar 2008) and November (chlorophyll a concentration varied between 0 and 0.7 μg L−1 for both the studies) (Li et al.2013) in oceanic waters. This suggests the dependence of thraustochytrids on living primary production in coastal ecosystems of southern China. Furthermore, the riverine input of terrestrial organic matter likely has a notable impact on the abundance of thraustochytrids (Kimura, Fukuba and Naganuma 1999; Kimura et al.2001). The negative correlations between thraustochytrid biomass and salinity and pH in the present study agreed with the previous study in the Seto Inland Sea, Japan (Kimura et al.2001), indicating that the terrigenous nutrient input can facilitate thraustochytrid growth. Clearly, biological and environmental variables, which influence the abundance and frequency of occurrence of planktonic thraustochytrids, would be an interesting subject for future study.
The bacterial densities observed in this study corresponded to the values reported previously in Hawaiian waters (Li et al.2013), the Seto Inland Sea of Japan (Naganuma, Takasugi and Kimura 1998), Norwegian seas (Naganuma et al.2006) and the equatorial Indian Ocean (Damare and Raghukumar 2008). Positive correlations between thraustochytrid and bacterial abundance were observed in the coastal waters of Seto Inland Sea of Japan (Naganuma, Takasugi and Kimura 1998; Kimura et al.2001). However, this relationship was highly variable in the Arabian Sea (Raghukumar, Ramaiah and Raghukumar 2001) as well as the equatorial Indian Ocean (Damare and Raghukumar 2008). The reason for such high variability between thraustochytrid and bacterial numbers may be their dependence on the same or different oceanic substrates (Damare and Raghukumar 2008). In the present study, the correlation (β = 0.802, Table 1) revealed by multiple stepwise linear regression was found to be significantly positive (P < 0.001), suggesting the similar resource use of thraustochytrids and bacteria in this area.
Furthermore, the biomass of thraustochytrids was greater than that of bacterioplankton in the most water samples collected in March and July (Fig. 2). This observation indicated the neglected significance of thraustochytrids in the oceanic carbon pool of coastal ecosystems (Naganuma et al.2006). The relatively higher contribution of thraustochytrids than of bacterioplankton in the carbon pool was also observed in some other oceanic areas (Damare and Raghukumar 2008; Li et al.2013). In the equatorial Indian Ocean, the biomass contribution of thraustochytrids reached even more than 90% of the bacterioplankton (Damare and Raghukumar 2008). The thraustochytrid biomass also exceeded that of bacterioplankton in some Hawaiian water samples (Li et al.2013). All these findings indicate the significant role of thraustochytrids in marine carbon cycling.
Several lines of evidence support that small marine heterotrophic protists, such as thraustochytrids, are capable of degrading organic particles and play an important role in ocean carbon cycles (Pernice et al.2015; Worden et al.2015). As decomposers, thraustochytrids produce various extracellular enzymes and are considered to play an important role in the degradation of complex compounds (Damare and Raghukumar 2006; Taoka et al.2009; Nagano et al.2011). Thraustochytrids have also been considered to live upon residual nutrients left over by bacteria, acting as ‘left-over scavengers’ (Raghukumar and Damare 2011). On the other hand, some observations that bacterial biomass and COD have significant effects on thrautochytrid biomass in this study indicate that thraustochytrids and bacteria might collaboratively degrade organic matter (Raghukumar, Ramaiah and Raghukumar 2001, Naganuma et al.2006; Damare and Raghukumar 2008; Raghukumar and Damare 2011). Clearly, the trophic relationship between thraustochytrids and bacterioplankton remains an interesting subject for future investigation.
Diversity of thraustochytrids
Few studies have investigated the diversity of thraustochytrids using culture-independent methods. Fifteen amplicons that were obtained from estuarine habitats around Long Island were clustered to the thraustochytrid phylogenetic group (Collado-Mercado, Radway and Collier 2010), whereas only two of the 25 OTUs that were retrieved from Hawaiian waters using the clone library approach fell into the family of thraustochytrids (Li et al.2013). Results of these studies indicated the presence of novel, but low diversity, labyrinthulomycete signatures in those study areas. In the present study, 54 OTUs were obtained using the same primer set by a cloning–sequencing approach (Fig. S2, Table S3, Supporting Information). A considerable proportion of the OTUs were affiliated with Oblongichytrium sp. and Aplanochytrium sp. This was in concordance with the previous reports and suggested the efficiency of the above primer set towards successful amplification of the above labyrinthulomycete species from different geographical habitats (Collado-Mercado, Radway and Collier 2010; Li et al.2013). For instance, Aplanochytrium sp. has been reported as dominant in equatorial Indian Ocean habitats in an earlier report (Damare and Raghukumar 2006) and the majority of the OTUs derived from Hawaiian waters also belonged to Aplanochytrium sp. (Li et al.2013). Thus, Aplanochytrium sp. is likely a common species in the world's oceans, i.e. a generalist. However, these two species (Oblongichytrium sp. and Aplanochytrium sp.) were not recovered in our previous study from the same study area using culture-dependent methods (Liu et al.2014). The recovery of Schizochytrium sp. and Thraustochytrium sp. in the present study as well as by a culture-dependent method (Liu et al.2014) suggests that these isolates are abundant in the coastal ecosystem of southern China. Furthermore, a total of nine OTUs belonged to known thraustochytrid species of the NCBI database at <97% identity and are suggested to be probable novel species. In addition, >50% of OTUs were affiliated with unidentified clones of thraustochytrids (Table S3, Supporting Information). All these results strongly indicate the coastal habitat of southern China as a potential reservoir of novel thraustochytrid diversity.
Pyrosequencing provided extensive data for thraustochytrid diversity and prominent reads retrieved from pyrosequencing were also matched to unknown or rare species in this study. Hitherto, only a limited number of thraustochytrid species have been isolated from world-wide marine ecosystems. The evidence of probable novel thraustochytrid lineages obtained in this study suggested that the actual diversity of thraustochytrids in natural habitats could be richer than previously recognized. This diverse occurrence of thraustochytrid species revealed that they may possess great potential in sustaining the marine ecosystem. Numerous previous studies have reported that different thraustochytrid species presented various biochemical features as regard to enzymes, extracellular polysaccharide or bioantioxidant production (Taoka et al.2009; Nagano et al.2011; Liu et al.2014). One of the most remarkable differences between individual thraustochytrid strains is that they can exhibit unique abilities to degrade refractory substrates (Raikar et al.2001; Taoka et al.2009). The presence of high thraustochytrid diversity and novel phylotypes will likely benefit the utilization of substrates and nutrient cycles.
The PCR primers used for amplification may be significantly biased towards the recovery of different microbial groups (Suzuki and Giovannoni 1996; Hong et al.2009; Edgcomb et al.2011), creating a distorted view of diversity in a natural environment. To minimize such biases, a combination of multiple PCR primer sets and deep community sequencing may be applied for diversity studies; however, absolute accuracy still cannot be assured (Hong et al.2009; Edgcomb et al.2011). The primer LABY-Y has been reported to be biased against amplification of thraustochytrid sequences (Collado-Mercado, Radway and Collier 2010; Li et al.2013). The use of the same primer in the present study raises doubts over its representation of thraustochytrid diversity. However, this uncertainty is minimized by the observation that the above primer amplified fairly large quantities of thraustochytrid sequences from the seawater samples of different stations (Table S2, Supporting Information). In addition, diverse forms of thraustochytrids were recovered using this primer instead of single dominating species (Table S2, Table S3 and Fig. 4). Even so, a combination of eukaryotic- and thraustochytrid-specific primers may be employed in future studies to obtain an improved delineation of the actual level of diversity in these fungi-like protists. Thus, the diversity reported here likely represents a minimum estimate of its true expanse.
In conclusion, this study provides a great insight into the abundance and molecular diversity of the thraustochytrid community in the coastal waters of southern China. The greater biomass of thraustochytrids compared with that of bacterioplankton defines them as a significant component of the microbial food web and of carbon and nutrient cycling. This study greatly expands the known diversity of thraustochytrids in coastal water and lays down a solid foundation for further exploration of their diversity and ecological functions in coastal marine ecosystems and other oceanic provinces.
SUPPLEMENTARY DATA
Supplementary data are available at FEMSEC online.
Acknowledgments
The authors are grateful to the Shenzhen Marine Environment and Fishery Resource Monitoring Station for their support in extending their facilities during sampling and the environmental parameter assay. The authors do not have a conflict of interest to declare.
FUNDING
This study was partially supported by the National Science Foundation of China Grant 31670044 and the China Public Science and Technology Research Funds Projects of Ocean (201305022).
Conflict of interest. None declared.
