


Abstract
Microbial communities are important to ecosystem function and sensitive to hydrological dynamics. However, we lack predictable knowledge about how soil microorganisms respond to water table drawdown in different depths. This research used a high-throughput sequencing method to determine the responses of prokaryotic communities to the changes of water table and depth on Zoige peatlands. Our results showed that water table drawdown reduced alpha diversity indices (observed species, Shannon diversity and Chao1 richness) of prokaryotic communities. Intriguingly, the reduction of diversity varied in different depths, and was statistically significant in intermediate layers (20–30 cm and 50–60 cm), but not in the surface (0–10 cm) or deep layer (90–100 cm). In deeper layers there was greater relative abundance of most anaerobic microorganisms (e.g. Chloroflexi, Planctomyctes and NC10), but lesser amounts of most aerobes (e.g. Proteobacteria and Acidobacteria). However, the vertical distribution of prokaryotic microbiota along the depth gradient was altered by water table drawdown, mainly by enriching oligotrophs (e.g. Acidobcteria) over copiotrophs (e.g. Bacteriodetes). In addition, we found that the most important soil parameters influencing community structure were soil pH, total organic carbon and total nitrogen. Our study illuminates that the variations of prokaryotic communities caused by water table drawdown are depth-dependent, and that water table drawdown leads to predictive changes of microbiota in peatlands.
INTRODUCTION
With a high water table and low temperature, peatlands are an important carbon sink, with a low rate of organic matter decomposition (Gorham 1991; Moore, Roulet and Waddington 1998; Laiho 2006). Microbial communities play an important role in decomposing organic matter and sustaining ecosystem functions and services (Campbell et al.2010; Ramirez et al.2010; Yao et al.2014; Leff et al.2015; Urbanová and Bárta 2016), but they are sensitive to hydrological dynamics (Kemnitz et al.2004; Lone et al.2006; Bouskill et al.2016; Zhang et al.2016), especially in peatlands (Jaatinen et al.2007, 2008; Tian et al.2012; Urbanová and Bárta 2016). Influenced by factors including warming, drought and drainage, the water table is declining in peatlands under climate change and human activities (Gorham 1991; Roulet et al.1992; Laiho 2006; Dise 2009). With water table drawdown, the deeper soil is exposed to aerobic conditions, which would lead to significant changes in their microbial communities (Jaatinen et al.2007; Andersen, Chapman and Artz 2013). Therefore, understanding the responses of soil microbes in different soil depths to water table drawdown and the underlying mechanisms could be important for predicting the future fate of peatlands.
Soil microorganisms are vertically stratified with depth due to the changes of substrates and redox conditions (Fierer, Schimel and Holden 2003; Dedysh et al.2006; Artz 2009; Andersen, Chapman and Artz 2013). Microbial populations in surface layers of peatlands have been well studied (Zhang et al.2008; Tian et al.2011, 2012; Sun et al.2014; Elliott et al.2015; Urbanová and Bárta 2016), while those in deeper soils are scarcely explored. As microorganisms inhabiting deep layers play a key role in soil processes (Fierer, Schimel and Holden 2003; Goberna et al.2005; Douterelo, Goulder and Lillie 2010), especially for anaerobic processes like methanogenesis (Galand et al.2003; Kotsyurbenko et al.2004), anaerobic methane oxidation (Zhu et al.2012; Hu et al.2014; Shen et al.2015b) and anaerobic ammonia oxidation (Wang et al.2012; Shen et al.2015a; Oshiki, Satoh and Okabe 2016), it is important to explore deeper soil microorganisms and reveal the vertical distribution of prokaryotic microbiota along the depth gradient.
However, the natural vertical distribution of microbial communities can be altered by water table drawdown and the consequent alterations in soil properties (Fierer, Schimel and Holden 2003; Andersen, Chapman and Artz 2013; Urbanová and Bárta 2016). For example, the abundance of fungi increased in the upper 5 cm but decreased in the 5–10 cm layer with water table drawdown (Jaatinen et al.2007). For Proteobacteria and Acidobacteria, which are dominant phyla in peatlands (Douterelo, Goulder and Lillie 2010; Serkebaeva et al.2013; Sun et al.2014), water table drawdown decreases the amount of Proteobacteria and increases that of Acidobacteria (Elliott et al.2015; Urbanová and Bárta 2016). In addition, water table drawdown was also found to reduce the diversity and richness of prokaryotic microbiota in a fen (Urbanová and Bárta 2016), but had no influence on the diversity of microbial communities in peat forest soils (Sun et al.2014). The limited studies show that the effects of water table drawdown on microbial communities in peatlands are not straightforward (Laiho 2006; Andersen, Chapman and Artz 2013). Nevertheless, our knowledge is still insufficient for predicting changes of microbiota of different depths in response to water table drawdown.
Recent studies indicate that the responses of microbial communities to disturbances (e.g. nutrient additions) could be predicted by applying the copiotroph–oligotroph theory (Ramirez et al.2010; Ramirez, Craine and Fierer 2012; Leff et al.2015). By applying the ecological copiotroph–oligotroph theory to soil microbes, we can tell the ecological attributes of certain taxonomic groups and understand the function of microorganisms (Fierer, Bradford and Jackson 2007; Leff et al.2015). Copiotrophs exhibit high growth rates and are preferentially distributed in nutrient-rich environments; oligotrophs have slower growth rates but are likely to overcome copiotrophs in situations of low carbon availability (Meyer 1994; Fierer, Bradford and Jackson 2007; Fierer et al.2012; Yao et al.2014). Just as the responses of microbial communities to nutrient additions can be predicted, those of microbial communities to water table drawdown should also be predictable. As water table drawdown reduces the content of labile carbon and increases the concentration of aromatic, carboxylic, and phenolic compounds in peatlands (Blodau and Siems 2012; Urbanová and Bárta 2016), it may favor oligotrophs and reduce copiotrophs.
In order to predict the responses of prokaryotic microbiota in different depths to water table drawdown, we studied three peatlands with different water tables across four depths and tested the following hypothesis: water table drawdown decreases the diversity of prokaryotic microbiota in different patterns at different depths, and changes the community structure mainly via decreasing copiotrophs and increasing oligotrophs.
MATERIAL AND METHODS
Study site description and sample collection
Zoige peatlands are located in the northeast of the Qinghai–Tibetan Plateau, belonging to the cold Qinghai–Tibetan climatic zone with an annual average temperature of 1.5°C and precipitation of 720 mm (Chen et al.2014; Liu et al.2016). We sampled at the end of May 2016 in the Riganqiao Provincial Wetland Reserve (102°39΄10΄E, 33°06΄19΄N, a.s.l. 3646 m) of Zoige peatlands (Fig. 1), which has been drained for livestock grazing since the 1970s (Gao et al.2008; Xiang et al.2009). Long-term drainage resulted in the natural water table gradient and the consequent alterations in vegetation composition. Three peatland sampling sites following the water table gradient were chosen: H site with high annual average water table (WT = 0.32 cm) dominated by Equisetum ramosissimun (Equisetaceae); M site with intermediate water table (WT = −4.04 cm) dominated by Scirpus triqueter (Cyperaceae); and L site with low water table (WT = −10.37 cm) dominated by Blysmus sinocompressus (Cyperaceae).
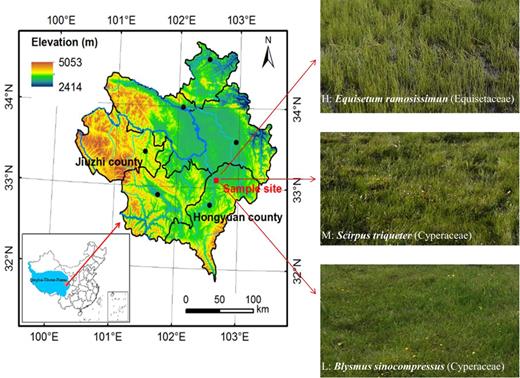
Map of Zoige Peatlands showing the location of sample sites in the northeastern part of the Qinghai–Tibetan Plateau. H: site with high water table dominated by Equisetum ramosissimun (Equisetaceae); M: site with intermediate water table dominated by Scirpus triqueter (Cyperaceae); L: site with low water table dominated by Blysmus sinocompressus (Cyperaceae).
At each sampling site, we randomly collected three peat cores using a gasoline drill (8 cm in diameter, 100 cm in length). Each peat core was sliced at 10-cm intervals and all samples were sealed in sterile bags and transported in an ice box to the laboratory within 12 h. Samples at the depths of 0–10, 20–30, 50–60 and 90–100 cm were used for our study (Hu et al.2014; Shen et al.2015b). In total 36 samples (3 replicates × 4 depths × 3 sites) were examined. Every sample was divided into two parts: one was stored at 4°C for soil characters analysis; the other was frozen at −20°C for microbiota analysis.
Peat property analysis
The soil properties were measured as previously described (Ma et al.2016; Liu et al.2016). Briefly, total organic carbon (TOC) was detected by a total organic carbon analyzer (LIOYIL TOCII, Elementar, Germany) and total nitrogen (TN) by an automatic azotometer (KjeltecTM 8400 Analyzer, Foss, Sweden). The contents of nitrate (NO3−) and ammonium (NH4+) were determined by a continuous flow analyzer (SKALAR San++, Skalar Co., Netherlands). The pH was measured by an acidity meter (Sartorius PB-10, Germany) with a water and soil ratio of 2.5:1.
Total DNA extraction and high-throughput sequencing
Total DNA was extracted from 0.25 g soil for each sample using a Power Soil DNA kit (Mo Bio Laboratories, Carlsbad, CA, USA) following the manufacturer's instructions. The quality of DNA was examined on 1% agarose gel, and the concentration (Supplementary Table S1) was measured with a NanoDrop spectrophotometer (Maestrogen, MN-913, Taiwan).
Universal primers 515F (5΄-GTGCCAGCMGCCGCGGTAA-3΄) and 909R (5΄-CCCCGYCAATTCMTTTRAGT-3΄) were used to amplify the V4–V5 hypervariable region of microbial 16S rRNA gene (Caporaso et al.2011, 2012). In order to split sequences to each sample, the forward primer 515F containeda 12 nt unique barcode. The methods and procedures of high-throughput sequencing were the same as described by Li et al. (2016b). Briefly, the 25 ul PCR reactions were carried out in duplicate with 10 ng DNA template. After amplification, duplicate PCR products were combined and examined on 1% agarose gel. The products with correct size (∼400 bp) were purified using an Extraction Kit (Sangon Biotech, China) and quantified with a NanoDrop spectrophotometer (Supplementary Table S1). Purified PCR products from each sample were equimolar pooled and purified using the TruSeq DNA kit (Illumina, San Diego, USA) following the manufacturer's instructions. The purified library was diluted, denatured, re-diluted, mixed with PhiX according to the Illumina library preparation protocols, and then applied to the Illumina Miseq platform (Miseq Reagent Kit V2) for sequencing at the Environmental Genome Platform of Chengdu Institute of Biology, Chinese Academy of Sciences.
16S rRNA sequences analysis
The processing of 16S rRNA sequences was the same as previous described (Li et al.2016a; Li et al.2016b). Briefly, the sequences were processed using QIIME Pipeline version 1.7.0 (http://qiime.org/tutorials/tutorial.html). Each sample was trimmed and assigned based on unique barcode; the sequences with high quality (length >300 bp, without ambiguous base ‘N’, and average base quality score >30) were used for downstream analysis (Supplementary Table S1). The chloroplasts were removed and the chimeras were checked using the Uchime algorithm (Edgar et al.2011). All sequences were clustered into operational taxonomic units (OTUs) at a 97% identity threshold using cd-hit (Li and Godzik 2006) and singleton OTUs were filtered out. All samples were resampled to the same number of reads (8714 reads) and rarefaction curves were generated from observed species. To evaluate alpha diversity of microbial communities, the observed species, Shannon diversity and Chao1 richness were calculated. We calculated alpha diversity indices for each depth in each site (n = 3) and also calculated the average of each alpha diversity index for all depths in each site (n = 12). To assess beta diversity, the weighted UniFrac distance metrics were used to estimate the community structure. Taxonomy was identified by the Ribosomal Database Project classifier at a confidence level of 80% (Wang et al.2007; Li et al.2016c).
The original 16S rRNA sequence data were deposited in the European Nucleotide Archive (https://www.ebi.ac.uk/ena) with accession number PRJEB17863.
Statistical analysis
The overall structural alteration of peatland microbiota was evaluated using principal coordinates analysis (PCoA) based on weighted UniFrac distance metrics. The statistical significance among groups was assessed by permutational multivariate analysis of variance (PERMANOVA) using ‘adonis’ in Vegan of the R package (Warton, Wright and Wang 2012). The correlation between environmental variables and prokaryotic communities was assessed using the Mantel test; then environmental variables with the highest Spearman correlation coefficients were selected for variance partitioning analysis (VPA) using ‘varpart’ in the Vegan package. The relationship between the abundances of microbial phyla and environmental variables was determined by redundancy analysis (RDA) using CANOCO 5. Difference among samples was evaluated by one-way or two-way analysis of variance (ANOVA). Before that, normal distribution was tested and the non-normal data were transformed to normal ones using Blom's formula under equivalent command Rank Cases (Li et al.2016c). The Spearman correlation analysis in SPSS 18.0 software was used to test the correlation between factors and alpha diversity indices or dominant taxonomic units. A result was considered statistically significant when P < 0.05.
RESULTS
Changes in soil properties
Peat chemical properties showed significant differences among peatlands of different water tables, especially for pH, TOC and TN (Table 1). With the declining water table, soil pH in all depths showed an upward trend except for 0–10 cm. The changes of TOC and TN were depth-dependent. At the depth of 0–10 cm, water table drawdown increased the content of TOC (from 52.6 to 289.4 g kg−1) and TN (from 4.2 to 18.7 g kg−1) (P < 0.05 in both cases; Table 1), while at the depths of 20–30, 50–60 and 90–100 cm, water table drawdown reduced the concentrations of TOC and TN (P > 0.05 for TN in 50–60 cm; P < 0.05 for the others).
Physicochemical properties of peat along the water table gradient in different depths. NH4+: ammonium; NO3−: nitrate; TOC: total organic carbon; TN: total nitrogen. H: site with high water table; L: site with low water table; M: site with intermediate water table. Values are means ± standard error. Different letters in the same column of the same depth indicate significant difference at the level of P < 0.05 (a, b and c for the depth of 0–10 cm; d, e and f for the depth of 20–30 cm; g, h and i for the depth of 50–60 cm; j, k and l for the depth of 90–100 cm).
| Depth and site | pH | TOC (g/kg) | TN (g/kg) | NO3− (mg/kg) | NH4+ (mg/kg) |
|---|---|---|---|---|---|
| 0–10 cm | |||||
| H | 5.94 ± 0.08a | 52.59 ± 8.76a | 4.18 ± 0.26a | 0.29 ± 0.02a | 21.22 ± 8.41a |
| M | 5.23 ± 0.03b | 271.22 ± 12.47b | 17.74 ± 0.56b | 0.43 ± 0.13a | 21.99 ± 4.11a |
| L | 5.88 ± 0.06a | 289.36 ± 4.65b | 18.74 ± 0.47b | 1.36 ± 0.65a | 51.59 ± 40.96a |
| 20–30 cm | |||||
| H | 5.34 ± 0.02d | 158.86 ± 33.20d | 11.15 ± 2.32d | 0.46 ± 0.04d | 9.65 ± 0.45d |
| M | 5.43 ± 0.02e | 295.16 ± 13.23e | 16.30 ± 0.71e | 0.56 ± 0.27d | 16.01 ± 2.64de |
| L | 5.90 ± 0.01f | 150.11 ± 7.47d | 9.82 ± 0.26d | 0.74 ± 0.65d | 20.65 ± 2.79e |
| 50–60 cm | |||||
| H | 5.35 ± 0.08g | 241.56 ± 75.67gh | 13.37 ± 4.33g | 0.42 ± 0.13g | 22.37 ± 12.22g |
| M | 5.59 ± 0.12h | 293.11 ± 8.69g | 14.60 ± 0.70g | 0.72 ± 0.20g | 22.72 ± 5.90g |
| L | 5.89 ± 0.06h | 128.01 ± 23.98h | 6.56 ± 0.98g | 0.42 ± 0.03g | 7.98 ± 1.89g |
| 90–100 cm | |||||
| H | 5.40 ± 0.04j | 298.89 ± 11.36j | 15.05 ± 0.75j | 0.74 ± 0.18j | 22.25 ± 9.94j |
| M | 5.82 ± 0.05k | 362.64 ± 16.36k | 16.51 ± 0.73k | 0.32 ± 0.06k | 35.21 ± 3.13j |
| L | 5.84 ± 0.05k | 35.93 ± 12.04l | 2.35 ± 0.78k | 0.27 ± 0.04k | 2.50 ± 0.11k |
Variations in alpha diversity of prokaryotic communities
The average number of high-quality reads obtained by MiSeq sequencing from all samples was 21 350 (Supplementary Table S1). Prokaryotic community characteristics were calculated based on the same sequencing depth of 8714 sequences for each sample. The rarefaction curves of observed species across all samples almost reached stable values (Supplementary Fig. S1), indicating that most of the microbial species in peatlands were captured.
Two-way analysis of variance showed significant difference in observed species and Shannon diversity of prokaryotic microbiota among water tables and depths (P < 0.05; Supplementary Table S2). Water table drawdown decreased all alpha diversity indices (observed species, Shannon diversity and Chao1 richness), with the highest diversity in peatland H with high water table and the lowest diversity in peatland L with low water table (Supplementary Fig. S2). Furthermore, such reduction of alpha diversity by water table drawdown varied among depths, with significant difference for depths of 20–30 and 50–60 cm, but not for 0–10 or 90–100 cm (Table 2).
The alpha diversity indices of prokaryotic microbiota in peatlands of different depth and water table. H: site with high water table; L: site with low water table; M: site with intermediate water table. Values are means ± standard error. Different letters in the same column of the same depth indicate significant difference at the level of P < 0.05 (a, b and c for the depth of 0–10 cm; d, e and f for the depth of 20–30 cm; g, h and i for the depth of 50–60 cm; j, k and l for the depth of 90–100 cm).
| Depth and site | Observed species | Shannon | Chao1 |
|---|---|---|---|
| 0–10 cm | |||
| H | 2952.67 ± 278.21a | 10.46 ± 0.22a | 5827.54 ± 893.89a |
| M | 2885.33 ± 81.41a | 10.30 ± 0.07a | 5902.08 ± 229.76a |
| L | 3044.33 ± 25.76a | 10.67 ± 0.05a | 5896.97 ± 61.66a |
| 20–30 cm | |||
| H | 3005.33 ± 195.95d | 10.39 ± 0.19d | 6211.03 ± 619.21d |
| M | 2761.00 ± 123.16de | 10.28 ± 0.11d | 5672.92 ± 323.27d |
| L | 2384.00 ± 38.79e | 9.75 ± 0.06e | 4779.15 ± 115.71d |
| 50–60 cm | |||
| H | 2524.67 ± 93.24g | 9.99 ± 0.11g | 5256.45 ± 110.39g |
| M | 2911.00 ± 306.09g | 10.34 ± 0.26g | 6315.09 ± 889.77h |
| L | 2074.67 ± 113.49h | 9.13 ± 0.30h | 4291.92 ± 379.13i |
| 90–100 cm | |||
| H | 2798.33 ± 184.43j | 10.12 ± 0.22j | 6020.87 ± 790.28j |
| M | 2472.33 ± 107.74j | 9.40 ± 0.18j | 5541.44 ± 326.19j |
| L | 2566.33 ± 248.71j | 9.86 ± 0.19j | 5574.38 ± 688.00j |
Shifts in beta diversity of prokaryotic microbiota
In order to understand the effects of water table and depth on the overall structure of microbiota, the beta diversity based on weighted UniFrac distance metrics was calculated. We observed that water table and depth significantly affected the structure of prokaryotic communities in Zoige peatlands (PERMANOVA, P < 0.001 for both). The first principle coordinate axis (PCoA1) explained 48.74% of total variation and the second principle coordinate axis (PCoA2) contributed 14.48% of the variation (Fig. 2).
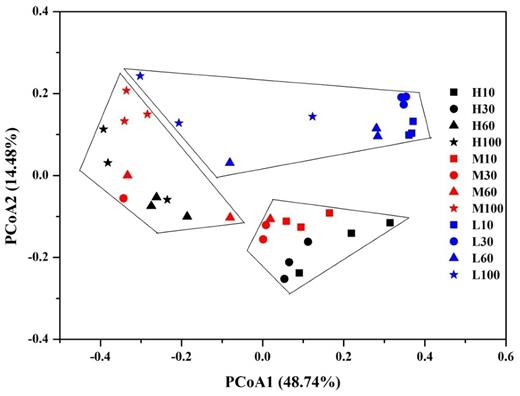
Principal coordinate analysis (PCoA) showing the changes of prokaryotic community structure (weighted) on water table and depth. H: site with high water table; L: site with low water table; M: site with intermediate water table; 10: depth of 0–10 cm; 30: depth of 20–30 cm; 60: depth of 50–60 cm; 100: depth of 90–100 cm.
Notably, the prokaryotic community structure of low water table peatland L significantly differed from community structure of intermediate water table peatland M and high water table peatland H (Fig. 2, PERMANOVA, P < 0.001 and P = 0.002, respectively), while the difference of prokaryotic community structure between peatland H and M was not significant (Fig. 2, P = 0.166). However, the community structure of peatland H and M was significantly separated by depth, with 0–10 and 20–30 cm significantly different from 50–60 and 90–100 cm (Fig. 2, P < 0.001).
Changes in dominant taxonomic groups
Peatlands in our sampling sites harbored diverse prokaryotic communities, in which the relative abundance of bacteria was 86.6% (72.0–99.5%) on average and the proportion of archaea was 13.1% (0.5–27.6%) (Supplementary Table S3). Altogether 64 phyla were identified in Zoige peatlands, with 13 dominant ones (relative abundance higher than 1%; Fig. 3).

Composition of prokaryotic communities along the depth gradient in three peatlands at phylum level. Only those phyla with relative abundance higher than 1% were shown.
The most abundant phyla in peatland H and peatland M included Proteobacteria, Chlorofexi, Crenarchaeota and Bacteroidetes, while the dominant phyla in peatland L were Proteobacteria and Acidobacteria (Fig. 3). From peat surface to 90–100 cm in peatland H, the relative abundance of Proteobacteria and Bacteroidetes decreased while that of Crenarchaeota increased (Fig. 4A). In peatland M, the relative abundance of Proteobacteria and Acidobacteria reduced while that of Chlorofexi, Crenarchaeota and OP9 increased with depth (Fig. 4B). In peatland L, increasing depth reduced the proportion of Acidobacteria and accordingly increased that of Chlorofexi and Crenarchaeota (Fig. 4C). In addition, the relative abundance of Alphaproteobacteria, Betaproteobacteria and Gammaproteobacteria decreased in all peatlands with increasing depth (Supplementary Table S3).

Changes of relative abundance of dominant phyla with depth in three peatlands. (A) H site; (B) M site; (C) L site.
The result of one-way analysis of variance showed that water table drawdown significantly altered most of dominant phyla in every depth, changing seven phyla in 0–10 cm, ten in 20–30 cm, nine in 50–60 cm and seven in 90–100 cm depth (Supplementary Table S4). Among the phyla impacted by water table drawdown, the relative abundance of copiotrophic Bacteriodetes significantly reduced in all depths (P < 0.05 for all, Fig. 5A and Supplementary Table S4), with the lowest amount in low water table peatland L. At the same time, the oligotrophic Acidobacteria increased greatly with water table drawdown (Fig. 5B), with significant difference in 0–10 and 20–30 cm. Although the differences in 50–60 and 90–100 cm were not statistically significant, the increasing trend was obvious.
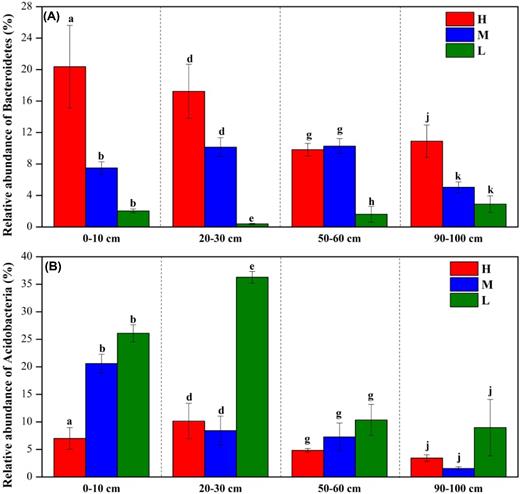
The changes of relative abundance of Bacteroidetes (A) and Acidobacteria (B) along the water-table gradient in the depth of 0–10, 20–30, 50–60 and 90–100 cm. Different letters in the same depthindicate significant difference at the level of P < 0.05 (a, b and c for the depth of 0–10 cm; d, e and f for the depth of 20–30 cm; g, h and i for the depth of 50–60 cm; j, k and l for the depth of 90–100 cm).
Relationships between soil parameters and prokaryotic microbiota
To understand the relationship between peat microbiota and soil parameters, their correlations were assessed by the Mantel test. The result showed that soil pH, TOC and TN provided the highest Spearman's correlation (Supplementary Table S5) and appearent significant difference (P < 0.05, Supplementary Table S5); such relative contributions were also quantified by variance partitioning analysis (VPA). The TOC alone explained 36.00% of the variation, followed by 31.91% for TN and 17.03% for pH (Fig. 6A). The above parameters together explained 50.02% of total variation, leaving 49.98% unexplained. Furthermore, the result was confirmed by redundancy analysis (RDA) of microbial phyla and environmental variables (Fig. 6B). Additionally, the environmental factors influencing alpha diversity indices varied among depths (Supplementary Table S6). The main influencing factors were pH and TN for 20–30 cm, but TOC, TN and NH4+ for 50–60 cm.
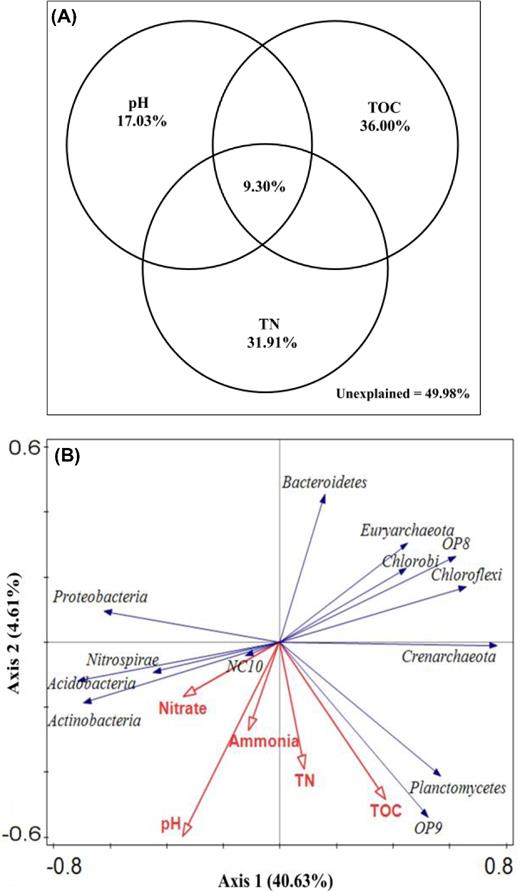
The relative contributions of environmental factors quantified by variance partitioning analysis (A) and the relationship between microbial phyla and environmental factors performed by redundancy analysis (B). TN: total nitrogen; TOC: total organic carbon.
At phylum level, the relative abundance of prokaryotic communities was significantly related to pH (7 out of 13 phyla) and TOC (6) (Supplementary Table S7). The dominance of some phyla was closely associated with pH, including Bacteroidetes (r = −0.525, P < 0.001) and Chloroflexi (r = −0.436, P = 0.008); that of some others was closely related to TOC, e.g. Crenarchaeota (r = 0.450, P = 0.006) and Planctomycetes (r = 0.376, P = 0.024). At genus level, the dominance of some microbial taxa was shown to be correlated with pH (9 out of 21 genera), TOC (8), TN (4) and NH4+ (4) (Supplementary Table S7).
DISCUSSION
The vertical distribution of prokaryotic microbiota along the depth gradient
The results of this study showed that peat depth had significant influence on the structure of prokaryotic microbiota (Fig. 2, PERMANOVA, P < 0.001). Such influence was largely shown in alterations of the relative abundance of specific phyla (Fig. 3). The relative abundance of aerobic microbes (e.g. Proteobacteria, Acidobacteria and Bacteroidetes) in this study was found to decrease with peat depth while that of anaerobes (e.g. Chloroflexi, Planctomyctes and NC10) increased (Fig. 4), indicating that the upper layers of peatlands were dominated by aerobic processes and deeper layers by anaerobic processes. This vertical stratification of microbes with depth may be caused by changes of environmental conditions (Fierer, Schimel and Holden 2003), such as physical limitations and substrates. Due to smaller pore size and lower hydraulic conductivity in deeper layers of peatlands, their rate of dispersal is slower than inthe peat surface, which may hamper the existence of aerobic microbes rather than anaerobes (Andersen, Chapman and Artz 2013). Studies have suggested that the availability of oxygen and other electron acceptors decreased with increasing depth in peatlands (Artz 2009; Andersen, Chapman and Artz 2013). Although we did not measure the oxygen content at different depths, other substrates (e.g. TOC, TN, NO3− and NH4+) were found to change greatly with increasing depth (Table 1), consistent with Artz (2009) and Andersen, Chapman and Artz (2013).
The most abundant Proteobacteria showed a dramatic reduction in relative abundance with depth (Figs 3 and 4), which was in line with another study (Tsitko et al.2014). Such reduction was shown by the decrease of Alphaproteobacteria, Betaproteobacteria and Gammaproteobacteria in relative abundance (Supplementary Table S3), because most groups of these three classes are aerobic microorganisms. The functional groups in Methylocystaceae of Alphaproteobacteria contain genera belonging to typeII methanotrophs and members of Methylococcaceae of Gammaproteobacteria include genera belonging to typeI methanotrophs (Yun et al.2014). Both typeI and typeII are major components of the aerobic methanotrophs, which mitigate the emission of methane to the atmosphere in many habitats (Hanson and Hanson 1996; Ma et al.2016). Some members of Betaproteobacteria are aerobic ammonia-oxidation bacteria, involving in nitrogen cycling (Dang et al.2010).
In contrast to aerobic microbes, the relative abundance of anaerobic ones such as Chloroflexi, Planctomyctes and NC10 appeared to increase with depth (Figs 3 and 4). The phylum Chloroflexi includes Dehalococcoidetes and Anaerolineae. The typical taxa of Dehalococcoidetes are obligate anaerobic bacteria, which may degrade halogenated solvents (Hug et al.2012; Löffler et al.2013). Some members of Anaerolineae are filamentous anaerobes and involved in the decomposition of carbohydrates (Sekiguchi et al.2003; Yamada et al.2005). Certain members of Planctomyctes play important role in anaerobic ammonia oxidation (anammox), which reduces ammonia by combining nitrite and ammonia into dinitrogen gas (Strous et al.1999; Oshiki, Satoh and Okabe 2016). The NC10 phylum is responsible for the recently discovered process of nitrite-dependent anaerobic methane oxidation (n-damo), which could oxidize methane in anaerobic conditions (Raghoebarsing et al.2006; Ettwig et al.2009; Hu et al.2014).
Water table drawdown greatly altered the prokaryotic community
Our research found that water table drawdown decreased alpha diversity (observed species, Shannon diversity and Chao1 richness) of peat microbiota (Supplementary Fig. S2), which was consistent with one recent study (Urbanová and Bárta 2016). The changes in community diversity were probably attributable to the differences in physicochemical properties (Lauber et al.2009; Yao et al.2014). This was supported by the reduced contents of TOC and TN with water table drawdown (Table 1). Interestingly, the reduction varied in different depths, being more obvious in depths of 20–30 and 50–60 cm than in depths of 0–10 and 90–100 cm (Table 2), indicating that intermediate layers were more sensitive to water table drawdown than surface and deep layers. This result supported the former part of our hypothesis that water table drawdown might decrease microbial diversity in different patterns at different depths. For the surface layer, the community structure was probably influenced by the combination of several factors (e.g. vegetation type, plant height and temperature) rather than the single effect of water table. Different vegetation types produce different root exudates, which are the sources of carbon, nitrogen and energy for soil microbiota (Bergman, Klarqvist and Nilsson 2000; Conrad et al.2008; Tian et al.2011). Plant height affects methanogenic community composition and temperature controls archaeal distribution (Rooney-Varga et al.2007; Tian et al.2011). The conditions in deep layers of peatlands with different water table, however, could be similar due to the constant anaerobic environment, and therefore the conditions did not change much with water table drawdown.
Water table drawdown significantly altered the composition and structure of prokaryotic microbiota in Zoige peatlands (Fig. 2). The alterations could be in both direct and indirect ways. On one hand, water table directly influenced the microbial structure by changing the oxic–anoxic interfaces. Whenthe water table decreased from 0.32 cm (H site) to −10.37 cm (L site), oxygen may penetrate into the surface or subsurface soil, because water table drawdown was found to increase the thickness of the aerobic layer in a boreal peatland; the increased aerobic layer following water table drawdown could result in changes of microbial abundances (Jaatinen et al.2007). In surface (0–10 cm) and subsurface (20–30 cm) layers of our study, water table drawdown decreased the relative abundance of Euryarchaeota (Supplementary Table S4) while increasing that of Alphaproteobacteria (Supplementary Table S3), both of which may result in reduced emission of methane in peatlands, due to the role of methanogens of Euryarchaeota in methane production (Zhang et al.2008; Borrel et al.2011) and that of methanotrophs of Alphaproteobacteria in methane oxidation (Hanson and Hanson 1996; Ma et al.2016). Previous research suggested that water table drawdown increases bulk density in deeper peat layers (e.g. 50–60 and 90–100 cm) (Jaatinen et al.2005), which limits the exchange of gases and reduces oxygen concentration (Jaatinen et al.2007; Urbanová and Bárta 2016). On the other hand, changes in peat properties including substrates (e.g. TOC, TN and NH4+) and pH (Table 1) induced by water table drawdown could also alter the community structure. In our study, water table drawdown greatly reduced the contents of TOC, TN and NH4+ in 50–60 and 90–100 cm (Table 1), consistent with research in peatlands (Urbanová and Bárta 2016). TOC and TN accounted for 36.00% and 31.91%, respectively, of the variation of the community structure (Fig. 6A). NH4+ was positively correlated with all alpha diversity indices in 50–60 cm (Supplementary Table S6) and associated with four dominant genera of this study (Supplementary Table S7). Soil pH is a vital environmental factor influencing microbial communities in wetland soil by affecting some specific taxa (Hartman et al.2008). In this research, the dominance of 7 out of 13 dominant phyla was associated with pH, including that of Bacteroidetes, Euryachaeota and others (Supplementary Table S7).
The difference of prokaryotic microbiota between low water table peatland L and intermediate water table peatland M was significant (P < 0.001), whereas the variation between high water table peatland H and intermediate water table peatland M was not (P = 0.166) (Fig. 2). However, the dominant vegetation in L (Blysmus sinocompressus) and M (Scirpus triqueter) belonged to the same family (Cyperaceae), while the dominant vegetation in H (Equisetum ramosissimun) and M (Scirpus triqueter) was from different families (Equisetaceae and Cyperaceae, respectively) (Fig. 1). This non-conformity between prokaryotic community structure and vegetation suggested that vegetation was not a vital factor shaping prokaryotic communities in our study. The vegetation composition is able to shape the community structure in the uppermost layers (Tian et al.2011; Li et al.2016c), but it may not significantly influence the structure of microbiota in deeper layers (e.g. 50–60 and 90–100 cm). One possible reason is that the roots of these plants could almost never reach the depth of 50–60 cm let alone 90–100 cm (Zhu et al.2012). Another possible reason is that peat properties in deeper layer (e.g. 90–100 cm) are not influenced by current vegetation, since they have been accumulated over thousands of years (Chen et al.2014; Liu et al.2016).
A previous study demonstrated that Proteobacteria and Bacteroidetes are copiotrophs, while Acidobacteria are oligotrophs (Fierer, Bradford and Jackson 2007). In our study, water table drawdown significantly increased the abundance of Acidobacteria and decreased the amount of Bacteroidetes (Fig. 5 and Supplementary Table S4), suggesting that water table drawdown shifted microbial life history strategies, according to the copiotroph–oligotroph theory (Fierer, Bradford and Jackson 2007; Leff et al.2015). These results support the latter part of our hypothesis that water table drawdown could decrease copiotrophs and increase oligotrophs. However, further evidence is need to validate this hypothesis, as the copiotrophic Proteobacteria did not show obvious reduction with water table drawdown (Supplementary Table S4, P > 0.05 in all depths except for 90–100 cm). Our result was inconsistent with reports about responses of microbiota to nutrient additions, which found that nutrient additions led to the increase of copiotrophic taxa and the reduction of oligotrophic groups (Ramirez et al.2010; Fierer et al.2012; Yao et al.2014; Leff et al.2015). The discrepancy was probably explained by the difference in nutrient availability of soils between the researches. Nutrient addition created conditions of high nutrient availability, while water table drawdown changed the nutrient-rich condition into a nutrient-poor one (Blodau and Siems 2012; Urbanová and Bárta 2016). This was supported by the reduced contents of TOC and TN with water table drawdown in our study (Table 1).
In summary, our results provide robust evidence that water table drawdown plays an important role in shaping the diversity and structure of prokaryotic communities both at surface and deep layers, indicating the significance of containing deeper soils when investigating the effects of water table drawdown on prokaryotic microbiota in peatlands. On one hand, we showed the vertical distribution of prokaryotic communities along the depth gradient in Zoige peatlands. On the other hand, we demonstrated that water table drawdown changes the vertical distribution of microbiota, enriching oligotrophs (e.g. Acidobcteria) over copiotrophs (e.g. Bacteriodetes). We highlighted the depth-dependent variations of prokaryotic microbiota by water table drawdown in peatlands, and illuminated how water table drawdown leads to predictive changes in microbial communities by using the copiotroph–oligotroph theory. The results help in understanding the fate of peatlands under climate change and human disturbances. In order to predict how soil microorganisms respond to various environmental changes in peatlands, however, it would be valuable to establish a linkage between alterations of microbiota and changes of underground processes in response to other environmental changes (e.g. warming).
SUPPLEMENTARY DATA
Supplementary data are available at FEMSEC online.
Acknowledgments
This study was supported by the 100 Talents Program of The Chinese Academy of Sciences, the National Key R & D Program of China (2016YFC0501804), the Youth Science and Technology Innovation Team Program of Sichuan Province of China (2015TD0026), the Project of Fundamental Research of Qinghai Normal University and the National Natural Science Foundation of China (31570480 and 41571220). The authors give special thanks to Ms Wan Xiong for her editing and valuable comments on the manuscript. We also thank Mr Huan Li for his help on data analysis and suggestions on the manuscript.
Conflict of interest. None declared.
