


Abstract
The mammalian microbial communities in the gastrointestinal tract (GIT) play important roles in host nutrition and health. However, we still lack an understanding of how these communities are organized across GIT in natural environments. Here, using 16S rRNA gene sequencing, we analyzed the bacterial community diversity, network interactions and ecosystem stability across five gut regions (mouth, stomach, small intestine, cecum and colon) emanating from two common pika species in China, including Plateau pikas (Ochotona curzoniae) inhabiting high-altitude regions, as well as Daurian pikas (O. daurica) occupying low-altitude areas. The relative abundances of dominant Bacteroidetes and Firmicutes exhibited an increasing trend from mouth to colon. Cecum and colon harbored higher bacterial diversity compared with other anatomical regions. Gut region significantly influenced the structure of bacterial communities in the GIT. Network analysis indicated that topological features showed marked variations among gut regions. Interestingly, the ecosystem stability of bacterial communities increased gradually from mouth to colon. Our results suggest that gut region influences the diversity, structure and network interactions of bacterial communities in pikas. For hindgut-fermenting herbivorous mammals, relatively higher bacterial diversity and ecosystem stability in the cecum may provide a favorable condition for the fermentation of indigestible plant polysaccharides.
INTRODUCTION
Animal ecology is generally influenced by interactions with the diverse and complex microbes in mammalian gastrointestinal tracts (GIT) (McFall-Ngai et al.2013). These microbial communities play key roles in food digestion and energy harvest, nutrient uptake, immunity regulation (Tremaroli and Bäckhed 2012) and gut development (Hooper 2004) of hosts. The anatomical compartmentation in the GIT can strongly influence the microbial composition of the gut, as foregut and hindgut-fermenting mammals have distinct gut communities (e.g. Ley et al.2008a). In addition, different regions of the GIT in a single individual can also harbor unique microbes (e.g. Donaldson, Lee and Mazmanian 2016). Previous studies on microbial biogeography across GIT regions in mammalian herbivores include a limited number of host individuals from ruminants (de Oliveira et al.2013) and foregut-fermenting rodents (Kohl et al.2014). However, there are no extensive reports on the gut biogeography of wild hindgut-fermenting herbivorous mammals. Exploring the gut ecology of these mammals will help us understand trophic niche and function of microbial communities, and microbiota adaptability to recalcitrant plant-based diet in natural environments.
Pikas are small, wild hindgut-fermenting herbivores (order Lagomorpha), and they are widely distributed in Asia, North America and Europe (Yang et al.2008). Most pika species in China are confined to the Qinghai-Tibet Plateau and adjacent regions (Niu et al.2004). There are two common pika species, including Plateau pikas (Ochotona curzoniae) living in cold and hypoxic high-altitude regions, such as the Qinghai-Tibet Plateau at 3000–6000 m above sea level (ASL), and Daurian pikas (O. daurica), which are mainly distributed in the Inner Mongolia at roughly 1000 m ASL. These two pika populations possess distinct diet profiles (Fan, Jing and Zhang 1995) and host genetics (Yu, Zheng and Shi 1998), which may lead to differences in microbial communities across the GIT. Our previous survey on the gut microbial assembly of Plateau pikas suggests that its taxonomical diversity is positively correlated with host population densities (Li et al.2016c). Furthermore, comparisons between pika cecal microbiota and environmental microbes indicate the microbiome of pikas is distinct from those in their surrounding soil and dietary plants, and pika gut may select for rare but diverse environmental microbes (Li et al.2016b). Diet in particular is a factor driving community structure, given that pikas feeding on the same plants have more similar bacterial assemblies than those feeding on different food sources (Li et al.2016a). As herbivores in the grassland, pikas consume a large amount of grass per day (equal to half of body weight) (Li et al.2013), and food fermentation is dependent on microbial communities in the GIT. Yet, the information regarding to the microbial ecology of pikas across gut regions remains insufficient.
Previous studies on gut microbial biogeography mainly focused on the composition and diversity across the GIT (Stearns et al.2011; Segata et al.2012; de Oliveira et al.2013; Kohl et al.2014; Lu et al.2014; Yasuda et al.2015). However, the GIT microbial community is believed to be a well-organized and closely interacting community. Gut microbes can form networks through various types of interactions (Ramayo-Caldas et al.2016), such as mutualism and competition. Network analysis has been used to better understand microbial co-occurrence patterns, such as niche specialization (Faust et al.2012), deterministic process at different taxonomic levels (Chaffron et al.2010) and other complex ecological relationships (Zhang et al.2014). In addition, network properties are associated with the stability and functional diversity of bacterial communities (Jordan et al.2015). Thus, microbial network analysis may reveal common system-level properties (e.g. stability) of microbial communities in GIT.
In addition to network interactions, understanding the ecosystem stability is essential for predicting the influence of various environmental factors on ecosystem functioning and flexibility. In macroecology, numerous studies have investigated the relationship between biodiversity and ecosystem stability (Pimm 1984; Isbell et al.2015; Wang and Loreau 2016). However, few studies concentrate on diversity–stability relationship in gut microbial community. In particular, the ecosystem stability of microbiota in different chambers of GIT and diversity–stability relationship remain unknown.
To understand host–microbe interactions in wild pikas, we explored the diversity, network interactions and ecosystem stability of bacterial communities across various regions of the GIT in Plateau and Daurian pikas. We addressed three key questions: (i) Does the composition and diversity of bacterial communities vary across gut regions and between pika species? (ii) Do bacterial networks of various gut chambers exhibit different topological features? (iii) How is the ecosystem stability of different compartments and diversity–stability relationship in the pika digestive tract? Our results have important significance for understanding the differences of microbial diversity, interactions and community stability owing to functional divergence in different gut chambers, and microbiota adaptability to indigestible plant-based diets in wild herbivores.
MATERIALS AND METHODS
Sample collection and pH determination
All samples were collected between June and August in 2014. Plateau pikas were captured from Guoluo (4331m ASL) in the Qinghai-Tibet Plateau, while Daurian pikas were collected from two sampling sites, including Xiwuqi (1000 m ASL) and Baiyinxile (1198 m ASL) in the Inner Mongolia Grassland. We captured pikas using ropes. After pikas were euthanized, animal individuals were dissected in sterile box and samples from five anatomical locations (mouth, stomach, small intestine, cecum and colon) were collected from 13 Plateau pikas (Group 4331PP) and 26 Daurian pikas (12 individuals in the Group 1000DP were from Xiwuqi, and 14 individuals in the Group 1198DP were from Baiyinxile). For the collection of mouth samples, sterile cotton swabs were used to swab the surface of tongues. For the collection of stomach, small intestine, cecum or colon samples, the intestines were aseptically removed from pika's abdominal cavity and the entire contents in each region were gently squeezed out and harvested separately. Notably, all the cecum samples (39 cecal samples) were a subset of those analyzed in our previous study (Li et al.2016b) and these sequences were re-analyzed with other samples in this study. A small portion of fresh contents from these regions were used immediately to measure the pH with an ECO pH-tester (DePuTe, China) after the contents from each region were thoroughly mixed. The remaining samples were collected into 50 ml sterile tubes and were kept at –20°C in a portable freezer in the wild. This study was not involved in any protected or endangered animal species. All experiments were approved by the Institution of Animal Care and the Ethics Committee of Chengdu Institute of Biology, Chinese Academy of Sciences (Approval ID: CIB-2014–131).
The habitat types of the Plateau and Daurian pikas were alpine meadow and typical steppe, respectively. In this study, the plant community was dominated by Kobresia humilis in the alpine meadow in the Qinghai-Tibet Plateau. In contrast, the plant community was dominated by Stipa spp. in the typical steppe of the Inner Mongolia Grassland. In order to explore the soil microbial communities of the pikas’ habitats, we collected 16 soil samples (0–10 cm; 5–6 samples per site) from the three sites. Within each site, five to six plots (1 m × 1 m) were randomly placed, with the stipulation that the distance was at least 10 m apart between any two plots. Each soil sample was a mixture of five to seven soil cores at the depth of 0–10 cm within each plot. In addition, the dominant plant species at each sampling site was identified based on morphological characteristics. A total of 13 most dominant plant samples (four to five samples per site) were also collected (Table S1, Supporting Information). Aboveground organs (leaves and stems) of these plants were cut into small pieces with sterile scissors and put into sterile tubes. In each sampling site, each plant sample (or species) was a mixture of three individuals of the same plant species. These environmental samples, as well as the content samples mentioned above, were temporarily stored at –20°C in a portable freezer in the field. Finally, a total of 224 samples (195 pika samples, 13 plant samples and 16 soil samples) were transported to the laboratory within 24 h, and then stored at –40°C prior to microbiota analysis. Sample information is given in Table S1.
DNA extraction, PCR amplification and 16S rRNA sequencing
All plant samples were thoroughly ground under liquid nitrogen using mortar and pestle before DNA extraction. DNA extraction (Ezup genomic DNA extraction kit for soil, Sangon Biotech, China) and PCR amplification for all samples (pikas, plant and soil) were performed as described previously (Li et al.2016c). Universal primer pairs 515F(5΄-GTGYCAGCMGCCGCGGTA-3΄)/909R(5΄-CCCCGYCAATTCMTTTRAGT-3΄) were used to amplify the V4-V5 region of the microbial 16S rRNA gene (Li et al.2016c). The 5΄-end of forward primers harbors 12-bp unique barcodes, which were used to split each sample. All samples were mixed with an equal molar amount from the purified PCR product of each sample, and library was prepared using the TruSeq DNA kit. Finally, the purified library (224 samples) was sequenced using a Reagent Kit v2 (2 × 250 bp) with an Illumina MiSeq sequencer at the Environmental Genomic Platform of Chengdu Institute of Biology, Chinese Academy of Sciences.
Bioinformatics analysis
Bioinformatics analysis was performed in Bio-Linux 7 system (http://ftp.yzu.edu.tw/Linux/bio-linux-iso/bio-linux-7-latest.iso) that contains QIIME Pipeline-Version 1.7.0. Raw reads were processed and analyzed using the QIIME software package (http://qiime.org/scripts/index.html) (Caporaso et al.2010). Sequences of each sample were split based on their unique barcodes. Sequence merging, filtering and analysis followed the methods of Li et al. (2016b). Briefly, after removing low-quality sequences (reads length <300 bp, with ambiguous base ‘N’, and average base quality score <30), chloroplasts and chimeras, an open reference OTU picking method was used to cluster sequences into operational taxonomic units (OTUs) at a 97% sequence identity using CD-HIT (Li and Godzik 2006). Archaeal reads only occupied a small part of total sequences (<0.01%) and were thus removed together with those belonging to Eukaryotes. Singletons were also removed. Representative sequences of each OTU were picked based on the QIIME script ‘pick_rep_set.py’. Thereafter, the representative sequences were aligned against the Greengenes 13_8 reference database (DeSantis et al.2006) using PyNAST (Caporaso et al.2009). Taxonomy assignment was performed using the Ribosomal Database Project classifier with a standard threshold of 80% (Wang et al.2007).
To compare all samples with uneven sequences, each sample was rarefied to 3987 sequences. In order to evaluate alpha diversity indices, we calculated the following parameters: observed species, phylogenetic diversity, Shannon diversity and evenness of bacterial microbial communities. The OTU-level rarefaction curves of observed species across all samples were constructed. To assess beta diversity, we calculated weighted UniFrac distance matrices (Hamady, Lozupone and Knight 2010). Differences in overall bacterial community structure among gut regions and between host species were visualized using the non-metric multidimensional scaling (NMDS) plots of weighted UniFrac dissimilarity matrices.
Statistical analysis
In each sampling site, permutational multivariate analysis of variance (PERMANOVA) of the weighted UniFrac distance matrices was used to evaluate whether the GIT microbiota structure was significantly different across gut regions using the procedure ‘adonis’ in the R ‘vegan’ package. The model also comprised other variables, including animal individuals, body weight and sex. Taxonomic profiles were evaluated at the phylum and genus level. Two-way analysis of variance (two-way ANOVA) with post hoc tests was applied to test the differences in relative abundances of these taxonomic units and alpha diversity among gut regions and host species. The pH values in the same gut regions between Plateau and Daurian pikas were compared using one-way ANOVA. P values were corrected using the false discovery rate control.
In order to compare the differences of bacterial communities in the same anatomical region between Plateau and Daurian pikas, we used analysis of similarity (ANOSIM). Compared with PERMANOVA, ANOSIM is more sensitive to test the differences of microbiota structure when sample sizes were uneven among groups. Similarly, ANOSIM was also used to assess the geographical variations of GIT microbiota in Daurian pikas with identical gut regions. Differences in the levels of variation within each gut region were evaluated using one-way ANOVA.
Network analysis
In order to understand the microbial interactions of bacterial communities in different gut regions, phylogenetic molecular ecological networks (pMENs) were constructed using Random Matrix Theory-based methods based on the OTUs from the 16S rRNA gene sequences (http://129.15.40.240/mena/). The network construction followed the methods of Deng et al. (2012). The co-occurrence patterns of bacterial taxa rely on Pearson correlation among taxa (Deng et al.2012). To ensure correlation reliability and improve statistical confidence, only those OTUs that were present in more than 50% individuals in each group were used for network construction. In order to compare the network topological features of bacterial communities under the same condition (Deng et al.2016), all pMENs from different groups were generated with an identical threshold (0.79). For each network, positive co-occurrences, average degree (avgK), average clustering coefficient (avgCC), density (D), average path distance (GD), betweenness centrality (BC) and modularity were calculated using the window ‘Global Network properties’ and ‘Module Separation and modularity calculation’ on the website (Deng et al.2012).
Determination of ecosystem stability
Ecosystem stability was measured specifically by a lower variability, which is defined as the squared coefficient of variation of alpha or beta diversity (Wang and Loreau 2014). A lower variability signifies higher ecosystem stability. The alpha (α = CV2species) and beta variability (β = CV2distance) of bacterial community in each gut compartment were calculated based on the method of Wang and Loreau (2014). In this framework, the alpha variability represents the local shifts of species diversity within a meta-community, while beta variability represents the spatial variation of community structure. The observed species (Vspecies) of bacterial community in each gut region was used to calculate alpha variability. The weighted UniFrac distance (Vdistance) of bacterial community within each group was used to calculate beta variability. In order to assess the relationship between biodiversity and microbial ecosystem stability in the GIT of pikas, linear regression analysis was carried out between observed species and alpha variability or beta variability.
RESULTS
The pH values across gut regions and host species
The pH of different gut regions (i.e. stomach, small intestine, cecum and colon) was measured in each pika species (Table S2, Supporting Information). The pH values were disparate across regions. The stomach exhibited a highly acidic environment (Plateau pikas, 2.22 ± 0.09; Daurian pikas, 2.77 ± 0.12), while other gut compartments were near neutral (Table S2). In addition, we compared the pH values of the same gut sections across species. Only the pH value of the stomach was significantly different between species (one-way ANOVA, F = 40.51, P = 0.003), while the rest of the gut showed no significant differences (P > 0.05, Table S2).
Differences in bacterial community compositions among gut regions and between host species
A total of 2574 020 sequences were generated from the 224 samples. Mean sequences per sample were 11 491 ± 6683 (mean ± standard deviation). After filtering out low-quality sequences, chloroplasts, chimeras, singletons and sequences not classifying to bacteria, we obtain 1873 122 sequences. To standardize the efforts across samples, each sample was rarefied to 3987 sequences. At a threshold of 97% sequence identity, 57 734 unique OTUs were identified from all samples using CD-HIT clustering method. The proportions of those OTUs that were taxonomically classified at genus/family/phylum level were 16.4%, 52.2%, 84.5%, respectively.
At phylum level, Firmicutes, Bacteroidetes, Proteobacteria and Spirochaetes were four identified dominant phyla (mean relative abundance >1%) in the pika digestive tract. The relative abundances of these phyla showed significant differences among gut regions (two-way ANOVA, region effect, P < 0.001 for all these phyla; Table S3, Supporting Information). Among the four phyla, Firmicutes and Bacteroidetes were enriched in the stomach, small intestine, cecum and colon, while Proteobacteria and Firmicutes comprised the majority of the community of mouth, plant and soil (Fig. 1). The relative abundances of Firmicutes and Bacteroidetes showed an increasing pattern from anterior to posterior (from mouth to colon). At genus level, the relative abundances of four dominant identified bacteria (Prevotella, Oscillospira, Streptococcus and Ruminococcus) showed marked differences among gut regions (two-way ANOVA, region effect, P < 0.001 for all dominant genera; Table S3). The genera Streptococcus, Prevotella, Corynebacterium and Ruminococcus were the four most dominant genera in pika mouth, while the major genera in stomach were only Prevotella and Oscillospira. The cecum and colon shared many dominant genera, including Prevotella, Oscillospira, Treponema and Ruminococcus. Notably, the small intestine was enriched with Prevotella, Candidatus Arthromitus and Oscillospira.
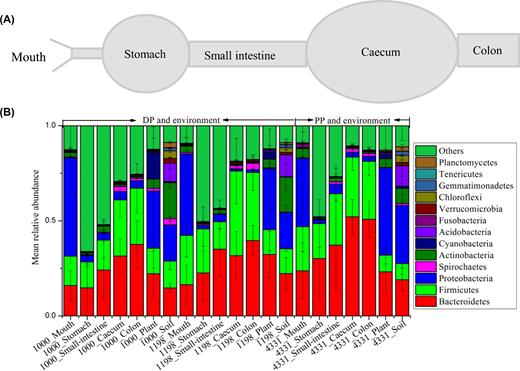
The schematic diagram of the pika gastrointestinal tract (A) and the compositions of bacterial communities at phylum level from the gastrointestinal tracts of pikas and surrounding environment (plant and soil) (B). 1000, 1198 and 4331 stand for altitudes. DP and PP are the abbreviation of Daurian and Plateau pikas, respectively.
The relative abundances of Firmicutes or Bacteroidetes were significantly different between host species (two-way ANOVA, species effect, P < 0.001 for these two phyla; Table S3), while Proteobacteria and Spirochaetes were not influenced by host species (two-way ANOVA, species effect, P > 0.05 for these two phyla; Table S3). In particular, Bacteroidetes in the cecum and colon of Plateau pikas showed higher abundance than those of Daurian pikas (F = 34.17, P < 0.05; F = 12.97, P < 0.05, respectively; Fig. 2), while the relative abundance of this phylum in mouth, stomach and small intestine was relatively stable (P > 0.05). At genus level, Prevotella in Plateau pikas showed higher abundance in the small intestine (F = 14.76, P < 0.001), cecum (F = 43.56, P < 0.001) and colon (F = 29.91, P < 0.001) than that in those corresponding regions of Daurian pikas (Fig. 2), while the relative abundances of Oscillospira in these three gut sites were consistent in two hosts (P > 0.05). The genera Streptococcus and Ruminococcus did not exhibit significant differences in all identical regions between both pika species (P > 0.05).

The comparison of bacterial communities at phylum or genus level in the same gut region between Plateau pikas and Daurian pikas. Only those phyla or genera with mean relative abundance >1% across all pika samples were shown. One-way ANOVA was used to test the differences. Significant differences (P < 0.05) are indicated by different letters. 1000, 1198 and 4331 stand for altitudes.
Alpha diversity of bacterial communities among gut regions and host species
To assess the bacterial diversity across gut regions, we calculated the Shannon diversity, evenness, observed species and phylogenetic diversity indices in each anatomical site (Fig. 3). The OTU-level rarefaction curve of observed species across all samples has reached close to stable values (Fig. S1, Supporting Information), indicating that most of the microbial diversity had already been captured in the current study. These alpha diversity measures exhibited significant differences in various gut regions (two-way ANOVA, region effect, P < 0.001 for all the alpha diversity values; Table S4, Supporting Information). All alpha diversity indices reached a maximum value in the cecum of Plateau pikas at 4331 m ASL or Daurian pikas at 1000 m ASL, while stomach communities revealed low microbial diversity in pikas from these two sites. For Daurian pikas living at 1198 m ASL, the colon showed highest diversity compared to other regions, while the mouth exhibited the lowest diversity values. However, there were no significant differences in alpha diversity measures between cecum and colon regardless of host species or sampling sites (P > 0.05). In general, alpha diversity measures in the cecum and colon were lower than those from soil, but higher than those from plant samples.

Alpha diversity measurements of gut regions in the pika gastrointestinal tract. One-way ANOVA was used to compare the differences. Significant differences between Plateau and Daurian pikas (P < 0.05) are indicated by asterisk.
Additionally, we compared the bacterial diversity in the same gut site between Plateau and Daurian pikas. The cecum of Plateau pikas had a higher Shannon diversity and evenness than that of Daurian pikas (two-way ANOVA, species effect, P < 0.05 for these two diversity measures; Table S4). All other regions showed a relatively similar alpha diversity measures (P > 0.05).
Beta diversity of the bacterial communities among gut regions and host species
NMDS was used to compare the differences in bacterial community structure across gut regions based on weighted UniFrac distance metrics. The bacterial community structure of Plateau pikas was mainly driven by gut region (4331PP, adonis R2 = 0.482, P < 0.001, Fig. 4) and also the animal individual (adonis R2 = 0.145, P < 0.05). However, the community structure of Daurian pikas was only driven by gut region (1000DP, adonis R2 = 0.517, P < 0.001; 1198DP, adonis R2 = 0.5, P < 0.001, Fig. 4). Body weight and sex had no impacts in shaping the community structure of Plateau and Daurian pikas (Table S5, Supporting Information). In particular, we found that any two non-adjacent gut sites in the pikas had highly divergent bacterial communities (Table S6, Supporting Information). However, the community structure between the adjacent cecum and colon or stomach and small intestine was similar (Table S6). Mantel test analysis further supported this finding, showing that the bacterial community structure in the cecum was highly correlated with that of the colon (Mantel test, Spearman's rho = 0.664, P < 0.001), and the stomach community was also related to that of small intestine (Mantel test, Spearman's rho = 0.276, P < 0.001). In addition, we tested whether the bacterial community was more similar within each gut compartment compared with other regions. For Daurian pikas, the community variation of small intestine, cecum and colon was consistent (one-way ANOVA, P > 0.05, Fig. 6a). For Plateau pikas, the cecum and colon showed significantly less variation in community structure compared with other gut sites (one-way ANOVA, P < 0.05, Fig. 6a).
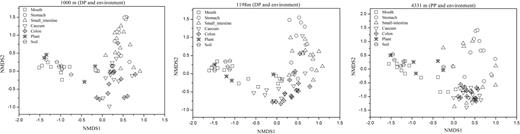
NMDS plots of the weighted-UniFrac dissimilarity index comparing the bacterial communities among gut regions in Daurian pikas from two low altitude sites (1000 and 1198 m ASL) and Plateau pikas from high altitude site (4331 m ASL).
Thereafter, we further compared the difference of community structure in the same gut region between Plateau and Daurian pikas (Fig. 5). The mouth and stomach community were similar between the two pika species (ANOSIM r = 0.05, P > 0.05; r = 0.06, P > 0.05, respectively), while the bacterial communities of the small intestine (ANOSIM r = 0.41, P < 0.001), cecum (ANOSIM r = 0.47, P < 0.001) or colon (ANOSIM r = 0.32, P < 0.001) showed significant differences. For Daurian pikas, we found that sampling site significantly influenced the communities of the small intestine (ANOSIM r = 0.20, P < 0.05), cecum (ANOSIM r = 0.3, P < 0.01) or colon (ANOSIM r = 0.15, P < 0.027), but it had no impacts in shaping the mouth and stomach bacterial communities (both P > 0.05). In addition, we also compared the dissimilarity of bacterial community between Plateau pikas and Daurian pikas (Fig. 6b). The bacterial communities of small intestine in Plateau pikas showed greater variation than those of small intestine in Daurian pikas, while the communities of cecum and colon in Plateau pikas had less variation than those of the cecum and colon in Daurian pikas.
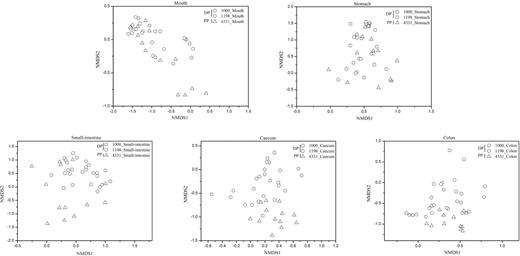
NMDS plots of the weighted-UniFrac dissimilarity index comparing the bacterial communities in the same gut region between Daurian pikas (DP) and Plateau pikas (PP).
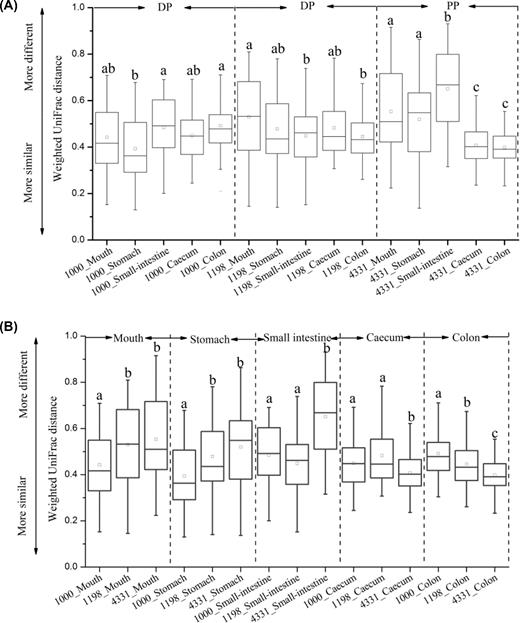
Interindividual variation of bacterial community structure within each group. (A) The variations among gut regions in each species. (B) The variations of the same gut regions between host species.
Topological features of bacterial networks across gut regions
Different gut regions showed great variations for topological features of bacterial networks. Network connectivity distribution curves fitted well with the power law model (R2 range of 0.753–0.949) (Table 1), indicating that the constructed networks were scale-free. The average degree (avgK), average clustering coefficient (avgCC) and network density (D) of stomach were higher than those of small intestine, cecum or colon (Table 1) regardless of host species or sampling sites, indicating that interspecies interactions in the stomach were more complex. In addition, compared with small intestine, cecum or colon, a lower average path distance (GD) and a higher connectedness (Con) in the stomach indicated that the interspecies interactions were better connected. Notably, we found that percentage of positive co-occurrence was the lowest in the cecum, suggesting less cooperative interspecies interactions in the cecum (Table 1).
Topological features of bacterial networks across gut sites in the pika digestive tract.
| Pika species | Gut regions | Total nodes | Total links | R2 of power law | Positive co-occurrence | Average degree (avgK) | Average clustering coefficient (avgCC) | Density (D) | Average path distance (GD) | Connect-edness (Con) | Between-ness centrality (BC) | Modu-larity |
|---|---|---|---|---|---|---|---|---|---|---|---|---|
| Daurian pikas | 1000_moutd | 205 | 962 | 0.753 | 23.2% | 9.385 | 0.125 | 0.046 | 2.607 | 0.868 | 0.122 | 0.333 |
| 1000_stomach | 171 | 1499 | 0.756 | 22.2% | 17.532 | 0.136 | 0.103 | 2.527 | 0.886 | 0.101 | 0.167 | |
| 1000_small intestine | 217 | 766 | 0.822 | 26.6% | 7.06 | 0.133 | 0.033 | 3.142 | 0.882 | 0.251 | 0.473 | |
| 1000_cecum | 354 | 2012 | 0.797 | 13.6% | 11.367 | 0.096 | 0.032 | 3.082 | 0.855 | 0.136 | 0.336 | |
| 1000_colon | 321 | 2086 | 0.814 | 23.3% | 12.997 | 0.129 | 0.041 | 2.754 | 0.868 | 0.084 | 0.273 | |
| 1198_mouth | 126 | 167 | 0.886 | 42.5% | 2.651 | 0.145 | 0.021 | 4.465 | 0.877 | 0.408 | 0.708 | |
| 1198_stomach | 168 | 274 | 0.776 | 32.8% | 3.262 | 0.086 | 0.02 | 3.517 | 0.842 | 0.323 | 0.64 | |
| 1198_small intestine | 203 | 303 | 0.832 | 44.9% | 2.985 | 0.07 | 0.015 | 3.568 | 0.728 | 0.221 | 0.699 | |
| 1198_ cecum | 298 | 342 | 0.949 | 24.3% | 2.295 | 0.045 | 0.008 | 3.538 | 0.566 | 0.134 | 0.801 | |
| 1198_colon | 319 | 466 | 0.93 | 28.7% | 2.922 | 0.053 | 0.009 | 4.432 | 0.815 | 0.167 | 0.73 | |
| Plateau pikas | 4331_mouth | 178 | 234 | 0.898 | 56% | 2.629 | 0.066 | 0.015 | 2.792 | 0.549 | 0.13 | 0.735 |
| 4331_stomach | 149 | 323 | 0.894 | 49.5% | 4.336 | 0.153 | 0.029 | 1.509 | 0.883 | 0.275 | 0.534 | |
| 4331_small intestine | 171 | 332 | 0.82 | 59.6% | 3.883 | 0.125 | 0.023 | 3.37 | 0.671 | 0.211 | 0.601 | |
| 4331_ cecum | 357 | 317 | 0.86 | 35.3% | 1.776 | 0.025 | 0.005 | 1.909 | 0.211 | 0.069 | 0.914 | |
| 4331_colon | 358 | 435 | 0.83 | 57% | 2.43 | 0.052 | 0.007 | 4.026 | 0.622 | 0.316 | 0.783 |
In addition, we also compared the topological features of bacterial networks in the same region between Plateau pikas and Daurian pikas. The network parameters showed certain differences between pikas species, as well as between two sampling sites for Daurian pikas. Notably, the cecum of Plateau pikas had lower values for avgk, avgCC and D than that of Daurian pikas, indicating that the former had less complex network interactions than the latter. However, the positive co-occurrence of the cecal communities in Plateau pikas was higher than that in Daurian pikas, indicating that the cecum of Plateau pikas harbored less cooperative interspecies interactions than that of Daurian pikas.
Microbial ecosystem stability of bacterial communities in the pika digestive tract
Alpha and beta variability were used to reflect the ecosystem stability at local and spatial scales in a meta-community. If a microbial community has a lower alpha or beta variability than another, then the former harbors a higher ecosystem stability, which means that the microbial diversity or community structure may have less variation under environmental stress (Wang and Loreau 2014, 2016). Our data showed that the alpha or beta variability of bacterial communities decreased gradually from mouth to colon (Fig. 7), indicating the ecosystem stability of bacterial communities had an increasing trend from mouth to colon. In addition, we tested the diversity–stability relationship in the ecosystem of pika digestive tract (Fig. S2, Supporting Information). We found that bacterial biodiversity decreased with alpha or beta variability, indicating a positive correlation between bacterial diversity and ecosystem stability in the pika alimentary canal.
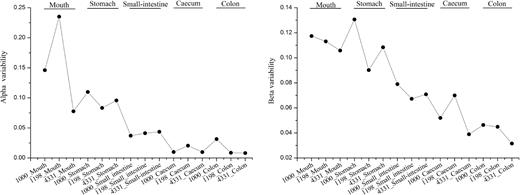
The alpha and beta variability of different gut regions in pikas. A lower alpha or beta variability of microbial community represents a higher ecosystem stability, which means that the microbial diversity or community structure has less variation under environmental stress.
DISCUSSION
Plateau pikas, which are widely distributed on the highest plateau in the world, play key ecological roles in grassland degradation, ecosystem diversity and soil nutrient cycles on the Qinghai-Tibet Plateau (Li et al.2013). Although there is an ever-increasing number of microbiota reports on humans and other low-altitude organisms (Ley et al.2008b; Linnenbrink et al.2013; Stearns et al.2011), few studies have explored the microbial communities associated with different gut regions in high-altitude animals. In this study, we systematically revealed how hosts and gut regions shape bacterial community composition, diversity, interactions and stability across the GIT in wild Plateau pikas and their low-altitude relative Daurian pikas. These results improve our understanding of gut microbial ecology for the wild hindgut-fermenting herbivorous mammals.
Previous studies have shown that the cecal bacterial communities of both pika species were dominated by Firmicutes and Bacteroidetes (Li et al.2016b). Our current datasets further support this observation, with these taxa constituting more than half of the total number of sequences in the small intestine, cecum and colon (Fig. 1). These taxa also dominated microbial assemblies in most other mammalian digestive systems (Ley et al.2008a; de Oliveira et al.2013). The mouth, on the other hand, is dominated by Proteobacteria, followed by Firmicutes and Bacteroidetes. Interestingly, roughly 54% of sequences in the stomach were assigned to unclassified bacteria, indicating the potential to discover novel bacterial taxa in this gut region. Beyond this unclassified group, Firmicutes and Bacteroidetes are, again, the most abundant phyla. Given that members of these phyla are known to be responsible for food fermentation (Ley, Peterson and Gordon 2006), and Firmicutes and Bacteroidetes showed increases in abundances from mouth to colon (Fig. 1), it is plausible that pikas select these taxa in the fermenting organs (cecum) where they are particularly enriched. Additionally, we found that the plant and soil microbiome in the surrounding environment were largely dominated by Proteobacteria. This finding was supported by previous studies (de Oliveira et al.2013; Li et al.2016b; Wu et al.2012), and suggested that host–gut microbial communities do not simply reflect the microbes encountered in their surrounding environments.
At genus level, Streptococcus was one of the dominant bacterial taxa in pika mouths (Fig. 2). This genus is also a major member of wild-type mice (Chun et al.2010) and healthy human microbiota (Zaura et al.2009), suggesting that Streptococcus may be a common bacterial member in mammalian oral microbiomes. Some species in this genus have been reported to be involved in pyruvate metabolism in human mouths (Jorth et al.2014). However, the functional role of this genus in the oral cavity of pikas needs to be further determined. Our previous work showed the cecum of pikas was mostly dominated by the genus Prevotella (Li et al.2016a,b,c). Current study further indicated that Prevotella (Bacteroidetes) was one of the most prevalent bacterial genera regardless of gut regions (Fig. 2), but was significantly enriched in the small intestine, cecum and colon of pikas. Interestingly, Prevotella spp. have been found in the microbiome of yaks and Tibetan sheep (Zhang et al.2016) where it is also enriched compared to low altitude cattle. These ruminants also live in the Qinghai-Tibet Plateau and the metabolic abilities of Prevotella (Strobel 1992) may contribute to their adaptation to living at such high altitudes (Zhang et al.2016). Prevotella spp. as well as Treponema and Ruminococcus are considered to be active decomposers of plant polysaccharides in herbivores (Warnecke et al.2007; Dai et al.2014). The small intestine of pikas also harbored high abundance (∼1.7%) of Candidatus Arthromitus. These are considered as commensal bacteria that adhere to intestinal mucus, and play an important role in the development of gut immune systems (Gaboriau-Routhiau et al.2009).
Our data also showed that food contents of pika cecum and colon had higher alpha diversity compared to other gut regions (Fig. 3). This finding was consistent with that of Lu et al. (2014), who showed that higher diversity was detected in the food bolus of cecum in wild rodents. The neutral pH in the cecum may offer a more conducive internal environment for the maintenance of greater diversity than highly acidic stomachs. For hindgut-fermenting pikas, the cecum is the main organ involved in the fermentation of plant-based food; thus, a diverse bacterial community may contribute a distinct set of digestive enzymes and improve food processing and digestion. High species diversity is generally associated with strong stability and performance. For instance, high microbial diversity in human gut communities positively correlates with fermentation efficiency of dietary fiber (Tap et al.2015). Likewise, high bacterial diversity in pika's cecum may offer more resilience against disturbance, diverse microbial metabolic pathways and facilitate energy extraction from recalcitrant plant polysaccharides. In addition, in an analogous manner to patterns in macroecology, diverse cecal communities may be more stable in ecosystem productivity and are easier to recover under environmental disturbance than more homogeneous assemblies (Tilman, Wedin and Knops 1996; Isbell et al.2015). Further research is needed to estimate the relationship between microbial diversity and function diversity or performance in the gut ecosystem.
The stomach of pikas had lower species diversity than the small intestine, cecum and colon. This pattern has also been found in humans (Stearns et al.2011) and C57BL/6 laboratory mice (Gu et al.2013). Likewise, pikas had significantly lower pH values in the stomach than those observed in other gut regions. Environmental bacteria normally associated with food or water might be susceptible to low pH values, and might die in the stomach’s acidic conditions. Therefore, the stomach may serve as a biological filter in pikas that prevents unwanted bacterial taxa colonizing the hindgut. Lowering environmental pH may lead to the exclusion of some pathogens in human stomachs (Kamada et al.2013); thus, some diseases associated with pathogens can be prevented. However, the question that which microbes may be influenced by stomach acidification remains unexplored.
Beta diversity analyses revealed that gut region significantly influenced the bacterial community structure regardless of sampling sites or pika species (Fig. 4). Differences in bacterial communities between gut chambers is likely driven by a combination of many factors, including pH, immune responses, nutrient supplies, host secretions, flow rate and oxygen concentrations(Zoetendal et al.2001; Hopkins, Sharp and Macfarlane 2002; Turnbaugh et al.2009; Kohl et al.2014). In addition, animal individual also affected the bacterial community structure of Plateau pikas, indicating that individuals from this pika species have their own unique or individualized bacterial communities across the GIT. Several factors can influence individual gut bacterial assemblies. First, differences between host genetics or immunity genes may lead to the individual variation of bacterial communities (Toivanen, Vaahtovuo and Eerola 2001). Second, individual differences could result from unique diet profiles (Li et al.2016a). Although Plateau pikas in our study were derived from a single habitat, each individual may still choose to eat different plant species, acquiring a distinct set of microbes. Third, host density has been shown to exert an effect on gut community structure (Li et al.2016c). Pikas living in dense groups are more likely to exchange microbes through coprophagy or skin contact, and thus have more similar bacterial assemblies than those living in smaller groups.
We found that the mouth or stomach community structure was similarly independent on host species or sampling sites, while these two factors significantly affected the bacterial communities of the small intestine, cecum or colon (Fig. 5). These results suggested that mouth or stomach communities may be mainly influenced by host factors, such as saliva (Wade 2013) and gastric acid (Von Rosenvinge et al.2013). For pikas, the similarity of these internal factors in mouth or stomach leads to similar bacterial communities between host species regardless of sampling sites. In contrast, the bacterial communities from small intestine, cecum or colon were likely affected by both internal (e.g. pH, oxygen concentrations and host genetics) and environmental (e.g. diet) factors (Zoetendal et al.2001; Hopkins, Sharp and Macfarlane 2002; Turnbaugh et al.2009; David et al.2014; Kohl et al.2014). Future studies should investigate the relative importance of internal and environmental factors in shaping bacterial communities along the GIT.
It seems that the small intestine had greater interindividual variation than the distal gut (cecum or colon) in pikas although this comparison was not significant in statistics for Daurian pikas (Fig. 6a). These results were consistent with those in humans (Booijink et al.2010), mice (Gu et al.2013) and dogs (Mentula et al.2005). The small intestine is mainly responsible for food digestion and utilization of nutrients, water and electrolytes (Gu et al.2013). The physicochemical factors in the small intestine exhibit greater interindividual differences than those in the distal gut (Deiteren et al.2010). It may be an important reason why the small intestine showed marked interindividual variation across the GIT. In addition, we found that the interindividual bacterial communities of cecum or colon in Plateau pikas were more conserved than those in Daurian pikas. In general, diet diversity decreases with increasing altitude, thus Plateau pika from high-altitude regions had lower diet diversity than Daurian pikas from low-altitude regions. Our results agreed with that lower diet diversity in wild sloths may lead to more similar gut microbial communities (Dill-McFarland et al.2015). Diet restriction and specialization in Plateau pikas living in high altitudes may lead to the ingestion of similar plant-associated microbiomes, thereby reducing the interindividual variation in the bacterial communities of cecum or colon.
Network analysis showed that topological features exhibited stark differences across the GIT (Table 1). The average degree (avgK), average clustering coefficient (avgCC) and network density (D) of stomach were higher than those of small intestine, cecum or colon (Table 1) regardless of host species or sampling sites, indicating that the stomach with lower alpha-diversity harbored more complex network interactions. The results were not consistent with those in many reports (Zhou et al.2010, 2011; Yao et al.2014), which indicated that microbial communities with higher alpha diversity harbored more complex interspecies interactions. However, our results were similar to one recent report (Shi et al.2016), which showed that network interactions were negatively correlated with microbial diversity. In addition, a lower average path distance (GD) and a higher connectedness (Con) in the stomach indicated that the interspecies interactions were better connected. Thus, we hypothesize that the low pH in the stomach may lead to the enrichment of certain microbes and promote the development of shared niches, which would concurrently decrease diversity but improve the microbial interactions of bacterial communities.
A lower average clustering coefficient and density indicates that bacterial networks are mainly composed of relatively isolated nodes or loose node groups, reflecting higher phylogenetic diversity and functional redundancy (Sun et al.2013). Our data showed that the cecum of Plateau pikas had lower average clustering coefficient (avgCC) and density (D) than that of Daurian pikas, implying that the former may harbor higher functional redundancy than the latter. Modularity is defined as the number and size of highly interconnected nodes or node groups within a network. A higher modularity value indicates a strong recovery capacity in response to small environmental perturbations but a weak recovery ability under large disturbances (Ruiz-Moreno, Pascual and Riolo 2006; Eldridge et al.2015). We found that the cecum of pikas had high modularity values, suggesting that the bacterial networks may exhibit a strong capacity to recover from small environmental disturbances but are relatively fragile in response to large environmental perturbations. Further research is needed to demonstrate this hypothesis. In addition, a low level of betweenness centrality (BC), as a result of low frequency of centralized nodes, was observed in the cecal bacterial communities. Several reports showed that centralized nodes are used to represent keystone species, which can exert a great influence on the ‘information’ flow through the microbial community (Bissett et al.2013; Eldridge et al.2015). These nodes provide important links between the connections of many other microbes and are generally considered as critical control points in bacterial networks (Ruiz-Moreno, Pascual and Riolo 2006; Bissett et al.2013). In addition, the percentage of positive co-occurrence was the lowest in the cecum, suggesting that a less cooperative interspecies interaction for bacterial communities in this region. Thus, a lower centralization of betweenness and a less cooperative interspecies interaction in the cecum indicated that the microbes had similar status in bacterial communities, implying that the loss of one or several bacterial species may not strongly impact the stability and function of the whole community. Further research is needed to demonstrate this inference. However, our network metrics were dependent on sequencing depth and data processing methods by only retaining OTUs that were present in at least 50% samples, which may have influenced the topological features of bacterial networks.
A low alpha and beta variability of bacterial community was observed in the cecum or colon (Fig. 7), implying that the bacterial species diversity and community structure have less variations under environmental disturbances (Wang and Loreau 2014, 2016). Both cecum and colon are far away from the source of outer environmental perturbations (i.e. mouth); thus, higher ecosystem stability was maintained in these sites. For the cecum, it is conducive to providing a favorable condition for the fermentation of plant polysaccharides. In addition, we found that a positive correlation between bacterial diversity and ecosystem stability in the pika digestive tract. These results indicate that high microbial diversity is beneficial for maintaining ecosystem stability in pika guts.
In conclusion, our study suggests that gut region and host species significantly affect the composition, diversity, structure, network interactions and ecosystem stability of bacterial communities in the pika GIT. Cecum and colon have higher bacterial diversity and ecosystem stability compared to other gut regions. In particular, the cecum is enriched by bacteria that are potentially involved in the degradation of plant polysaccharides. Most notably, Prevotella sp. is significantly enriched in the cecum of Plateau pikas living at high altitudes. The cecal bacterial networks had less cooperative interspecies interactions than other gut regions. The differences in bacterial community diversity and interactions related to hosts may reflect the evolutionary and ecology trajectory of animals’ adaptation to their habitats. Future studies are needed to investigate the gene functions of bacterial communities among gut regions and between pika species. This will shed light on whether plateau pika has taxonomically or functionally converged with those of other herbivores living in the Qinghai-Tibet Plateau, and how the gut communities enable these animals to exploit high-altitude ecological niches.
Sequence data accession number
The original sequence data are available at the European Nucleotide Archive by accession number PRJEB14755 (http://www.ebi.ac.uk/ena/data/view/PRJEB14755).
SUPPLEMENTARY DATA
Supplementary data are available at FEMSEC online.
Acknowledgements
The work was supported by Sichuan Province Science and Technology Project (2017SZ0004, 2017JY0231), Natural Science foundation of China (31670503), Open Found of Key Laboratory of Environmental and Applied Microbiology CAS (KLCAS-2016–03), and China Biodiversity Observation Networks (Sino BON).
Author contributions
The experimental design was conceived by HL and XL; experimental work was performed by HL, TL, JR, CL and XZ; HL finished the data analysis and original manuscript; HL, AB, ZX and XL revised the manuscript.
Conflict of interest. None declared.
