


Abstract
Land-use and their change have dramatic consequences for above-ground biodiversity, but their impact on soil microbial communities is poorly understood. In this study, soils from 19 European sites representing conversion of croplands to grasslands or forests and of grasslands to croplands or forests were characterized for microbial abundance and bacterial diversity. The abundance of Bacteria and Fungi but not Archaea responded to land-use change. Site was the major determinant of the soil bacterial community structure, explaining 32% of the variation in 16S rRNA gene diversity. While the quantity of soil organic carbon (SOC) only explained 5% of the variation, SOC when differentiated by its quality could explain 22%. This was similar to the impact of soil pH (21%) and higher than that of land-use type (15%). Croplands had the highest bacterial diversity. Converting croplands to grassland caused an increase of Verrucomicrobia; croplands to forest increased Rhizobiales but decreased Bacteroidetes and Nitrospirae; and grasslands to cropland increased Gemmatimonadetes but decreased Verrucomicrobia and Planctomycetes. Network analysis identified associations between particular SOC fractions and specific bacterial taxa. We conclude that land-use-related effects on soil microorganisms can be consistently observed across a continental scale.
INTRODUCTION
Anthropogenic land-use changes have been common across Europe for many centuries (Dupouey et al.2002; Stoate et al.2009). In recent years, the major land-use changes in most parts of Europe have been the conversion of croplands to grasslands or forests and of grasslands to croplands or forests (Schulze et al.2010; Fuchs et al. 2015, 2016). While the dramatic implications of such changes at the landscape level for the biodiversity of plants and animals are apparent and well recognized (Stoate et al.2001; Kleijn et al.2009), those for soil microbial communities are only poorly understood. Land-use change affects important ecosystem functions including carbon sequestration, climate regulation or water purification (Houghton 2003; Schroter et al.2005; Spurgeon et al.2013), and all of these are intimately connected to microbial activities. The microbial actors who provide or contribute to these processes in different land-uses and their tolerance or vulnerability to land-use changes, however, remain to be identified and characterized.
Croplands, especially when under tillage, provide a dynamic habitat for microorganisms with periodic destruction of microhabitats and homogenization by soil mixing in the plow layer (Giller et al.1997; Young and Ritz 2000). In contrast to forests, croplands and grasslands experience frequent removal of plant biomass, the addition of mineral and organic fertilizers, and the use of pesticides. Grassland and forest soils are commonly non-tilled and are thus vertically more stratified than cropland soils. In grasslands, the dense root system of herbaceous plants with high turnover provides abundant carbon sources to soil (Denef et al.2009; Robinson et al.2009; Heng et al.2016). In forests, the soil structure is typically more preserved and less dynamic. Carbon input to forest soils comes mainly from the litter layer on the soil surface by leaching and from root exudates of trees including fungal products from their associated mycosphere (Heng et al.2016). Consequently, cropland, grassland and forest soils have characteristic differences in soil structure, quantity and quality of nutrients and energy sources for microorganisms. All of these factors strongly influence the living conditions of microorganisms (Ranjard and Richaume 2001) and therefore, it can be anticipated that croplands, grasslands and forests harbor structurally and functionally distinct microbial communities.
Land-use change means the installation of new vegetation and soil management, which includes changes in the input of nutrients, removal of plant biomass and modifications of the soil structure, and it has been shown to affect soil organic carbon (SOC) stocks (Poeplau and Don 2013). Strong relationships between soil conditions and various bacterial taxa have been reported (Nusslein and Tiedje 1999; Hermans et al.2017). Thus, land-use change may exert a strong selective pressure on the soil microbial community triggering short-term adaptation of the current members of the community and, in the long term, a shift in community composition towards organisms better adapted to the new conditions. For instance, the new vegetation can provide different nutrients e.g. by rhizodeposition causing the growth of different bacterial taxa (Ciccolini et al.2016). The effects of land-use change on the soil microbial community structure have been studied under tropical (Jesus et al.2009; Lammel et al.2015; Schneider et al.2015) and temperate climate (Lauber et al.2008; Seuradge, Oelbermann and Neufeld 2017), yet the lack of studies on the effects of land-use changes on a larger geographical scale prevents gaining a more comprehensive view on the importance of land-use and land-use change for soil microbial abundance and diversity. For example, there is still no larger scale estimate about the similarity of microbial communities in soils under the same land-use but from different sites, the overlap of community composition between different sites, the degree of change in the composition of the soil microbial community in response to a land-use change or the variability of responsive microbial taxa across geographical scales.
The objective of this study was, therefore, to characterize soil microbial communities typical for certain land-use types and their responses to land-use changes and soil properties across a larger geographical scale. Our study included 19 European sites ranging north to south from Scotland to Italy, and from west to east from Ireland to Lithuania (Table S1, Supporting Information). All sites contained plots under different land-use and land-use change types: (A) cropland to grassland, (B) cropland to forest, (C) grassland to cropland and (D) grassland to forest. The abundance of Bacteria, Archaea, and Fungi was assessed by quantitative PCR of rRNA genes from DNA extracted from soil samples. The effects of land-use type, land-use change and soil properties on bacterial community structure were investigated with 454 pyrosequencing of 16S rRNA gene amplicons.
MATERIALS AND METHODS
Experimental design and sampling
The experimental design and sampling procedure have previously been described in detail (Poeplau and Don 2013). We sampled soils at 19 sites located in 10 countries across Europe, representing four different biogeographical regions (Table S1). Sites were selected to represent the typical land-use change types for the respective regions. Each site included plots arranged in pairs of one reference and one conversion plot. Reference plots were croplands or grasslands under the same land-use for over 100 years. Both the reference and the conversion plot within a pair were originally under the same type of land-use but land-use has been changed at the conversion plot. This change had occurred between a 16 to over 160 years before sampling (Table S1). Plots within the same site were adjacent to each other to ensure that they were located on similar soils. Most sites included one reference plot—conversion plot pair. One site (Vilnius) included two conversion plots representing two different land-use change types. At four sites (Flaibano, Hordorf 2, Kungsängen, Trenthorst), part of the area that has undergone land-use change has been subjected to land-use change a second time yielding a second conversion plot to which the first conversion plot acted as the reference plot. Over 100 years had passed between the first and second land-use change at these sites. In total, this study contained 43 plots (13 croplands, 12 forests and 18 grasslands) arranged in 24 reference plot—conversion plot pairs, each pair corresponding to one of four land-use change types: (A) cropland to grassland (six pairs), (B) cropland to forest (six pairs), (C) grassland to cropland (six pairs) and (D) grassland to forest (six pairs). For geographical coordinates of the sites, soil type, soil texture and climatic conditions, see Table S1. Within each plot, samples were collected from the upper 10 cm of the soil at six sampling points following a grid in a 14 m × 21 m area. The soils were dried at 40°C and sieved though 2 mm.
Soil chemical analyses and fractionation
Total SOC content and soil nitrogen content were measured separately from the six samples taken from a plot as previously described (Poeplau et al.2013) and expressed as % soil dry weight. The averages of the six measurements were used in further analysis. Parts of the six soil samples taken from the same plot were mixed, and 30 g of these composite samples were used to measure the quantity of the following five SOC fractions, as previously explained in more detail (Poeplau et al.2013): dissolved organic carbon (DOC, particle size <0.45 μm), particulate organic matter (POM, particle size >63 μm, low density), sand and stable aggregates (SA, particle size >63 μm, high density), resistant SOC (rSOC, particle size between 0.45 and 63 μm, resists oxidation), silt and clay fraction without the resistant SOC (SC-rSOC, particle size between 0.45 and 63 μm, oxidizable). The results were expressed as mg g−1 soil (dry weight). Soil pH in 1 M KCl was also measured from the composite samples.
The sampled soils included a wide range of textural classes from sand and sandy loam to silty clay and clay (Table S1). The pH of soil samples ranged from 3.2 to 7.2. The amount of recalcitrant SOC was between 1.26 and 14.4 mg g−1 soil, non-recalcitrant organic carbon associated with silt and clay ranged from 4.10 to 46.3 mg g−1, carbon in stable aggregates from 0.27 to 23.5 mg g−1, DOC from 0.09 to 1.07 mg g−1 and POM from 0.66 to 32.3 mg g−1 (Table S2, Supporting Information).
Soil DNA extraction and purification
DNA was extracted from four soil samples from each plot with FastDNA SPIN kit for soil (MP Biomedicals, Illkirch, France) from 0.5 g (dry weight) soil. The extraction included two bead beating steps of 45 s at 6.5 m s−1 on a FastPrep-24 instrument (MP Biomedicals) and additional washing steps of the binding matrix with 1 ml 5.5 M guanidine thiocyanate (Carl Roth, Karlsruhe, Germany) until the matrix regained its original color. The DNA extracts were quantified with Quant-iT PicoGreen dsDNA Assay Kit (Life Technologies, Thermo Fisher Scientific, Carlsbad, CA) in a Mithras LB 940 fluorimeter (Berthold Technologies, Bad Wildbad, Germany).
Quantitative PCR for assessing microbial abundance
Microbial abundance was determined by quantitative real-time PCR from all DNA extracts following the procedure of Hemkemeyer et al. (2015). Briefly, Bacteria and Archaea were quantified with primers and probes BAC338F, BAC805R, BAC516F (Yu et al.2005) and ARC787F, ARC1059R, ARC915F (Yu et al.2005), respectively. To quantify Fungi (Dikarya), the ITS1 region was amplified with primers NSI1 and 58A2R (Martin and Rygiewicz 2005). The PCR efficiencies were 98.4% (R2 = 0.9992) for Bacteria, 99.4% (R2 = 0.9997) for Archaea and 93.2% (R2 = 0.9994) for Fungi.
The averages of the results from the four samples from a plot were used in the statistical analysis. A log10 transformation was applied to improve the homogeneity of variance in the data. The rRNA gene copy numbers and the ratios of bacterial to fungal and bacterial to archaeal rRNA gene copy numbers under the three land-use types were compared using ANOVA and Tukey's HSD post hoc test in JMP 13.0.0 (SAS Institute). The tests were performed separately for bacterial, archaeal and fungal abundance and bacterial to fungal and bacterial to archaeal abundance ratios, and the resulting P-values were multiplied by 5 to correct for multiple testing. The effect of land-use change on microbial abundance and the bacterial to fungal and bacterial to archaeal abundance ratios was assessed with two-tailed, paired t-tests in R 3.3.1 (www.R-project.org). The method of Benjamini and Hochberg (1995) was applied to correct for multiple comparisons. Pearson's correlations between the qPCR results and quantities of the SOC fractions and the total SOC were calculated in JMP 13.0.0. Partial correlations were computed to assess the associations between each SOC fraction and the bacterial, archaeal and fungal rRNA gene copy numbers, as well as the ratios of bacterial to fungal and bacterial to archaeal rRNA gene copy numbers, with the effects of the other SOC fractions removed. The Benjamini-Hochberg method (see above) was used to correct for multiple testing.
Pyrosequencing and DNA sequence analyses
The pyrosequencing of 16S rRNA gene amplicons followed the procedure of Pilloni et al. (2012) with universal bacterial primers Ba27f (aga gtt tga tcm tgg ctc ag) and Ba519r (tat tac cgc ggc kgc tg) (Lane 1991) modified for pyrosequencing on the GS FLX Titanium system (Roche, Mannheim, Germany) with the Lib-L emulsion PCR method. Ten nucleotides long barcodes selected from the multiplex identifier standard 454 set (Roche) were integrated into the forward primers to distinguish sequences from samples from different plots. Primers were obtained from metabion international AG (Planegg, Germany). All DNA extracts, meaning four from each plot, were subjected to PCR, but the same forward primer barcode was used with the DNA extracts from the same plot. PCR was performed from each DNA extract in three replicate reactions with 1 μl template DNA, 0.4 μM forward and reverse primers, 0.2 mM of each dNTP, 1% dimethyl sulfoxide, reaction buffer including 1.8 mM MgCl2 and 1.25 U FastStart High Fidelity enzyme blend (Roche) in 25 μl final volume. The temperature program of the reactions was 2 min at 95°C, 30 cycles of 94°C for 30 s, 52°C for 30 s, 72°C for 60 s; and 5 min at 72°C. Products from the three replicate amplifications were pooled and purified from agarose gels with PCR Clean-Up and Gel-Extraction System (SLG, Gauting, Germany) and quantified with the Quant-iT PicoGreen dsDNA Assay Kit. Equimolar amounts of the purified PCR products were pooled for pyrosequencing which was performed at LGC Standards GmbH (Wesel, Germany) on 1 ¾ picotiter plates. The samples from the Edinburgh 2 site were lost decreasing the total number of samples for pyrosequencing to 41 and the number of replicates of the cropland to grassland land-use change type to 5. All DNA sequences obtained in this project are accessible through the European Nucleotide Archive (http://www.ebi.ac.uk/ena) by the accession number PRJEB22056.
The 2131 866 raw sequences were processed with mothur version 1.32 (Schloss et al.2009), USEARCH version 8.1.1831 (Edgar 2010) and VSEARCH version 1.95 (Rognes et al.2016). Sequences that did not include a barcode and the forward primer sequence with a maximum of one and two differences respectively were discarded. Barcode and forward primer sequences were then trimmed off. Average quality score values were calculated for 50 nt long segments, and sequences were truncated at the end of the last segment before the average quality score in a segment fell below 25. Sequences shorter than 400 nucleotides (nt) or containing a homopolymer longer than six nucleotides were discarded. Sequences were aligned to the SILVA reference version 123 (Pruesse et al.2007) to delete those which did not start at the appropriate positions. Gaps introduced by the alignment were then removed for further processing with USEARCH and VSEARCH. All sequences were truncated to a length of 400 nt and sequences that appeared only once in the dataset (singletons) were removed. Chimeric sequences were identified using the UCHIME de novo algorithm (Edgar et al.2011). Sequences were clustered into operational taxonomic units (OTUs) with USEARCH at a threshold of 97% sequence identity. The OTU centroid sequences were processed with Metaxa2 version 2.1 (Bengtsson-Palme et al.2015) to remove those that did not represent ribosomal RNA sequences. The quality-filtered sequences including the previously removed singletons were then mapped to the OTU centroid sequences with 97% sequence similarity threshold. The OTU centroid sequences were classified using the Ribosomal Database Project RDP reference version 14 (Cole et al.2014) in mothur. Taxonomic assignments with <70% bootstrap support were discarded. OTUs classified as chloroplast, mitochondria or eukaryotic were removed from the dataset.
Statistical analyses of the pyrosequencing data
Shannon and Simpson diversity indices were calculated with the vegan package version 2.4–0 (Oksanen et al.2016) in R and were analyzed with ANOVA and Tukey's HSD post hoc test in JMP. Pearson's correlations were calculated to evaluate if the diversity indices depended on sequencing depth. To assess the effect of the land-use change types on the soil bacterial diversity, two-tailed, paired t-tests were carried out in JMP to test if the difference between the diversity indices of the reference and conversion plots from the same land-use change type is significantly different from zero. Bonferroni correction was applied to account for multiple testing.
Differences in the soil bacterial community structure were visualized with non-metric multidimensional scaling (NMDS). OTUs that did not reach at least 0.20% relative abundance in at least one sample and did not have at least 50 sequences across all samples were excluded from this analysis. The resulting data matrix contained 284 841 sequences (2427–13 562 sequences/sample) in 665 OTUs with 50% sparsity. To correct for compositional effects and the differences in sequencing depth between the samples, centered log-ratio (CLR) transformation was applied (Gloor et al.2016) using the compositions package version 1.40.1 (Van den Boogaart and Tolosana-Delgado 2008) in R, after adding a pseudocount of 0.1 to all elements of the matrix. NMDS based on Euclidean distances was performed with the vegan package in R.
Using the CLR transformed data matrix, a set of variation partitioning analyses were applied with the vegan package in R to compare the amount of variation in the 16S rRNA sequence data explained by the site, LU type, soil pH, total SOC content, total soil N content and the five SOC fractions. Permutation tests were applied to assess the significance of the partial effects of the factors. The data were standardized whenever numerical variables measured in different units were compared. When comparing the amount of variation explained by the total SOC content and the proportions of the five SOC fractions, the SOC fractions were expressed as percentages of the total SOC content. Redundancy analyses followed by permutation tests were used with the vegan package in R to investigate which SOC fractions had significant overall and partial effects explaining variation in the pyrosequencing data. Bonferroni correction was applied to the resulting P-values.
Indicator species analysis from the labdsv R package version 1.8.0 (Roberts 2016) was used to identify OTUs and taxa characteristic to each land-use type. For OTUs, relative abundances were calculated considering all 4155 OTUs. For taxa, OTUs were merged based on their genus-, family-, order-, class- or phylum-level taxonomic classifications while binning OTUs not classifiable at a given taxonomic level into a single unit, and then relative abundances were calculated. To decrease the number of parallel tests, only OTUs and taxa with at least 0.20% average relative abundance in one of the three land-use types were included in the indicator species analysis. The P-values were corrected with the Benjamini-Hochberg method.
Two-tailed, paired Welch's t-tests were employed in R to identify OTUs and taxa that changed in relative abundance in response to land-use change. For each type of land-use change, OTUs that had at least 0.20% average relative abundance in either the reference or the conversion plots were selected and their CLR-transformed abundances taken from the data matrix prepared for the NMDS and variation partitioning analyses were used in the paired Welch's t-tests. In case of taxa, OTUs were merged based on their genus-, family-, order-, class- or phylum-level taxonomic classifications while binning OTUs not classifiable at a given taxonomic level into a single unit. The resulting matrices were subjected to CLR transformation after adding a pseudocount of 0.1 to all of their elements. The CLR-transformed abundances of those taxa that had at least 0.20% average relative abundance in either the reference or the conversion plots of a land-use change type were used in the paired Welch's t-tests. The P-values were corrected with the Benjamini-Hochberg method.
Network analysis was applied to explore associations of OTUs and the SOC fractions. To decrease the sparsity of the data, only the 75 most abundant OTUs that were detected in at least 10 samples were included. These OTUs contained 49.7% of the sequences in the dataset, and only 24.2% of the elements of the resulting matrix were zeroes. The data was relativized to the total number of sequences in each sample considering all 4155 OTUs. The SOC fractions were included in the analysis as features after dividing each value by the total value of that SOC fraction across all samples to bring the values of the five SOC fractions to a similar scale. The network was constructed in CoNet 1.1.1 beta (Faust and Raes 2016) under Cytoscape 3.4.0 (http://www.cytoscape.org) with the following settings: links between higher-level taxa were not explored; Pearson and Spearman correlations, mutual information (jsl setting), Bray-Curtis and Kullback-Leibler (with a pseudocount of 10−8) dissimilarities were calculated; the initial edge selection was set to include the 600 highest scoring edges from each of the five metrics and the 600 lowest scoring edges from each of the five metrics except for mutual information. The significance of the edges was calculated with the ReBoot method to remove compositional effects (Faust et al.2012) based on 1000 permutations with renormalization and 1000 bootstrap iterations. Edges not supported by at least three of the five metrics were removed and then Brown's method of P-value merging was applied followed by Benjamini-Hochberg correction for multiple comparisons. Only edges with q ≤ 0.05 were included in the final network. The network was visualized in Cytoscape with the yFiles organic layout. Topological parameters were calculated with NetworkAnalyzer version 2.7 in Cytoscape (Assenov et al.2008).
RESULTS
Soil microbial abundance
Differences between land-use types. There were significant differences between land-use types in the abundance of soil microorganisms as assessed by qPCR: grassland soils had higher bacterial rRNA gene numbers than forests (P < 0.001), and higher bacterial (P = 0.002) and fungal (P < 0.001) gene numbers than croplands (Fig. 1). Croplands had higher archaeal (P = 0.010) gene numbers than forests. The ratio of bacterial to fungal rRNA genes (Fig. S1, Supporting Information) was significantly higher in cropland than in forest soils (P = 0.004), while the ratio of bacterial to archaeal rRNA genes was significantly higher in forest than in grassland soils (P = 0.020).
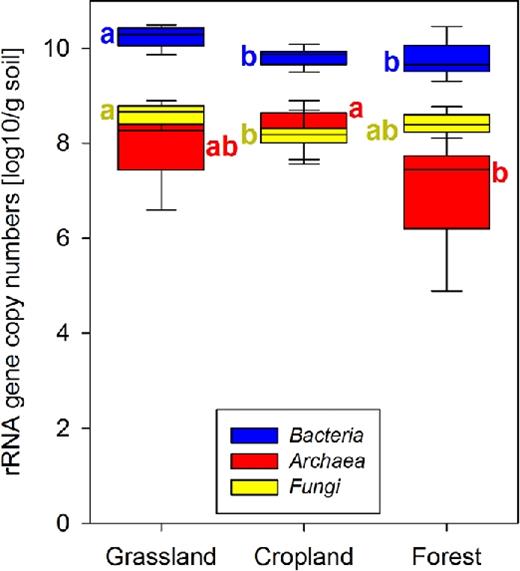
rRNA gene numbers of microbial groups in the different land-use types as assessed by qPCR. Box plot showing the first to the third quartile with a colored rectangle, the median with a segment within the rectangle, and the minimum and maximum values with whiskers. Letters indicate significant differences between land-use types (P < 0.05 after correcting for multiple testing).
Effects of land-use change. The conversion of croplands to grasslands was associated with a significant increase in the number of bacterial and fungal rRNA genes, as revealed by paired t-tests (Table 1). Accordingly, changing grasslands to croplands was characterized by a significant decrease in both. Afforestation of croplands significantly increased fungal rRNA gene abundance while afforestation of grasslands was associated with a significant decrease of bacterial abundance. The change of archaeal abundance due to land-use change showed large variation across the different sites and no significant responses to any of the land-use change types were detected. However, the conversion of croplands to grasslands was associated with a significant increase in the ratio of bacterial and archaeal rRNA gene copy numbers.
Fold changes in soil microbial rRNA gene numbers and their ratios in response to land-use change (average ± standard deviation).
| Cropland to grassland | Cropland to forest | Grassland to cropland | Grassland to forest | |||||
|---|---|---|---|---|---|---|---|---|
| Bacteria | 1.90 ± 0.72 | 0.009* | 1.04 ± 0.60 | 0.727 | 0.38 ± 0.24 | 0.003* | 0.44 ± 0.41 | 0.014* |
| Archaea | 0.71 ± 0.37 | 0.102 | 0.34 ± 0.47 | 0.050 | 9.34 ± 20.36 | 0.531 | 1.77 ± 3.21 | 0.327 |
| Fungi | 2.86 ± 1.49 | 0.017* | 3.17 ± 1.73 | 0.026* | 0.53 ± 0.30 | 0.016* | 0.66 ± 0.38 | 0.081 |
| Bacteria/Fungi | 0.89 ± 0.64 | 0.183 | 0.72 ± 1.00 | 0.076 | 0.74 ± 0.21 | 0.324 | 0.74 ± 0.48 | 0.220 |
| Bacteria/Archaea | 3.34 ± 2.00 | 0.009* | 37.39 ± 78.18 | 0.061 | 0.39 ± 0.27 | 0.131 | 3.52 ± 4.71 | 0.551 |
The P-values from paired t-test are shown in italics. *indicates significant differences after the Benjamini-Hochberg correction with 10% false discovery rate.
Effects of SOC. Total SOC showed positive correlations with bacterial (Pearson's r = 0.493, P = 0.004) and fungal (Pearson's r = 0.678, P < 0.001) but had no significant correlation with archaeal abundance. The SOC content did not affect ratios of bacterial to fungal and bacterial to archaeal rRNA gene numbers. None of the five SOC fractions had significant partial correlation with the rRNA gene abundance of Bacteria, Archaea or Fungi (P > 0.05, after correcting for multiple testing). In contrast, the ratio of bacterial to fungal rRNA genes correlated negatively with POM (Pearson's r = –0.518, P = 0.025).
Soil bacterial diversity in the three different land-use types
Pyrosequencing yielded 346 006 high-quality 16S rRNA sequences (3519–15 388 sequences/sample) binned into 4155 OTUs. Shannon and Simpson indices showed significantly higher bacterial diversity in cropland than in forest soils (Table 2). The Shannon index also indicated significantly higher bacterial diversity in cropland than in grassland soils (P = 0.007) and in grassland than in forest soils (P = 0.020). Neither of the diversity indices were affected by the sequencing depth (Shannon: Pearson's r = –0.157, P = 0.328; Simpson: Pearson's r = –0.206, P = 0.197).
Bacterial diversity indices of soils under different land-use and their response to land-use change (LUC; average ± standard deviation).
| Land-use | Shannon diversity | Simpson diversity |
|---|---|---|
| Cropland | 5.66 ± 0.31 A | 0.983 ± 0.014 A |
| Forest | 4.60 ± 0.64 C | 0.958 ± 0.024 B |
| Grassland | 5.10 ± 0.40 B | 0.970 ± 0.014 AB |
| LUC | Change in Shannon diversity | Change in Simpson diversity |
| Cropland to grassland | –0.46 ± 0.69 | –0.008 ± 0.013 |
| Cropland to forest | –0.73 ± 0.54 | –0.013 ± 0.016 |
| Grassland to cropland | 0.49 ± 0.26* | 0.015 ± 0.018 |
| Grassland to forest | –0.66 ± 0.82 | –0.020 ± 0.027 |
For land-use types, different capital letters indicate significant (P < 0.05) differences based on Tukey's HSD post hoc test. For land-use change, *indicates significant (P < 0.05) difference from zero based on paired t-tests with the Bonferroni correction.
Independent of land-use, the most dominant phyla were Proteobacteria, Actinobacteria, Firmicutes and Acidobacteria, which together had 92% average relative abundance in cropland soils, 93% in grasslands and 95% in forests (Table S3A, Supporting Information). Actinobacteria, Alphaproteobacteria, Bacilli and Betaproteobacteria were the four most abundant classes under all land-use types (Table S3B). The seven most abundant orders were also the same under the three land-use types: Bacillales, Rhizobiales, Actinomycetales, Gaiellales, Burkholderiales, Solirubrobacterales and Rhodospirillales (Table S3C). Among families, Bacillaceae and Rhizobiaceae were the most dominant, and at the genus level, Bacillus, Bradyrhizobium and Gaiella (Table S3D and E). It should be noted that some sites deviated from the order of dominant taxa reported here as indicated by the high standard deviations of the relative abundance values (see Table S3). The most dominant OTU in the dataset was classified as Bradyrhizobium (OTU1) and had 4.5% average relative abundance in croplands, 10.6% in grasslands and 11.2% in forests. The second most abundant OTU was a Bacillus (OTU8) which had 3.4%, 5.2% and 3.1% average relative abundance in croplands, grasslands and forests, respectively (Table S4, Supporting Information).
Taxa indicative of the land-use types were found at all taxonomic ranks (Table S5, Supporting Information). A total of 34 OTUs were detected as significant indicators of cropland soils, while there were 16 and 29 significant indicator OTUs of grasslands and forests, respectively. The OTUs with the highest indicator values for cropland soils were classified as Blastococcus, Nocardiaceae (both Actinobacteria), Paenibacillus (Firmicutes) and Nitrosospira (Betaproteobacteria). In grassland soils, the strongest indicator OTUs were classified as Streptomyces, Conexibacter, Solirubacterales (all Actinobacteria), Defluviicoccus (Alphaproteobacteria) and Spartobacteria (Verrucomicrobia). OTUs with the highest indicator values for forest soils were classified into Alphaproteobacteria, including two OTUs assigned to Rhizobiales, and to Actinobacteria including an OTU classified as Mycobacterium and one into Solirubrobacterales.
Responses of the soil bacterial community structure to land-use type and soil properties
On the NMDS plot, the samples group according to land-use type indicating that land-use affected the soil bacterial community structure (Fig. 2). Variation partitioning shows that land-use type explained 15% of the variation in the pyrosequencing data; however, which site the samples originated from was much more influential on the soil bacterial community structure explaining 32% of the variation (Fig. 3A and B). The total amount of SOC explained 5% of the variation in the data, but it could not explain a significant portion of the variation that was not also explained by site and land-use type (Fig. 3A). In contrast, the five SOC fractions could account for 22% of the variation in the soil bacterial community structure, and for 6% if the effects of site and land-use type were partitioned out (Fig. 3B). This is similar to the influence of soil pH that could explain 21% of the variation (Fig. 3C) and 5% excluding the variation also explained by site or land-use type. In comparison, soil N content could account for only 5% of the variation in the pyrosequencing data.
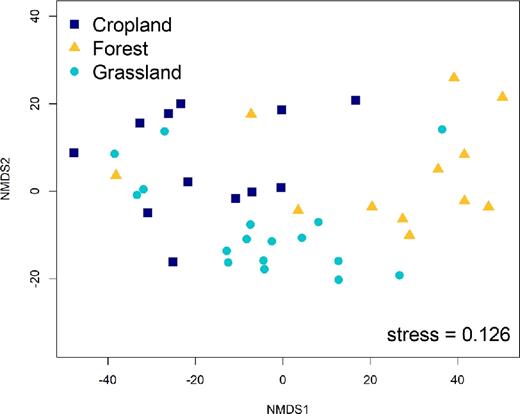
Non-metric multidimensional scaling (NMDS) plot.
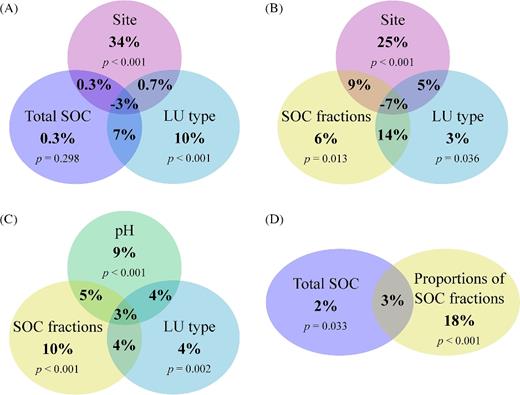
Variation partitioning results. Percent values indicate the proportion of the variation in the pyrosequencing data explained by each factor. The overall effect of a factor is the sum of all % values within its circle. The partial effects of the factors are the % values outside the partitions shared between circles. The P values are from permutation tests assessing if the partial effect of a factor is significantly different from zero. The shared partitions show the amount of variation that could be explained by both factors. Parts A–D are results from separate variation partitioning analyses.
Clearly, the composition of the SOC (i.e. the proportions of the SOC fractions) had a much larger influence on the soil bacterial community structure than the quantity of the SOC (Fig. 3D). Among the SOC fractions, POM had the largest influence on the soil bacterial community structure, as revealed by redundancy analysis, explaining 13.4% of the variation in the pyrosequencing data (P = 0.005) and 11.4% (P = 0.002) if the parts explained by any of the other SOC fraction were excluded. SA could explain 6.7% (P = 0.025) and 4.2% (P = 0.034) without the effects of the other fractions. DOC, SC-rSOC and rSOC could not explain significant parts of the variation.
Response of the soil bacterial diversity to land-use change
Land-use change did not affect the Simpson diversity index, but the Shannon index increased when grasslands were converted to croplands (Table 2). The conversion of croplands to grassland caused a significant increase of Verrucomicrobia, while turning croplands to forest caused an increase of Proteobacteria but a decrease of Bacteroidetes and Nitrospirae (Table 3). The conversion from grasslands to cropland resulted in decreasing Verrucomicrobia and Planctomycetes, but also in increasing Gemmatimonadetes. No significant phylum-level changes were detected in the conversion of grasslands to forest. For responses at other taxonomic ranks, see Table S6 (Supporting Information).
List of phyla which showed significant (10% false discovery rate) response to land-use change (LUC).
| Average relative abundance (%) ± SD | ||||||
|---|---|---|---|---|---|---|
| Corrected | Response | |||||
| LUC type | Phlyum | P-value | P-value | Old LU | New LU | to LUC |
| Cropland to grassland | Verrucomicrobia | 0.001 | 0.016 | 0.53 ± 0.33 | 1.13 ± 0.81 | Increase |
| Cropland to forest | Bacteroidetes | 0.006 | 0.049 | 0.82 ± 0.55 | 0.14 ± 0.16 | Decrease |
| Nitrospirae | 0.011 | 0.064 | 0.70 ± 0.70 | 0.04 ± 0.04 | Decrease | |
| Proteobacteria | 0.004 | 0.037 | 35.22 ± 6.48 | 35.41 ± 12.82 | Increase | |
| Grassland to cropland | Gemmatimonadetes | 0.001 | 0.016 | 0.26 ± 0.14 | 0.96 ± 0.55 | Increase |
| Planctomycetes | 0.009 | 0.060 | 0.82 ± 0.38 | 0.63 ± 0.23 | Decrease | |
| Verrucomicrobia | 0.003 | 0.037 | 2.46 ± 1.58 | 0.89 ± 0.38 | Decrease | |
| Grassland to forest | None | – | – | – | – | – |
The P-values were derived from paired t-tests and corrected according to the Benjamini-Hochberg method. Only phyla that had at least 0.20% average relative abundance in either the reference or the conversion plots of a LUC type were included in the analysis.
A total of 17 OTUs responded significantly to one of the land-use change types (Table 4) including several of the most abundant OTUs in the dataset, e.g. OTU1 (Bradyrhizobium), and OTU3, 7 and 10 (Rhizobiales). The sizes of the responses were in the range of less than 2-fold to 45-fold (Blastococcus OTU515). No OTUs were found to respond to the cropland to grassland land-use change type. In contrast, the conversion of croplands to forest caused the increase of the relative abundance of two rhizobia, including the most dominant OTU (OTU1 Bradyrhizobium), one OTU classified as Actinomycetales and one as Acidobacterium Gp1, while the relative abundance of OTU476 classified as Sphingomonas decreased. The conversion of grasslands to cropland was associated with a significant increase in the relative abundance of five OTUs representing Nocardioidaceae, Intrasporangiaceae, Blastococcus (Actinobacteria), Sphingomonas and Rhizobiales (Alphaproteobacteria), and a decrease of three OTUs classified into Rhizobiales, Acidobacteria subdivision 16 and Solirubrobacterales. Four OTUs, all classified into Alphaproteobacteria, responded to the afforestation of grasslands. Three of them, including one representing Rhizobiales and one Rhodospirillales, by increase in relative abundance and one, classified as Defluviicoccus, by decrease.
OTUs with significant (10% false discovery rate) response to land-use change (LUC).
| Average relative abundance (%) ± SD | |||||||||||
|---|---|---|---|---|---|---|---|---|---|---|---|
| LUC type | OTU no. | P-value | Corrected P-value | Reference | Conversion | Response to LUC | Phylum | Class | Order | Family | Genus |
| A. Cropland to grassland | None | – | – | – | – | – | – | – | – | – | – |
| B. Cropland to forest | 1 | 0.002 | 0.102 | 4.51 ± 2.12 | 11.3 ± 4.06 | Increase | Proteobacteria | Alphaproteobacteria | Rhizobiales | Bradyrhizobiaceae | Bradyrhizobium |
| 7 | 0.002 | 0.102 | 0.13 ± 0.16 | 2.04 ± 1.92 | Increase | Proteobacteria | Alphaproteobacteria | Rhizobiales | |||
| 53 | 0.004 | 0.102 | 0.08 ± 0.13 | 1.45 ± 1.32 | Increase | Actinobacteria | Actinobacteria | Actinomycetales | |||
| 115 | 0.004 | 0.102 | 0.03 ± 0.06 | 0.28 ± 0.26 | Increase | Acidobacteria | Acidobacteria Gp1 | ||||
| 467 | 0.001 | 0.102 | 0.31 ± 0.27 | 0.04 ± 0.07 | Decrease | Proteobacteria | Alphaproteobacteria | Sphingomonadales | Sphingomonadaceae | Sphingomonas | |
| C. Grassland to cropland | 3 | 0.002 | 0.102 | 3.08 ± 1.45 | 1.19 ± 0.73 | Decrease | Proteobacteria | Alphaproteobacteria | Rhizobiales | ||
| 47 | 0.000 | 0.089 | 0.13 ± 0.08 | 0.91 ± 0.87 | Increase | Actinobacteria | Actinobacteria | Actinomycetales | Nocardioidaceae | ||
| 52 | 0.002 | 0.102 | 0.60 ± 0.37 | 0.22 ± 0.16 | Decrease | Acidobacteria | Acidobacteria Gp16 | ||||
| 74 | 0.003 | 0.102 | 0.01 ± 0.02 | 0.43 ± 0.33 | Increase | Actinobacteria | Actinobacteria | Actinomycetales | Intrasporangiaceae | ||
| 75 | 0.003 | 0.102 | 0.40 ± 0.24 | 0.25 ± 0.21 | Decrease | Actinobacteria | Actinobacteria | Solirubrobacterales | |||
| 467 | 0.004 | 0.102 | 0.02 ± 0.02 | 0.31 ± 0.22 | Increase | Proteobacteria | Alphaproteobacteria | Sphingomonadales | Sphingomonadaceae | Sphingomonas | |
| 515 | 0.002 | 0.102 | 0.01 ± 0.01 | 0.45 ± 0.30 | Increase | Actinobacteria | Actinobacteria | Actinomycetales | Geodermatophilaceae | Blastococcus | |
| 710 | 0.001 | 0.102 | 0.04 ± 0.07 | 0.21 ± 0.16 | Increase | Proteobacteria | Alphaproteobacteria | Rhizobiales | |||
| D. Grassland to forest | 10 | 0.002 | 0.102 | 1.65 ± 1.22 | 7.06 ± 7.69 | Increase | Proteobacteria | Alphaproteobacteria | Rhizobiales | ||
| 13 | 0.003 | 0.102 | 0.13 ± 0.15 | 2.29 ± 3.83 | Increase | Proteobacteria | Alphaproteobacteria | ||||
| 25 | 0.004 | 0.102 | 0.03 ± 0.03 | 1.07 ± 2.22 | Increase | Proteobacteria | Alphaproteobacteria | Rhodospirillales | |||
| 181 | 0.000 | 0.089 | 0.37 ± 0.35 | 0.02 ± 0.04 | Decrease | Proteobacteria | Alphaproteobacteria | Rhodospirillales | Rhodospirillaceae | Defluviicoccus | |
The P-values were derived from paired t-tests and corrected according to the Benjamini-Hochberg method. Only OTUs that had at least 0.20% average relative abundance in either the reference or the conversion plots of an LUC type were included in the analysis. Taxonomic classifications with ≥70% bootstrap support are shown.
Associations between members of the soil bacterial community and the SOC fractions
The association network was constructed from the 75 most dominant OTUs (Table S7, Supporting Information) and the five SOC fractions. The resulting network contains 639 edges and consists of a single connected component with a network diameter of six and average shortest path length of 2.35 (Fig. 4A). Network centralization is 0.261 and heterogeneity is 0.590. On average, nodes have 16.2 neighbors and the network density is 0.207.
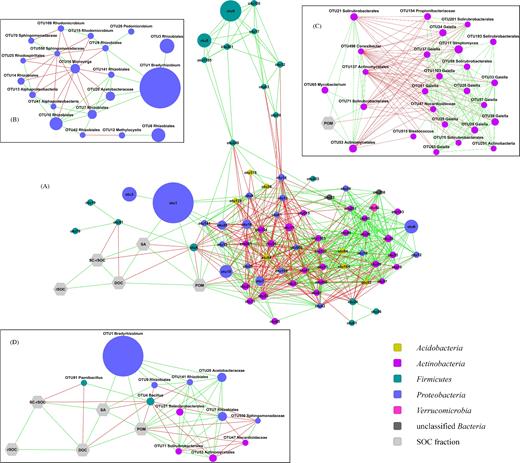
Association network of OTUs and SOC fractions. OTUs are represented by circles, SOC fractions by hexagons. The size of the OTU nodes reflects their relative abundance, and they are colored based on their phylum-level classification. Green edges indicate positive and red edges mean negative associations. (A) The whole network with yFiles organic layout. (B) Subnetwork of the OTUs from phylum Proteobacteria in a manually arranged layout. (C) Subnetwork of the OTUs from phylum Actinobacteria and POM in a manually arranged layout. (D) First neighbors of the SOC fractions in a manually arranged layout. In panels B, C and D, the lowest level taxonomic classification with at least 70% bootstrap support was added to the labels of the OTU nodes.
OTUs representing the genus Gaiella have a central location in the network, as indicated by the high number of connections (27.6 ± 4.5 edges) and low average shortest path lengths (1.99 ± 0.16). In contrast, most OTUs from phylum Firmicutes had a low number of connections (6.8 ± 4.7 edges) and higher average shortest path lengths (2.94 ± 0.54). They show positive associations with each other but, with the exception of Bacillus OTU240, only negative connections to other OTUs.
The OTUs from the phylum Proteobacteria show positive connections with each other, except for Microvirga OTU16 and OTU550 from the family Sphingomonadaceae which both have only negative associations with other OTUs within this phylum (Fig. 4B). OTUs from the phylum Actinobacteria separate into two groups with one consisting of six, and the other of 20 OTUs (Fig. 4C). Nodes within each group are connected with positive edges, but there are only negative associations between the groups. Three out of the six OTUs in one group are positively associated with POM.
The SOC fractions show positive connections with each other and are connected to a small number of OTUs (Fig. 4D). There are no significant associations between rSOC and any of the OTUs in the network, while SC-rSOC, SA and DOC are connected to two OTUs each. POM shows the most associations with OTUs among the SOC fractions. It is positively associated with OTUs from Solirubrobacterales, Actinomycetales, Acetobacteraceae and Rhizobiales, including the most abundant Bradyrhizobium OTU1. POM has negative connections to one Nocardioidaceae, one Sphingomonadaceae OTU and to Bacillus OTU4. This OTU4 has the highest betweenness centrality (0.1266) and stress value (9076) in the whole network, indicating that it could be a keystone member of the soil bacterial communities. The taxonomic classification and relative abundance of the OTUs included in the network analysis are listed in the Supplementary File S1. Node attributes and the whole network in a gdl format are also provided in the supplement (Supplementary File S2).
DISCUSSION
The sites included in this study represented soils from different biogeographical regions across Europe. These soils differed in the climatic conditions and pedogenesis, their mineral composition, texture, quantity and quality of organic carbon and pH. They were also different in regard to their previous and current vegetation and management. Considering all these factors, it is not surprising that ‘site’ was a major factor, explaining 32% of the variation in the soil bacterial community structure. Among the measured soil parameters, pH was highly influential, explaining 21% of the variation. This prominent importance of pH as a factor for shaping soil microbial diversity has already been reported in a number of studies considering geographical ranges similar to those of this study (Fierer and Jackson 2006; Griffiths et al.2011; Lauber et al.2013).
The quantities of SOC and total soil nitrogen were found to have a similar degree of influence on the structure of the soil bacterial community (5% of the variation in the pyrosequencing data). However, measuring only the total quantity of SOC overlooks the actual importance of SOC for structuring the bacterial communities. We applied a fractionation protocol to distinguish five SOC pools differing in functionality and turnover rates (Zimmermann et al.2007). This approach has recently been applied to analyze plant-derived carbon input into soil, climate change effects on grassland and the sensitivity of SOC stocks to different land-use changes (Dondini et al.2009; Xu, Liu and Kiely 2011; Poeplau and Don 2013; Wiesmeier et al.2014). In this study, the five fractions explained 22% of the variation in the soil bacterial community structure having a similar degree of influence as soil pH. The impacts of the individual SOC fractions strongly differed: POM and SA had a significant influence on the soil bacterial community structure explaining 13.4% and 6.7% of the variation in the pyrosequencing data, respectively. These two SOC fractions differ from the others in their larger particle size. Due to their size, soil bacteria may not just utilize POM and SA particles as substrates but also as microhabitats that harbor distinct microbial communities. This may contribute to their impact on the bacterial community structure. Furthermore, POM is regarded to consist of plant material at a relatively early stage of decomposition still bearing properties of the above ground plant biomass (Zimmermann et al.2007). Due to the differences in vegetation in different land-use types, it is likely that microbial communities involved in POM degradation and inhabiting POM particles will be different between land-uses. The larger impact of POM compared to SA on the soil bacterial community structure is in accordance with the slower turnover rate of the SA fraction (Zimmermann et al.2007). The lack of significant effect of rSOC is not unexpected considering its resistance to oxidation. The fraction associated with silt and clay particles contained the largest portion of the total SOC in most soil samples, yet it had no significant influence on the soil bacterial community structure. This is likely the result of chemical stabilization of this SOC fraction by physicochemical binding to silt and clay particles (Six et al.2002). Unlike rSOC and SC-rSOC, DOC is unprotected and readily accessible to soil bacteria. Its quantity at one time point, however, may not reflect its influence on the community structure due to its rapid turnover. The differences between the impacts of the SOC fractions also became apparent in the network analyses results, where no significant associations were found between OTUs and the rSOC fraction but many with POM. Thus, our results are in agreement with the postulated different dynamics of the five C-pools (Zimmermann et al.2007).
Land-use types (cropland, grassland, forest) selected for different abundances of bacteria and fungi, as estimated by the abundance of their rRNA genes. Bacteria were more prevalent in grasslands, which can be explained by the higher density of roots leading to larger area of rhizosphere which is known to provide nutrients to soil bacteria and increase their density in comparison to bulk soil (Solly et al.2014). Fungi were less prevalent in croplands than in grasslands. It can be imagined that typical soil management practices used on croplands, especially tillage, would have adverse effects on the development of fungal mycelial networks (Miller, McGonigle and Addy 1995; Schalamuk and Cabello 2010). Archaea were less abundant in forest soils than in croplands. It should be noted that the forest plots had an average age of 45 years, while 11 out of the 13 cropland plots were under the same land-use for over a hundred years. We speculate that the development of archaeal communities may take more time due to lower growth rates compared to bacteria or fungi. A comparative assessment of the archaeal diversity between land-use types, which was not conducted in this study, would be necessary to test this theory.
Bacterial diversity was significantly higher in cropland soils than in grasslands and forests. This is in contrast with the idea that disturbance decreases microbial diversity and is in line with the results of other studies analyzing bacterial communities from tropical soils (Mendes et al.2015). Soil disturbances as they occur in croplands by tillage have at least three important effects on soil microbial life: (1) they destroy larger aggregates thus likely cause a loss of microhabitats; (2) they transfer above ground plant biomass into the soil; and (3) they mix soils and rearrange the spatial context of microbial communities and substrates. While the destruction of microhabitats and soil homogenization should result in a loss of microbial taxa and thereby decrease diversity, the rearrangement and the transfer of above ground plant biomass should make nutrients more accessible for microbial metabolism and thereby possibly enhance growth of diverse bacteria. Spatial separation of microbial cells and substrates are a key factor which limits microbial activities and growth, and thus mixing should increase bacterial diversity.
Bacterial taxa detected in this study were not much different from those found in other surveys of soil bacterial diversity (Uroz et al.2010; Siles and Margesin 2016; Yan et al.2016; He et al.2017). Independent of the land-use type, the most dominant OTU in our study was classified as Bradyrhizobium. Members of this genus are frequently found among the dominant soil bacteria when 16S rRNA gene-based, cultivation independent methods are applied. We can only speculate about the apparent success of this OTU in European soils: it could be related to its capacity for autotrophic growth (Yuan et al.2012; Wu et al.2015), growth under oxic and anoxic conditions (Shrestha et al.2009; Ryuda et al.2011), versatility for degrading aromatic compounds (Gentry et al.2004) or mobilization of phosphate (Hermans et al.2017; Luo et al.2017). Due to its dominance within the bacterial community, metagenomic approaches should be able to reveal the genetic potentials of this OTU. Furthermore, several Bradyrhizobium strains have already been isolated as pure cultures on soil condition-optimized nutrient media (Hamaki et al.2005; Falk, Liu and Braker 2010; Senechkin et al.2010). Similarly, it would be rewarding to investigate why other bacterial taxa found in this study were so dominant in soils across Europe.
Land-use change at our study sites occurred 16 to over 160 years before sampling. We assumed this time to be sufficient for the soil bacterial community to move from transition state to equilibrium. We could not investigate the effect of time in our analysis because the numbers of sites for each land-use change type were too small for reaching solid conclusions. However, we were able to identify OTUs and taxa at most taxonomic ranks which responded to land-use change. Phylum Verrucomicrobia and order Rhizobiales, which had 1.4% and 24.6% average relative abundance across all samples respectively, increased in the conversion of croplands to grassland and decreased where grasslands were turned into cropland. These complementary responses indicate that the soil bacterial communities in the conversion plots were in fact similar to those of the reference plots of the same land-use.
Except for the conversion of croplands to grassland, OTUs responding to land-use change were detectable, and they came from only three phylogenetic lineages: Alphaproteobacteria, Actinobacteria and Acidobacteria. Among these OTUs, the most dominant ones, regardless of the land-use change type, were members of the order Rhizobiales (Alphaproteobacteria). The responsiveness of Rhizobiales and other Alphaproteobacteria to land-use change has also been reported for afforestation in other studies (Ren et al.2016, 2017; Lin et al.2017).
In conclusion, this study demonstrates the specific effects of land-use and land-use change on soil microbial communities which can consistently be observed across a continental scale (Europe). Confirming the importance of the soil pH in structuring microbial communities, the composition of SOC appears to be just as influential. Network studies, as applied here, can make a strong contribution to link SOC quality to the presence of specific bacterial taxa and thus increase our knowledge on the guiding principles of microbial diversity in soils.
SUPPLEMENTARY DATA
Supplementary data are available at FEMSEC online.
Acknowledgements
We thank Jana Usarek for excellent technical assistance.
FUNDING
This work was supported by the FP7 project GHG-Europe of the European Union (grant no. 244122).
Conflict of interest. None declared.
