


Abstract
1,2-Dichloroethane (DCA) is a problematic groundwater pollutant. Factors influencing the distribution and activities of DCA-degrading bacteria are not well understood, which has hampered their application for bioremediation. Here, we used quantitative PCR to investigate the distribution of putative DCA-dehalogenating bacteria at a DCA-impacted site in Sydney (Australia). The dehalogenase genes dhlA, tceA and bvcA were detected in all groundwater samples (n = 15), while vcrA was found in 11/15 samples. The 16S rRNA gene sequences specific to the dehalogenating genera Dehalobacter, Desulfitobacterium and Dehalogenimonas were detected in 15/15, 13/15 and 13/15 samples, respectively, while Dehalococcoides sequences were found in 9/15 samples. The tceA, bvcA and vcrA genes occurred in the same samples as Dehalococcoides and Dehalobacter. Microcosm experiments confirmed the presence of bacteria capable of dechlorination under anoxic conditions. The abundance of the dhlA gene, which is found in hydrolytic DCA degraders, was positively correlated to the DCA concentration, and was unexpectedly most abundant in samples with low oxygen conditions. A dhlA-containing bacterium isolated from the site (Xanthobacter EL8) was capable of anaerobic growth on DCA under denitrifying conditions. The presence of diverse DCA-dehalogenating bacteria at this site indicates that natural attenuation or biostimulation could be valid approaches for site cleanup.
INTRODUCTION
Chlorinated hydrocarbons (CHCs) such as 1,2-dichloroethane (DCA) have been widely used as solvents, and as precursors for plastics manufacture. Improper use and disposal practices have led to extensive groundwater contamination with DCA at many industrial sites (Squillace et al.1999), which is of concern due to the toxicity and suspected carcinogenicity of this chemical (Gwinn et al.2011). DCA is xenobiotic, and as such, biodegradation is usually slow, with contamination persisting for many years or even decades in the environment (Benker et al.2008).
There is increasing interest in the use of bioremediation for the clean-up of CHCs such as DCA (Semrau 2011; Perez-de-Mora et al.2014; Frascari, Zanaroli and Danko 2015). Aerobic bacteria can grow on DCA as a carbon and energy source via either a hydrolytic pathway (in Xanthobacter and Ancylobacter (Janssen, Scheper and Dijkhuizen 1985; van den Wijngaard et al.1992)) or a monooxygenase-mediated pathway (in Pseudomonas and Polaromonas (Hage and Hartmans 1999; Nishino et al.2013)). The hydrolytic pathway is initiated by DhlA (DCA dehalogenase), while the monooxygenase pathway is initiated by a cytochrome p-450; in both cases, the pathways proceed via chloroacetate, to yield glycolate. Obligate anaerobic bacteria such as Dehalococcoides (DHC), Desulfitobacterium (DSB), Dehalobacter (DHB) and Dehalogenimonas (DHG) can grow on DCA as an electron acceptor (Maymó-Gatell, Anguish and Zinder 1999; De Wildeman et al.2003; Grostern and Edwards 2009; Moe et al.2009). The anaerobic DCA biodegradation pathway is mediated by reductive dehalogenases (RDases), which catalyse dichloroelimination, yielding ethene (Marzorati et al.2007; Grostern and Edwards 2009). These RDases have varying activities on different organochlorines; for example, Dehalococcoides strains BAV1 and 195 contain bvcA and tceA genes, respectively. The Rdase BvcA can dechlorinate mono-, di- and trichloroethene as well as 1,2-DCA (Tang et al.2013), while TceA can dechlorinate TCE (Magnuson et al.2000), and VcrA can dechlorinate mono-and di-chloroethenes (Müller et al.2004). To date, the oxidative and hydrolytic DCA biodegradation enzymes (p450, dhlA) have only been found in aerobic bacteria (Janssen, Scheper and Dijkhuizen 1985; van den Wijngaard et al.1992; Hage and Hartmans 1999; Nishino et al.2013; Munro, Liew and Coleman 2013), while the reductive dehalogenase enzymes have only been found in strictly anaerobic bacteria (Magnuson et al.2000; Müller et al.2004; Marzorati et al.2007; Grostern and Edwards 2009; Tang et al.2013).
Bacteria that biodegrade CHCs are not uniformly distributed in nature (Hendrickson et al.2002; Dowideit et al.2010); their relative abundances and activities at a particular site will determine which bioremediation approach is most appropriate, i.e. monitored natural attenuation (Istok et al.2012), biostimulation (Frascari, Zanaroli and Danko 2015) or bioaugmentation (Maes et al.2006). Quantitative, sensitive and specific methods are required to monitor and guide the bioremediation process, and to enable linkage of specific bacterial types to specific degradative activities. These approaches may be based on culturing (e.g. microcosms; Giddings, Liu and Gossett 2010), analytical chemistry (e.g. compound-specific isotope analysis; Damgaardet al.2013), molecular biology (e.g. quantitative PCR (qPCR); Perez-de-Mora et al.2014) or combinations of these methods.
qPCR has been a very useful tool for microbial ecology, including for studies of bioremediation. In particular, many studies have used qPCR to quantify anaerobic dehalogenating bacteria of the genus Dehalococcoides (Lee et al.2008; Matturro et al.2013; Mayer-Blackwell et al.2014; Padilla-Crespo et al.2014), which are implicated in biodegradation of diverse organochlorines. qPCR is especially useful in these cases due to the fact that all research on Dehalococcoides to date indicates that these are obligate organohalide respirers, and thus the presence of their 16S rRNA gene sequences are reliable indicators of organohalide respiration (Taş et al.2010; Leys, Adrian and Smidt 2013). In the case of hydrolytic or oxidative DCA degraders, 16S rRNA gene sequences are not as useful as indicators of dehalogenation (e.g. most Xanthobacter spp. do not degrade DCA), and thus PCR approaches aimed at catabolic genes such as dhlA and p450 are needed for reliable molecular detection of these DCA degraders (e.g. Munro, Liew and Coleman 2013).
The Botany Industrial Park in south Sydney (Australia) is impacted by several kinds of chlorinated pollutants, including DCA, which is the main contaminant of concern. At this site, several dense non-aqueous phase liquid (DNAPL) sources of DCA are present in the subsurface—these have generated a large contaminant plume in the groundwater, which is highly mobile in this sandy aquifer (Jankowski and Beck 2000; Acworth 2001). Currently, the groundwater pollution at this site is managed via a large network of extraction wells linked to a groundwater treatment plant, where air stripping and thermal oxidation are used to remove DCA and other pollutants (www.oricabotanytransformation.com). Due to the cost- and energy-intensive nature of this process, a more sustainable method for managing the contaminant plume is desirable in the longer term.
Our laboratories have previously worked independently on aerobic and anaerobic approaches to bioremediation of chlorinated pollutants at the Botany Industrial Park site (Yee et al.2010; Zemb et al.2010; Le and Coleman 2011; Lee et al.2012; Munro, Liew and Coleman 2013). In particular, the Coleman lab has shown that aerobic dhlA-containing DCA degraders (Xanthobacter and Starkeya spp.) are present in activated carbon filters at the groundwater treatment plant (Munro, Liew and Coleman 2013), while the Manefield lab has shown that anaerobic Dehalobacter and Desulfitobacterium spp. capable of dihaloelimination of DCA are present in the vicinity of a subsurface reactive iron barrier (Zemb et al.2010). These studies suggest that diverse types of DCA-degrading bacteria may be widely distributed at the Botany site.
In this study, we undertook a systematic qPCR-based survey of both hydrolytic and reductive DCA dehalogenators in groundwater at the Botany Industrial Park site. Our aims were to determine the abundance and distribution of DCA degraders at the site, to gain insights into which type of dehalogenating bacteria were likely to influence DCA biodegradation in situ and to correlate particular types of DCA degraders to particular physicochemical conditions.
EXPERIMENTAL PROCEDURES
Groundwater sample collection and DNA extraction
Groundwater samples (n = 15) were collected from monitoring wells at the Botany Industrial Park and surrounding locale between 6 September 2012 and 13 September 2012. Details of the well construction and sampling protocol are given in the Supporting Information. Maps of the site can be obtained from www.oricabotanytransformation.com. Samples were obtained from surface waters (n = 2), from the shallow regions of the aquifer (defined here as 3–6.5 m below ground surface (bgs), n = 7) and from the deep regions of the aquifer (20–27 m bgs, n = 6). Sampling from the aquifer was performed using peristaltic pumping from bundle piezometer wells. Samples (300 mL) were collected in sterile polypropylene bottles and stored on ice (several hours), then at 4°C (up to 7 days) until processing for DNA extraction.
Biomass and other particulates were collected onto mixed cellulose ester filters (47 mm diameter, 0.22 μm pore size) by vacuum. The volume of groundwater filtered in each case varied from 20 to 300 mL, depending on the turbidity (turbid samples clogged the filter more quickly), with the exact volume recorded in each case. Filters with attached biomass were frozen at –20°C, then thawed and added to 2-mL screw-cap tubes containing two glass beads (5 mm diameter), and subjected to bead-beating using a FastPrep Instrument (MP Biomedicals, Santa Ana, CA, USA) for 30 s. The fragmented filters were then suspended in a lysis solution and DNA extracted by bead-beating according to a previously described generic protocol (Yeates et al.1998). The yield and quality of DNA were confirmed by agarose gel electrophoresis and UV transillumination, via comparison to a standard DNA ladder (data not shown)—this was done by standard methods (Sambrook and Russell 2001), except that the GelRed stain (Biotium, Fremont, CA, USA) was used instead of ethidium bromide.
Physicochemical analyses of groundwater
Analyses of the physical and chemical properties of the groundwater samples were performed by Golder Associates (St. Leonards, New South Wales, Australia). The relevant variables measured were DCA concentration, pH, dissolved oxygen (DO), temperature, electrical conductivity (EC), total dissolved solids (TDS) and redox potential (Eh). Details of the analytical methods are given in the Supporting Information.
Oligonucleotide primers
Primers DHLA-380F (GATTTTTGGGGCTGACCTTA) and DHLA-548R (GATGGCGTAACCAGATCGTA) were previously designed (Munro, Liew and Coleman 2013) to amplify a 168 bp fragment of the dhlA gene—these primers were confirmed to be specific for dhlA using the primer-BLAST tool (NCBI), and by PCR with genomic DNA of Xanthobacter EL4, a DCA-degrading isolate from the Botany site (Munro, Liew and Coleman 2013). The universal eubacterial primers 357f (CCTACGGGAGGCAGCAG) and 518r (ATTACCGCGGCTGG) (Lane 1991) were used to quantify bacterial 16S gene copies. The quantification standards for dhlA and 16S qPCRs were PCR products of the dhlA and 16S genes of Xanthobacter EL4, obtained using the primers DHLA-319F/DHLA-603R (Munro, Liew and Coleman 2013) and 27f-518r (Lane 1991), respectively. PCR products for use as qPCR standards were purified by excision from agarose gels using a QIAquick® kit (Qiagen, Hilden, Germany). DNA concentrations were calculated by gel quantification, via comparison to a standard DNA ladder (Quantity One software, BioRad, Hercules, CA, USA).
Dehalococcoides 16S rRNA genes were amplified using primers Dco728F (AAGGCGGTTTTCTAGGTTGTCAC) and Dco944R (CTTCATGCATGTCAAAT) (Smits et al.2004). Dehalobacter 16S rRNA genes were amplified using primers DRE445F (GGAAGAACGGCATCTGTG) and DRE1248R (GGCTTCCGTTCCGTCTG) (Bunge, Ballerstedt and Lechner 2001). Desulfitobacterium 16S rRNA genes were amplified using primers DSB406F (GTACGACGAAGGCCTTCGGT) and DSB619R (CCCAGGGTTGAGCCCTAGGT) (Smits et al.2004). Dehalogenimonas 16S rRNA genes were amplified using primers BL-DC-631F (GGTCATCTGATACTGTTGGACTTGAG) and BL-DC-796R (ACCCAGTGTTTAGGGCGTGGACTACC) (Yan et al.2009). The vcrA gene was amplified using primers QvcrAF (CGGGCGGATGCACTATTTT) and QvcrAR (GAATAGTCCGTGCCCTTCCTC), tceA with QtceAF (ATCCAGATTATGACCCTGGTGAA) and QtceAR (GCGGCATATATTAGGGCATCTT), and bvcA with QbvcAF (AAAAGCACTTGGCTATCAAGGAC) and QbvcAR (CCAAAAGCACCACCAGGTC) (Ritalahti et al.2006).
Quantitative PCR
Reactions were performed in two separate laboratories, using either Method I or Method II, described below. Method I was used to amplify dhlA genes and total 16S rRNA genes, and used SYBR Green® PCR Master Mix (Applied Biosystems, Foster, CA, USA) and 0.5 μM primers made up to a total volume of 20 μL with sterile Milli-Q water, with reactions done in a StepOnePlus Real-Time PCR System (Applied Biosystems) for 40 cycles. Method II was used for all other qPCR assays, and used SSoFast EvaGreen qPCR supermix (Bio-Rad) and 0.1 μM primers, made to a total volume of 10 μL with sterile Milli-Q water, with reactions done in a CFX96 Touch Real-Time PCR detection system (Bio-Rad) for 45 cycles. All qPCR mixtures were supplemented with 100 ng/μL bovine serum albumin to minimise PCR inhibition (Wang, Olson and Chang 2007). Thermocycling conditions are described in detail in Table S2 (Supporting Information). Standard curves were prepared from 10-fold serial dilutions of target DNA (either plasmid-cloned PCR products or gel-purified PCR products, see Table S3, Supporting Information, for details). All reactions were performed in triplicate. Melt curves were examined and the presence of a single peak was used to infer the presence of a single amplicon. A summary of the equations, R2 values and efficiencies of the standard curves for different qPCR assays is given in Table S3. Quantitation limits were determined based on the range of the standard curves. Tables S5 and S6 (Supporting Information) indicate which samples had copy numbers below the quantitation limits.
Statistical analysis of correlations in data
Spearman's rank correlation coefficient (ρ) was used to examine the relationship between the qPCR targets and measured physicochemical parameters of the groundwater, with significance based on a two-tailed test at P < 0.05. All averages are presented plus/minus (±) the standard error of the mean.
Testing DCA biodegradation in vitro with dhlA-containing bacteria
Xanthobacter strain EL8 was previously isolated by enrichment on DCA, using material from a membrane bioreactor in the groundwater treatment plant at the Botany site as the inoculum (Munro, Liew and Coleman 2013) (Genbank JX515585). Cultures were grown in 30 mL medium, in 120 mL crimp-sealed serum bottles, at 30°C with shaking at 200 rpm. The mineral salts medium used for cultivation of strain EL8 contained (per litre): 2093 mg MOPS, 23 mg K2HPO4, 120 mg MgSO4.7H2O, 12.7 mg Na2EDTA.H2O, 5 mg FeSO4.7H2O, 2 mg ZnSO4.7H2O, 1 mg CaCl.2H2O, 1.04 mg MnSO4.H2O, 0.2 mg CuSO4.5H2O, 0.4 mg CoCl2.6H2O, adjusted to pH 7. The basal medium was supplemented with 45 μmol of DCA per bottle, corresponding to an initial DCA nominal concentration of 1.5 mM, assuming all DCA dissolved in the aqueous phase. Either ammonia (5 mM (NH4)2SO4) or nitrate (10 mM KNO3) was added as the sole nitrogen source; note that in the case of nitrate, this could also act as an electron acceptor. The bottles were inoculated to an initial OD600 of 0.20 with cells grown on R2A agar, and then incubated aerobically (air headspace) or anaerobically (medium and headspace sparged for 10 min with N2 gas).
Testing anaerobic dechlorination in enrichment cultures
Anaerobic enrichment cultures were established using aquifer sediments taken from the Southlands area (near WG238), and groundwater from well WG238, at 4–5 m bgs. Sediment (10 g) was added to 160 mL of nitrogen-purged anoxic groundwater (pH 4.5) in a 200-mL serum bottle (Wheaton, Millville, NJ, USA). DCA (3 mM) was added as electron acceptor, and emulsified vegetable oil Newman Zone (RNAS, Brooklyn Center, MN, USA) (230 mg/L) and ethanol (2 mM) were added as carbon sources and electron donors. Incubation was static in the dark at room temperature. Following complete DCA conversion to ethene (576 days), the culture was transferred (10% vol/vol) to basal salts medium supplemented with vitamins (Wolin, Wolin and Wolfe 1963; Löffler, Sanford and Ritalahti 2005), DCA and ethanol. Three more transfers were done before setting up the triplicate cultures used for quantitative analysis in this study. Triplicate killed controls were set up at the same time by autoclaving the inoculated medium (121°C for 20 min) and adding 0.025 g/L mercuric chloride before amending with DCA and ethanol.
Triplicate enrichment cultures targeting perchloroethylene (PCE) and 1,1,2-trichloroethane (1,1,2-TCA) respiring microorganisms were constructed by adding 2 g of aquifer sediment (same as above) to 80 mL of bicarbonate-buffered basal salts medium (Löffler, Sanford and Ritalahti 2005) in 120-mL serum bottles. Microcosms were amended with PCE (100 μM) or 1,1,2-TCA (100 μM) as electron acceptor, and lactate (5 mM) as electron donor. Methanogenesis was inhibited by adding 5 mM bromoethanesulfonic acid. Triplicate abiotic killed controls were set up by autoclaving after inoculation, but before PCE/1,1,2-TCA and lactate amendment. Cultures were incubated statically in the dark at room temperature. The bacterial community in the anaerobic enrichments was analysed by tag pyrosequencing as described in a previous study (Beckmann and Manefield 2014).
RESULTS AND DISCUSSION
Physicochemical properties of the Botany groundwater
Physicochemical data from groundwater analyses are detailed in Table 1. The groundwater at the Botany site was generally acidic, most likely due to volatile fatty acids derived from microbial breakdown of natural peat materials; acetic acid in particular was readily detectable in the groundwater (∼50 mg/L). The deep aquifer samples tended to be more acidic (average pH 5.3 ± 0.2, range 4.7–5.7) than the shallow aquifer samples (average pH 5.9 ± 0.4, range 4.2–7.5), while the surface waters were closer to neutral (pH 7.3, 7.5). As dehalogenation releases HCl, the acidic aquifer conditions could also reflect dehalogenation, especially in the deeper parts of the aquifer, closer to the source DNAPL. The DO measurements from the deep aquifer samples were typically low, but non-zero (average 0.93 ± 0.21 mg/L, range 0.35–1.77), while the shallow aquifer samples had higher DO (average 3.62 ± 1.21 mg/L, range 0.67–9.63). The redox potentials (Eh) of the samples did not follow any clear correlation with sampling depth, with deep (average 190 ± 11 mV, range 136–202) and shallow (average 183 ± 25 mV, range 33–219) sets similarly distributed.
Physicochemical analysis of groundwater samples.
| Well | Depth (m bgs) | [TCA] (mg/L) | [DCA] (mg/L) | [PCE] mg/L | [TCE] (mg/L) | [VC] (mg/L) | DO (ppm) | TDS (mg/L) | pH | Eh (mV) | Temp (°C) |
|---|---|---|---|---|---|---|---|---|---|---|---|
| BP054 | 6 | <0.001 | <0.001 | <0.001 | <0.001 | <0.001 | 5.92 | 106 | 5.03 | 219 | 19.4 |
| BP054 | 27 | <0.001 | 0.756 | <0.001 | 0.001 | 0.04 | 0.91 | 1325 | 5.52 | 136 | 19.7 |
| BP056 | 6 | <0.001 | <0.001 | <0.001 | <0.001 | <0.001 | 1.94 | 91 | 6.16 | 205 | 21.0 |
| BP056 | 27 | <0.001 | 14.8 | <0.001 | 0.034 | 0.49 | 1.77 | 1167 | 5.77 | 201 | 22.9 |
| BP057 | 3 | <0.001 | <0.001 | <0.001 | <0.001 | <0.001 | 9.63 | 134 | 4.20 | 218 | 17.4 |
| BP057 | 27 | <0.001 | 1.94 | <0.001 | <0.001 | 0.3 | 0.78 | 2778 | 4.66 | 201 | 18.4 |
| BP072 | 3 | <0.001 | 0.008 | <0.001 | <0.001 | 0.08 | 2.57 | 274 | 6.17 | 202 | 19.9 |
| BP072 | 23 | <0.001 | 1.18 | <0.001 | <0.001 | 0.02 | 0.35 | 1860 | 5.01 | 202 | 20.7 |
| BP076 | 4 | <0.001 | 0.019 | <0.001 | 0.001 | <0.001 | 0.67 | 1202 | 5.57 | 201 | 19.7 |
| BP076 | 26 | 0.317 | 584 | 1.36 | 4.09 | 5.43 | 1.23 | 1932 | 5.10 | 200 | 20.1 |
| BP114 | 4 | <0.001 | <0.001 | <0.001 | <0.001 | 10.4 | 0.98 | 1068 | 6.62 | 200 | 19.6 |
| BP114 | 20 | <0.001 | 0.006 | 0.01 | 0.064 | <0.001 | 0.56 | 12840 | 5.68 | 201 | 19.7 |
| BP115 | 6.5 | <0.001 | <0.001 | <0.001 | <0.001 | <0.001 | 3.64 | 1015 | 7.49 | 33 | 22.7 |
| SW030 | surface | <0.001 | 0.002 | <0.001 | <0.001 | 0.01 | 5.83 | 16440 | 7.30 | 193 | 19.6 |
| SW052 | surface | <0.001 | <0.001 | <0.001 | <0.001 | <0.001 | 4.80 | 337 | 7.48 | 203 | 14.3 |
The deeper groundwater samples had higher DCA concentrations, TDS and EC than the shallow samples. The average DCA concentration for deep samples was 100 ± 97 mg/L (range 0.006–584), while the average DCA concentration for shallow samples was 0.004 ± 3 mg/L (range <0.001–0.019). The average TDS for deep samples was 3650 ± 1850 mg/L (range 1170–12 800), while the average TDS for shallow samples was 556 ± 193 mg/L (range 91–1200). These data were consistent with previous published work (Jankowski and Beck 2000; Acworth 2001), and information from site managers, which indicated that the contaminant concentrations were generally higher in the deeper sections of the aquifer (20–30 m bgs).
Chloride analyses gave the same pattern as DCA analyses, i.e. increasing Cl− concentrations with depth, which is consistent with in situ dechlorination of DCA. Although chloride analyses were not available from all monitoring wells, two useful data sets were analysed in more detail, as follows. First, pooling the chloride data from wells with three broadly defined depth screens (shallow/intermediate/deep) (MWC04, MWC05, MWC06, MWC08, MWC11, MWC13, MWC16, MWC18 and MWC19) gave averages of 1.4 ± 1.5 g/L (shallow), 3.6 ± 2.9 g/L (intermediate) and 4.5 ± 3.6 g/L (deep). Second, examination of data from two wells with matching and narrowly defined depth screens (BP62 and BP114; screened at 6, 10, 14, 16, 20 m bgs) showed a consistent trend of increasing chloride with depth in both cases (Fig. S1, Supporting Information).
Some groundwater samples from the deep sections of the aquifer contained detectable levels of other chlorinated aliphatic pollutants (data not shown); these were present at much lower concentrations than DCA. As an example, the most heavily contaminated sample (BP076-26 m bgs) contained 584 mg/L DCA, 0.4–1.5 mg/L of chlorinated methanes, 0.3–1.2 mg/L of tri- and tetra-chloroethanes, and 0.6–10.4 mg/L of chlorinated ethenes. The presence of the daughter products VC and cis-1,2-DCE indicated that the higher chlorinated ethenes and/or ethanes in the contaminant plume were being metabolised by indigenous anaerobes (Hendrickson et al.2002; Lorah and Voytek 2004) (this was confirmed by microcosm experiments—see below). VC could also be derived from abiotic hydrolysis of DCA, or may have been a primary pollutant, since VC was historically manufactured on site. The less-abundant chlorinated pollutants were significant because these may have exerted a toxic effect on the aquifer microflora (Maymó-Gatell, Anguish and Zinder 1999; Koenig, Groissmeier and Manefield 2014).
Analysis using Spearman's correlation matrices (Fig. 1) indicated that for the set of groundwater samples examined in this study there were positive correlations between all the families of chlorinated pollutants present, which matches information from site managers regarding the presence of multiple overlapping contaminant plumes at the site. These correlations were strongest in the case of DCA vs total volatile CHCs and DCA vs total chlorinated ethanes, which again emphasises the fact that DCA was by far the major pollutant in this set of groundwater samples.
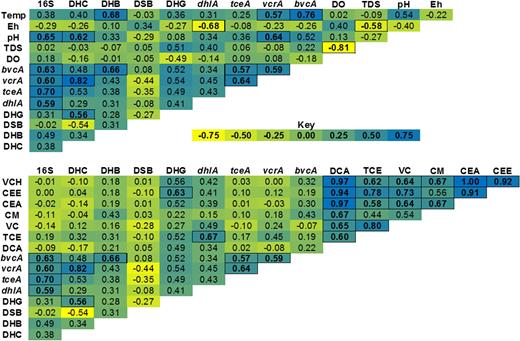
Spearman's correlation matrices of genetic and physicochemical parameters for aquifer samples. Positive correlations are shown in blue, negative correlations are shown in yellow and a lack of correlation is shown in green. Cells with dark borders represent statistically significant correlations (p < 0.05, two-tailed t-test). Surface water samples were not included in this analysis. Abbreviations not previously defined are: VCH: total volatile chlorinated hydrocarbons; CEE, total chlorinated ethenes; CEA, total chlorinated ethanes; CM, chloromethanes.
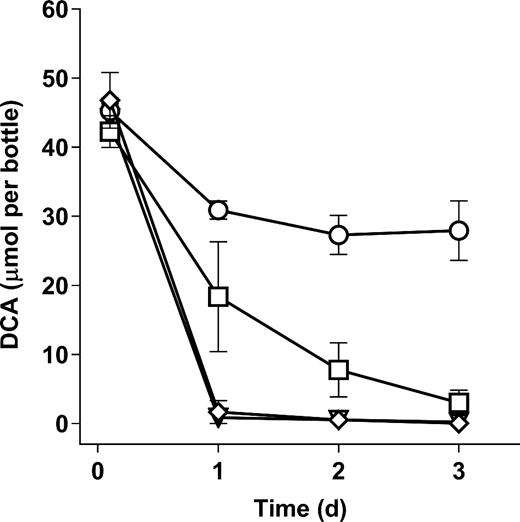
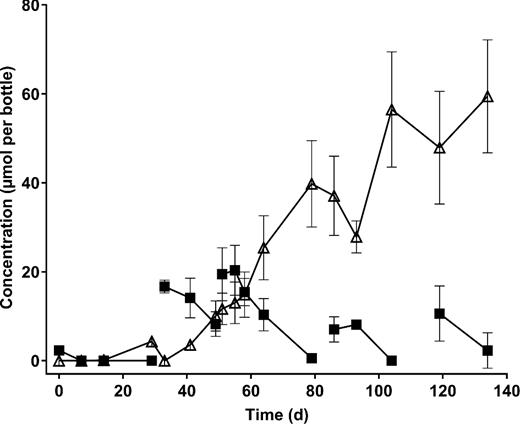
Effect of aeration and N sources on DCA biodegradation by Xanthobacter EL8. Data points indicate the mean of three replicate cultures, and error bars show the standard deviation. The test conditions are as follows; open circles, anaerobic with NH4+; open squares, anaerobic with NO3−; open diamonds, aerobic with NH4+; inverted triangles, aerobic with NO3−.
Total bacterial abundance based on 16S rRNA gene qPCR (357f-518r)
The number of 16S rRNA genes detected in the Botany groundwater varied between samples, ranging from 7.9 × 10³ gene copies per mL in BP065 (2 m bgs) up to a maximum of 8.2 × 10⁶ gene copies per mL in BP114 (20 m bgs) (Table S5). The 16S rRNA gene abundance was comparable in the deep and shallow samples (average 2.00 × 10⁶ and 1.56 × 10⁶ gene copies per mL, range 1.34 × 10⁴ to 8.19 × 10⁶ and 1.35 × 10⁴ to 3.91 × 10⁶, respectively). There was a significant positive correlation between pH and the abundance of 16S rRNA genes (ρ = 0.65), indicating that bacteria tended to be more abundant in the samples with pH values closer to neutral.
Non-significant positive correlations were seen between the abundance of total 16S rRNA genes and all of the specific 16S rRNA genes from dehalogenating anaerobes (DHC, DHB, DHG) (Fig. 1). Significant positive correlations were also seen between the copy number of 16S rRNA genes and dehalogenase genes (dhlA, bvcA, vcrA and tceA). The overall picture that emerges from these correlation analyses was that the areas in the subsurface with the highest numbers of dehalogenating bacteria also tended to be the areas with the highest overall bacterial numbers.
Abundance of hydrolytic DCA degraders based on dhlA qPCR
The dhlA gene was detected in all 15 samples tested, at levels ranging from 65 gene copies per mL (BP072, 23 m bgs) up to 2700 gene copies per mL (BP054, 27 m bgs) (Table S6, Supporting Information). The ratio of dhlA gene copies to 16S rRNA gene copies in the samples suggested that the proportion of bacteria in the sample capable of hydrolytic DCA biodegradation was between 0.01% and 5.3% of the total bacterial community (not accounting for disparity in gene copy number). Interestingly, a significant negative correlation between Eh and dhlA was seen (ρ = –0.68).
Since there are prior reports of Xanthobacter spp. able to grow under anoxic conditions via denitrification (Gomez et al.2005; King 2006), we tested if a dhlA-containing Xanthobacter isolate previously isolated from the Botany site (Xanthobacter flavus strain EL8) (Munro, Liew and Coleman 2013) could biodegrade DCA under denitrifying conditions (Fig. 2). This was shown to be possible, although the DCA degradation was about 50% slower under denitrifying conditions compared to aerobic conditions. A minor decrease in DCA was noted for the negative control under anoxic nitrate-free conditions; however, this could be explained by residual (non-growth linked) dehalogenase activity in the cells.
Abundance of reductive dehalogenators based on genera-specific 16S rRNA gene qPCR
The reductively dehalogenating genera investigated were each found to be present in the majority of samples, with each sample having at least two of the four genera above the qPCR detection limit (∼400 gene copies/mL). DHB had a widespread distribution and was detected in all samples, DSB and DHG were detected in 13/15 samples, and DHC was only detected in in 9/15 samples. The number of genus-specific 16S rRNA gene copies corresponding to the anaerobic dehalogenators was highly variable, ranging from undetectable up to 7900 per mL, with most samples between 10 and 100 gene copies per mL. The abundances of sequences from DHC, DHB and DHG were all positively correlated with each other (ρ values 0.28 to 0.56), though this was only statistically significant for DHG and DHC (Fig. 1), suggesting cohabitation was occurring between these reductive dehalogenators.
Abundance of anaerobic DCA degraders based on tceA, vcrA and bvcA qPCR
Both tceA and bvcA were detected in all samples, up to a maximum of 1670 gene copies per mL (average 1540 ± 109) and 533 gene copies per ml (average 85 ± 23), respectively (Table S6). The vcrA gene was less widely distributed, and was below detection limits in 4/15 samples, but was abundant where detected, at levels up to 7130 gene copies per mL (average 710 ± 500). Previous studies have also noted the high spatial heterogeneity of these dehalogenases (Lee et al.2008; Carreon-Diazconti et al.2009; van der Zaan et al.2010; Meszaros et al.2013), although in contrast to our work, these earlier studies tended to find that vcrA was more commonly encountered than bvcA.
There were significant positive correlations between the abundances of all of the RDase genes with each other. While this finding appears logical, given the similar physiologies of the bacteria containing the RDases, earlier studies have not observed this correlation (van der Zaan et al.2010). The abundances of the RDases positively correlated with the abundances of DHC, DHB and DHG though this correlation was only statistically significant for the vcrA-DHC pair. While these positive correlations might be expected, past studies have only shown a clear correlation between vcrA and DHC (van der Zaan et al.2010). The negative correlation of DSB to all of the dehalogenase genes, with the exception of bvcA, might be explained by the fact that unlike DHC, DHB and DHG, Desulfitobacterium spp. are facultative organochloride respirers or that they contain RDases not targeted by the primers applied (Richardson 2013).
Reductive dehalogenation in enrichment cultures
Anaerobic enrichment cultures set up with aquifer sediment and DCA as a potential electron acceptor showed biodegradation of DCA, yielding ethene as an end product (Fig. 3). Dechlorination of PCE and 1,1,2-TCA was also detected, suggesting these CHCs could also act as electron acceptors (Figs 4 and 5). Dechlorinating activity in these microcosms was observed after more than five 1% transfers (data not shown), suggesting a growth-linked process rather than cometabolism. Pyrosequencing of 16S rRNA gene amplicons from these enrichment cultures confirmed the presence of the same reductive dehalogenating genera detected by qPCR. Specifically, DCA-degrading enrichments contained Desulfitobacterium spp. (De Wildeman et al. 2003; Mazorati et al. 2007), PCE-degrading enrichments contained high levels of Dehalococcoides and Dehalogenimonas, and 1,1,2-TCA-degrading enrichments contained substantial populations of Dehalococcoides, Dehalogenimonas and Dehalobacter (Table S7, Supporting Information). Anaerobic enrichments on DCA were unexpectedly dominated by Azospira—this genus is known as a perchlorate reducer, but its possible role in organohalide respiration is unknown. The results of the anaerobic microcosm and enrichment experiments confirmed that the organochlorine-respiring genera detected by qPCR were present and active in this aquifer.
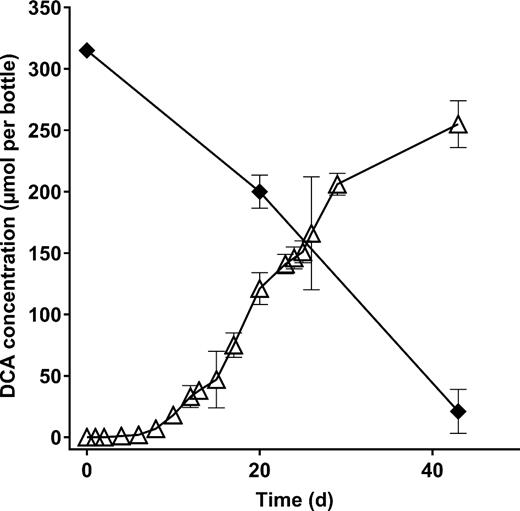
Biodegradation of DCA to ethene in anaerobic aquifer sediment enrichments. Data points indicate the mean of three replicate cultures, and error bars show the standard deviation. Symbols: filled diamonds, DCA; open triangles, ethene. No significant losses of DCA or production of ethene were seen in abiotic controls (not shown).
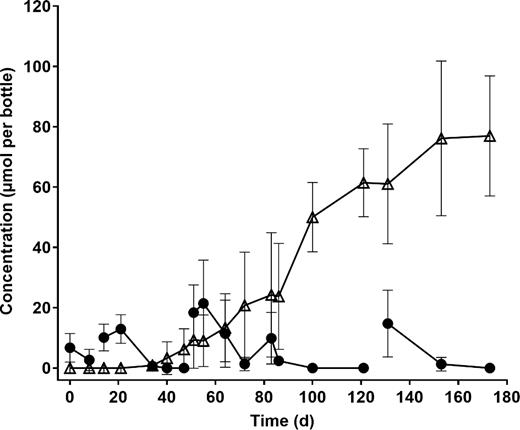
Biodegradation of PCE to ethene in anaerobic enrichments. Data points indicate the mean of three replicate cultures, and error bars show the standard deviation. filled circles, PCE; open triangles, ethene. TCE, cDCE and VC were all detected transiently (max. 2, 16, and 12 μmol per bottle, respectively), but these are not shown for the sake of clarity. No significant losses of PCE or production of ethene were seen in abiotic controls (not shown). Breaks in lines that link data points indicate a transfer of the culture to fresh media.
Biodegradation of TCA to ethene in anaerobic enrichments. Data points indicate the mean of three replicate cultures, and error bars show the standard deviation. Filled squares, TCA; open triangles, ethene. VC was detected transiently (max. 7 μmol per bottle), but is not shown for the sake of clarity. No significant losses of TCA or production of ethene was seen in abiotic controls (not shown). Breaks in lines that link data points indicate a transfer of the culture to fresh media.
Spatial distribution of DCA degraders at the Botany site
The spatial distributions of contaminants, 16S rRNA genes and metabolic genes were plotted to investigate any patterns present (Fig. 6). Within the samples from the shallower sections of the aquifer, the highest levels of DCA contamination are seen in BP72 and BP76 (6 m bgs); these wells also contained high abundances of DHG (BP76) and DSB (BP72). Overall bacterial abundance was highest (>106 genes per mL) in wells BP56, BP72, BP114 and BP115. DHC and DHB were most abundant in BP56, along with the RDases tceA and vcrA, while bvcA was found to be concentrated at BP115.
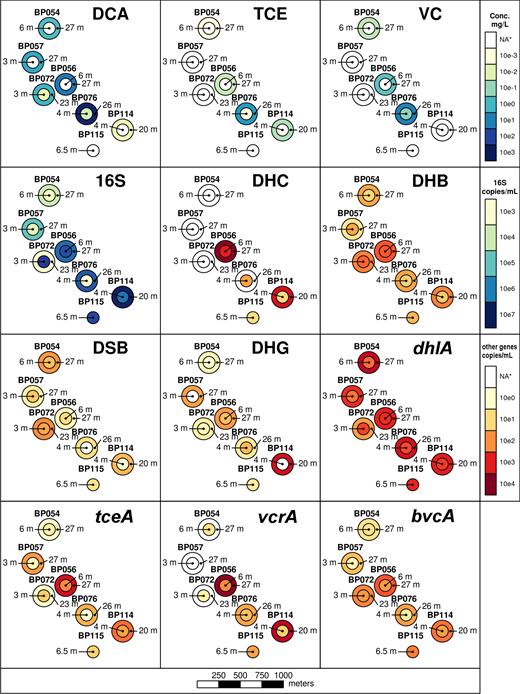
Spatial distribution of pollutants and genes in aquifer samples. NA*: not applicable; indicates concentrations below the cutoff chosen for heat mapping or below the detection limit. See Table 1 and Tables S5–S6 for more information.
The deep aquifer samples also showed a good spatial correlation between the DCA concentration and the abundance of dhlA-containing bacteria. The dhlA gene abundance was high (>103 genes per mL) in the well which had the highest DCA concentrations (BP76 (26 m bgs, 584 mg/L)). In contrast, only low levels of reductively dehalogenating genera and RDases were co-located with the DCA hotspot in the deep aquifer samples. As expected, good correlations were generally seen between the locations of DHC/DHB and RDases in both shallow and deep sample sets, in line with the conventional wisdom that both DHC and DHB are dedicated dehalogenating genera (Richardson 2013; Nelson, Jiang and Zinder 2014).
A statistically significant positive correlation was seen between Dehalogenimonas and the concentration of total chlorinated ethenes in samples (Fig. 1), while positive correlations that did not meet criteria for statistical significance were seen between Dehalogenimonas and total volatile CHCs, between Dehalogenimonas and total chlorinated ethanes, and between Dehalobacter and total chlorinated methanes; these patterns match expectations from the literature (Moe et al.2009; Grostern et al.2010; Manchester et al.2012). The different spatial distributions of the anaerobic dehalogenating genera were not explained by a preference for respiration of chlorinated ethenes or methanes rather than DCA, and it seems more likely that different spatial distributions related to the different tolerances of the aerobes and anaerobes to the different organochlorines present (Janssen, Scheper and Dijkhuizen 1985; Maymo-Gatell, Nijenhuis and Zinder 2001; De Wildeman et al.2003; Koenig, Groissmeier and Manefield 2014).
The spatial distribution of total 16S rRNA genes in the deep aquifer correlated with DHG, but not with any of the other bacterial genera or dehalogenases, and 16S rRNA gene numbers were highest in BP114. This suggests that the distribution of DCA-degrading bacteria was largely influenced by location-specific variables particular to their physiologies, rather than by the presence of conditions favouring the growth of all bacterial types. It is worth noting that there is not necessarily a simple positive correlation between the abundance of a particular microbe and its preferred substrate in the environment; this depends on how far consumption of the substrate has progressed, and whether supply is being replenished. In this fast-flowing aquifer, with DCA constantly replenished from upgradient DNAPL, we would expect to see a positive correlation between DCA concentration and the abundance of DCA degraders.
A limitation of this study is that the data presented here are taken from a single time point, and thus care is needed when extrapolating to the likely implications for bioremediation. However, we believe this data to be robust, since a preliminary study by our laboratories using samples collected 6 months earlier (March 2012) found very similar trends to those reported here (data not shown), i.e. co-occurrence of genes from hydrolytic and reductive organochlorine degraders, and co-localisation of the dhlA gene with hotspots of DCA in the deeper aquifer. In that preliminary study, we only had access to a few sample locations, and the analytical chemistry data was incomplete, so a decision was made to publish only the more coherent data set from the September 2012 samples.
Implications of this work for bioremediation of DCA-contaminated sites
This is the first study to investigate the distribution of both aerobic and anaerobic DCA-degrading bacteria in situ at a contaminated site, and to seek correlations between both these dehalogenating types and the physicochemical conditions at the site. In some cases, the results matched expectations; for example, in the deep aquifer, the three RDase genes tceA, bvcA and vcrA were found in the same water samples as 16S rDNA sequences from the obligate organochlorine respiring genera DHC and DHB. In other cases, however, unexpected results were seen; for example, dhlA-containing dehalogenating bacteria (traditionally considered to be aerobes) were most abundant in the deep aquifer rather than the shallow aquifer, and were thriving at locations with low oxygen conditions. The latter finding provides further evidence that ‘aerobic’ bacteria can be substantial contributors to biodegradation processes in environments with very low O2 levels; this was highlighted recently in a study on aerobic VC-degrading bacteria, which exhibited sustained VC oxidation at O2 levels which would typically be considered ‘anoxic’ (0.1 mg/L)(Gossett 2010). An outstanding knowledge gap concerns the distribution and phylogeny of bacteria containing the p450-mediated oxidative DCA degradation pathway—this is an important area for future work.
A representative dhlA-containing bacterium isolated from the site was shown capable of anaerobic growth on DCA in the presence of nitrate, and thus, such bacteria should be considered as ‘hydrolytic DCA degraders’ rather than ‘aerobic DCA degraders’. Nitrate is not routinely monitored at this site, but this anion has been detected in at least some wells at levels ranging from 0.2 to 8.4 mg/L. The fact that both hydrolytic and reductive dehalogenating genera were widespread in groundwater at this site and present at high concentrations in many samples indicates that bioremediation by either natural attenuation or biostimulation is a potentially valid approach for site clean-up in this case. Appropriate site-specific strategies for biostimulation might be to add alkali and/or buffer to neutralise the acidic groundwater, and to add nitrate to supply a nitrogen source, and to act as an electron acceptor for the dhlA-containing bacteria.
SUPPLEMENTARY DATA
Supplementary data are available at FEMSEC online.
Acknowledgements
We thank Golder Associates for assistance in collecting site samples.
FUNDING
This work was supported by Orica Ltd and the NSW Environmental Trust.
Conflicts of interest. None declared.
