


Abstract
Primary succession after glacier retreat has been widely studied in plant communities, but bacterial succession is still poorly understood. In particular, few studies of microbial succession have been performed in the Arctic. We investigated the shifts in bacterial community structure and soil physicochemical properties along a successional gradient in a 100-year glacier foreland of the High Arctic. Multivariate analyses revealed that time after glacier retreat played a key role in associated bacterial community structure during succession. However, environmental filtering (i.e. pH and soil temperature) also accounted for a different, but substantial, proportion of the bacterial community structure. Using the functional trait-based approach, we found that average rRNA operon (rrn) copy number of bacterial communities is high in earlier successional stages and decreased over time. This suggests that soil bacterial taxa with higher rrn copy number have a selective advantage in early successional stages due to their ability of rapidly responding to nutrient inputs in newly exposed soils after glacier retreat. Taken together, our results demonstrate that both deglaciation time and environmental filters play key roles in structuring bacterial communities and soil bacterial groups with different ecological strategies occur in different stages of succession in this glacier foreland.
INTRODUCTION
Warming is widespread across the globe, with the greatest rate of temperature increase occurring in the Arctic (IPCC 2013). Glacier retreat and reduction of snow cover are typical indicators of Arctic climate warming. Ten percent of the Earth's surface area is covered by glaciers and many glaciers are rapidly disappearing in the Arctic (Roer, Zemp and van Woerden 2008). Svalbard is one of the places where rapid changes in landscape forms have occurred due to deglaciation. Svalbard is a High Arctic archipelago located 650 km north of Norway that has ∼60% of its surface area covered by glaciers (Hagen et al.1993). Glaciers are melting quickly in Svalbard; 7% of them have disappeared over the last 30 years (Nuth et al.2013).
Retreating glaciers leave behind a variety of landscape features such as lakes, moraines and valleys. Newly exposed glacier forelands provide refuges for many terrestrial taxa that initiate primary succession in terrestrial ecosystems (Matthews 1992). The concept of ecological succession has a long history and remains a core tenet in ecology. Most studies of succession in glacier forelands have focused on plant succession (Reiners, Worley and Lawrence 1971; Matthews 1992; Hodkinson, Coulson and Webb 2003), and belowground microbial community succession has received relatively less attention (Bradley, Singarayer and Anesio 2014). Furthermore, the majority of microbial succession studies have been conducted in Alpine and subpolar regions (Zumsteg et al.2012; Jangid et al.2013; Bradley, Singarayer and Anesio 2014), and only a few studies have occurred in the High Arctic (Schütte et al.2009, 2010).
Functional traits are good indicators for clarifying the mechanisms by which microbes respond to environmental change. A putative functional trait, rrn copy number, has been suggested to play an important role in microbial community assembly (Klappenbach, Dunbar and Schmidt 2000). rrn copy number is a core trait in bacterial life history strategies, and it is related to many physiological processes such as growth rate, sporulation and stress response (Klappenbach, Dunbar and Schmidt 2000; Yano et al.2013). In general, microbes with a higher rrn copy number respond more rapidly to resource inputs (Stevenson and Schmidt 2004; Fierer et al.2007; Shrestha, Noll and Liesack 2007). Nemergut et al. (2015) hypothesized that average rrn copy number would be higher in early successional stages and decrease during ecosystem succession. Indeed, they found that a decrease in average rrn copy number was a consistent pattern of bacterial communities during succession.
Here, we examined the changes in bacterial community structure during succession using 16S rRNA gene pyrosequencing in the foreland of the Austre Lovénbreen glacier of Svalbard. First, we hypothesized the average rrn copy number of soil bacteria would decrease over successional time upon glacier retreat. Second, we tested a hypothesis that time since glacier retreat would be the major indicator for determining bacterial community structure. If so, it would be likely that shifts in bacterial community structure closely parallel changes in soil properties during deglaciation-mediated soil development. However, environmental changes do not always take place in a linear fashion following a line transect, as environmental perturbation often confounds the effects of time (Freedman and Zak 2015). Therefore, we also determined the extent to which soil properties explain the variation of soil bacterial community during succession.
MATERIALS AND METHODS
Study site and soil sampling
This study was conducted in the foreland of the Austre Lovénbreen glacier (78.9°N, 12.1°E), 6 km east of NyÅlesund, Svalbard. The Austre Lovénbreen is a northward-flowing valley glacier (4.6 km2), and is polythermal, as determined on the basis of radio echo sounding (Hagen and Sætrang 1991). The glacier ice surface in this area has been reduced by 25% over the past 40 years (Griselin et al.2009). Surface soil samples (0–5 cm depth) were collected along the chronosequence from the glacier front to the outer Little Ice Age (LIA) glacial maximum (Fig. 1). The chronosequence comprises nine sites (AL1–AL9) with five time intervals (0–3, 22–35, 35–41, 46–64, and 64–92 years since glacier retreat), and the last four sites (AL10–AL13) are located outside the glacier moraine (before LIA) (Table 1). Time since glacier retreat was estimated using photographs and satellite images. Earlier glacier retreat times were mapped based on aerial photographs (Norsk polarinstitutt) taken on 1936, 1948, 1966, 1977, 1990 and 1995. Recent glacier retreat times were mapped using satellite images obtained from FORMOSAT images of 2007-2008-2009 and a PLEIADE image of August 2013. The external limit of the LIA was delineated from aerial photographs. Areas not disturbed by biological input (e.g. feces of birds and mammals) were chosen for soil sampling. At each site, three soil samples were taken 1 m apart after removing leaf litter and large gravel. Samples were stored at –20°C after placement in an RNAlater solution (Life technology, Carlsbad, CA, USA) at DASAN research station in Ny-Ålesund, and transported to the KOPRI laboratory in iceboxes.
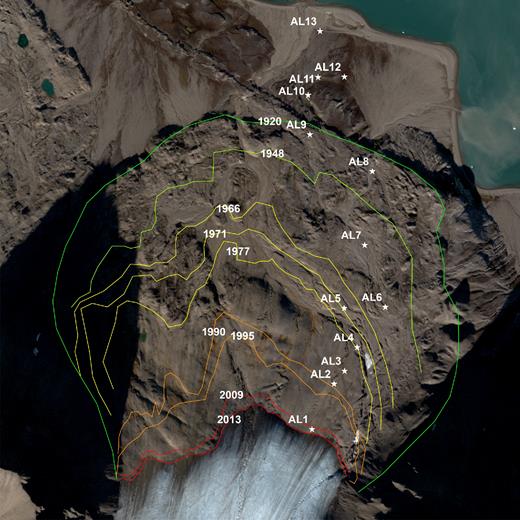
Sampling sites in the foreland of the Austre Lovénbreen glacier, Svalbard.
Sampling sites and soil physicochemical properties.
| Site | Glacier retreat period | Latitude | Longitude | Elevation (m) | Soil temperature (°C) | Ratio of fine earth <2 mm (%) | Gravimetric moisture content (%) | pH | EC (μS cm−1) | TC (mg g−1) | SOC (mg g−1) | TN (mg g−1) | C/N ratio |
|---|---|---|---|---|---|---|---|---|---|---|---|---|---|
| AL1 | 2009–2012 | 78.88614 | 12.1640 | 116.7 | 0.57 | 50.2 (1.7) | 20.6 (1.6) | 7.92 (0.06) | 287.7 (5.1) | 8.3 (0.3) | 2.8 (0.5) | 0.01 (0.00) | 40.3 (10.0) |
| AL2 | 1977–1990 | 78.88809 | 12.16836 | 96.5 | 5.87 | 52.2 (20.2) | 18.6 (1.7) | 7.94 (0.09) | 217.8 (72.0) | 7.2 (2.0) | 3.2 (0.8) | 0.01 (0.00) | 45.0 (7.0) |
| AL3 | 78.88866 | 12.1705 | 90.2 | 5.89 | 49.8 (14.0) | 16.3 (1.9) | 7.89 (0.02) | 243.7 (40.3) | 6.2 (0.9) | 2.8 (0.3) | 0.01 (0.00) | 29.0 (1.5) | |
| AL4 | 78.88968 | 12.17299 | 77.3 | 6.14 | 41.4 (9.3) | 6.0 (0.3) | 7.91 (0.06) | 185.9 (71.6) | 6.1 (1.3) | 1.7 (0.5) | 0.01 (0.01) | 25.6 (4.9) | |
| AL5 | 1971–1977 | 78.8913 | 12.16973 | 72.0 | 6.91 | 64.3 (1.6) | 12.1 (1.3) | 7.59 (0.07) | 324.7 (57.7) | 7.7 (1.0) | 3.5 (0.6) | 0.01 (0.00) | 31.3 (5.4) |
| AL6 | 1948–1966 | 78.89143 | 12.17874 | 83.5 | 7.15 | 55.0 (3.2) | 13.0 (1.7) | 7.45 (0.05) | 314.7 (12.7) | 9.6 (1.8) | 6.2 (1.4) | 0.02 (0.01) | 31.5 (3.6) |
| AL7 | 78.8940 | 12.17358 | 53.0 | 5.81 | 50.7 (18.2) | 19.4 (2.1) | 7.45 (0.05) | 287.3 (19.5) | 9.1 (0.6) | 4.9 (0.9) | 0.01 (0.00) | 40.8 (7.2) | |
| AL8 | 1920–1948 | 78.89712 | 12.17445 | 35.5 | 6.98 | 56.0 (35.2) | 13.3 (1.3) | 7.43 (0.09) | 258.7 (33.5) | 9.3 (0.8) | 5.1 (1.4) | 0.02 (0.02) | 38.6 (10.4) |
| AL9 | 78.89854 | 12.16041 | 36.2 | 7.75 | 93.4 (7.5) | 8.3 (8.0) | 7.48 (0.12) | 193.0 (93.8) | 8.4 (0.3) | 4.2 (0.2) | 0.01 (0.01) | 34.5 (10.1) | |
| AL10 | Before Little Ice Age | 78.9002 | 12.15962 | 20.8 | 7.38 | 70.9 (10.5) | 16.7 (1.3) | 6.75 (0.22) | 234.8 (94.0) | 62.3 (23.9) | 62.0 (24.1) | 0.46 (0.15) | 13.2 (1.1) |
| AL11 | 78.90097 | 12.1616 | 13.3 | 7.43 | 94.9 (7.1) | 28.2 (15.2) | 7.20 (0.11) | 267.0 (76.0) | 26.9 (7.6) | 23.6 (8.2) | 0.24 (0.28) | 21.3 (3.7) | |
| AL12 | 78.90104 | 12.16734 | 5.9 | 7.00 | 68.4 (29.9) | 7.2 (1.8) | 7.54 (0.08) | 187.9 (63.3) | 21.6 (11.3) | 18.1 (11.9) | 0.11 (0.09) | 17.3 (3.0) | |
| AL13 | 78.90291 | 12.16155 | 14.8 | 7.39 | 73.2 (26.7) | 10.2 (7.8) | 7.02 (0.06) | 224.3 (50.1) | 23.4 (16.2) | 22.3 (16.6) | 0.22 (0.04) | 13.2 (1.6) |
Triplicate measurements are represented as mean (standard deviation).
EC, electrical conductivity; TC, total carbon; SOC, soil organic carbon; TN, total nitrogen.
Soil physicochemical analysis
Soil moisture content was determined by drying soil samples at 105°C. Separate fresh soil samples were dried at 45°C. The dried samples were passed through a 2-mm sieve, and the weight of gravel (>2 mm) and soil (<2 mm) were measured. The ratio of fine earth materials to gravel was determined by dividing the weight of soil (<2 mm) by the total weight of the sample. Soil pH was measured in a 1:2 (w/v) ratio of soil:deionized water (Thomas 1996). Soil surface temperature was measured with TR1 sensor (10 cm length) of KD2 Pro (Decagon Devices, Pullman, WA, USA). Soil electrical conductivity (EC) was measured in a filtrate after mixing soil to deionized water in a 1:5 (w/v) ratio. For carbon and nitrogen analyses, soil samples were ground with a ball mill. Total carbon (TC) and total nitrogen (TN) were analyzed by a combustion method (950°C) through an elemental analyzer (FlashEA 1112, Thermo Fisher Scientific). The content of total inorganic carbon (TIC) was acquired by analyzing the released CO2 in a CO2 coulometer CM5104 (UIC Inc., Joliet, IL, USA) after adding 42.5% phosphoric acid (H3PO4) to the powder soil samples at 80°C. The amount of soil organic carbon (SOC) was calculated by subtracting the amount of TIC from that of TC.
Pyrosequencing and bioinformatics analysis
Soil DNA was extracted from 0.5 g of each soil sample using FastDNA® SPIN Kit (MP Biomedicals, Santa Ana, CA, USA) following the manufacturer's introductions. The hypervariable V1–V3 region of the bacterial 16S rRNA gene was amplified from genomic DNA using barcoded fusion primers, 27f (5΄-AC-AGAGTTTGATCMTGGCTCAG-3΄) and 519r (5΄-X-AC-GWATTACCGCGGCKGCTG-3΄), where ‘X’ denotes 8-bp error-corrected barcodes (Hamady et al.2008). The PCR was performed using a thermocycler (Whatman Biometra 96-well PCR system; Biometra, Göttingen, Germany) under the following conditions: 30 s at 94°C, 30 s at 55°C and 1 min at 72°C for 25 cycles, followed by a final extension at 72°C for 10 min and subsequent cooling to 4°C. 454 adapter sequences were incorporated into the PCR product, and pyrosequencing was performed by ChunLab (Seoul, South Korea) using a GS FLX Titanium System (454 Life Sciences, Roche Applied Science, Penzberg, Germany). Raw sequence reads were processed following the 454 SOP in mothur (Schloss et al.2009). Flowgrams were denoised using the mothur-implemented PyroNoise, and denoised sequences were aligned against the SILVA pre-aligned reference data set. Putative chimera sequences were detected and removed using the de novo UCHIME algorithm and chimera-free sequences were taxonomically assigned against the EzTaxon-e database (Kim et al.2012) using the Naïve Bayesian Classifier with a confidence threshold of 80%. Quality-filtered sequences were clustered into operational taxonomic units (OTUs) with a 97% similarity cutoff, and singleton OTUs were omitted. The maximum likelihood (ML) tree was reconstructed using FastTree 2.0 with default options (Price, Dehal and Arkin 2010). rRNA operon (rrn) copy number was estimated using PICRUSt v.1.0. (phylogenetic investigation of communities by reconstruction of unobserved states), a bioinformatics software designed to predict functional composition of metagenomes from 16S rRNA gene data and a reference genome database (Langille et al.2013). Quality-filtered sequences were taxonomically assigned against the Greengenes database (v.13.5), and the resultant BIOM file was analyzed using the web-based Galaxy version of PICRUSt. Copy number information for the 16S rRNA gene was used for calculating ‘the weighted mean rrn copy number’ (Nemergut et al.2015). The weighted mean rrn copy numbers were obtained by multiplying copy numbers by relative abundance of each OTU, and summing these values within a sample. The average rrn copy number was recently suggested as a community-level trait in the life history strategies of microbes (Green, Bohannan and Whitaker 2008; Nemergut et al.2015). Raw sequence data were submitted to the NCBI Sequence Read Archive (SRA) database with an accession number of SRP070166.
Statistical analyses
High-quality reads were randomly subsampled to 553 reads per sample to reduce bias due to variations in sample size. All diversity indices, including the Shannon index and Faith's phylogenetic diversity (PD), were calculated using mothur. The relationship among bacterial diversity, average rrn copy number and successional time was modeled using linear regression. Regression diagnostics, model selection and data transformation were performed using ‘car’ package in R. Bray-Curtis dissimilarities were calculated using a Hellinger-transformed OTU matrix, and a Euclidean distance matrix was used for environmental variables. Possible correlations among two distance matrices (bacterial community structure and physicochemical composition of soil) were tested using Mantel tests in R. An analysis of similarity (ANOSIM), implemented in PRIMER 6+, was used to determine if bacterial community structure differed significantly by successional time and non-metric multidimensional scaling (NMDS) was used for ordination visualization. The gradient of successional time and vectors of environmental variables were fitted onto the ordination space using functions ‘ordisurf’ and ‘envfit’ in the vegan R package, and the significance of each correlation was tested based on 999 permutations (Oksanen et al.2013). In order to determine the extent to which environmental variables explain bacterial community structure, distance-based linear models (DistLM) were used by partitioning the community variation (Legendre and Anderson 1999). Multicollinearity between variables was tested using the ‘Draftsman Plot’ function in PRIMER 6+ (Clarke and PRIMER 2006) and normalizing transformations of the variables were done prior to performing DistLM analysis: SOC was log-transformed, moisture content (%) was square-root transformed, soil temperature (°C) was power transformed (x2) and other variables were left untransformed. A marginal DistLM test was used to determine the amount of variance in community structure explained by each individual variable. Basic statistical analyses and graph improvements were carried out using R version 3.0.2 (R Core Team 2013).
RESULTS
Bacterial community members in the foreland of a receding glacier
We obtained 36 247 high-quality bacterial sequences from 38 samples, and the number of sequences sampled ranged between 553 and 1449. All sequences were clustered into 9296 OTUs (3203 OTUs without singletons) at the 97% similarity cutoff, and ranged between 190 and 833 per sample (Table S1, Supporting Information). Sequences were taxonomically assigned to 34 bacterial phyla with 2.9% as candidate divisions and 1% as unclassified bacterial lineages. Bacterial communities in the glacier foreland were dominated by Proteobacteria (41.7% on average), and other phyla such as Acidobacteria (11.8%), Bacteroidetes (8.9%), Actinobacteria (8.0%), Chloroflexi (6.6%) and Planctomycetes (6.1%) were abundant across all samples to a lesser extent (Fig. 2). When the relative abundance of bacterial phyla was correlated with successional time, three bacterial phyla were significantly correlated to time since deglaciation (Fig. S1, Supporting Information). The relative abundance of Acidobacteria and Chloroflexi increased over successional time (Pearson's r = 0.87, P < 0.001 and r = 0.53, P < 0.001, respectively), whereas that of Bacteroidetes decreased along the chronosequence (Pearson's r = –0.64, P < 0.001). An opposite pattern of abundance change over successional time was found in two classes of Proteobacteria. The relative abundance of Alphaproteobacteria increased over time (Pearson's r = 0.52, P < 0.001), whereas that of Betaproteobacteria was negatively associated with time (Pearson's r = –0.48, P < 0.001).
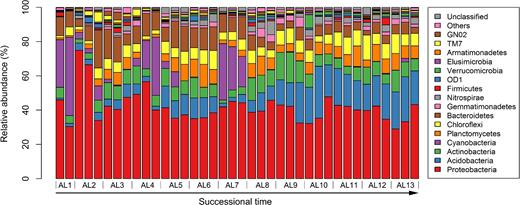
Bacterial phyla distribution along the chronosequence.
Changes of bacterial diversity and average rrn copy number along the chronosequence
Both phylotype diversity (Shannon index) and PD increased over successional time (linear regression: R2 = 0.56, P < 0.001 and R2 = 0.55, P < 0.001, respectively) (Fig. 3A and B). Both diversity indices increased dramatically at early stages (0–35 years), kept increasing moderately at intermediate stages (35–64 years), and these high levels of diversity were maintained to the late stages (64–142 years). In contrast, the weighted mean rrn copy number decreased along the chronosequence (linear regression: R2 = 0.40, P < 0.001) (Fig. 4). We assumed that a high rrn copy number in the early stages was ascribed to the dominance of Betaproteobacteria and Bacteroidetes in young soils. Therefore, we further examined whether the decreasing pattern of rrn copy number was maintained after the exclusion of those two groups. Regression analysis revealed that the subset data points did not show significant linear trends, but the decreasing trend remained the same (linear regression: R2 = 0.18, P < 0.001).
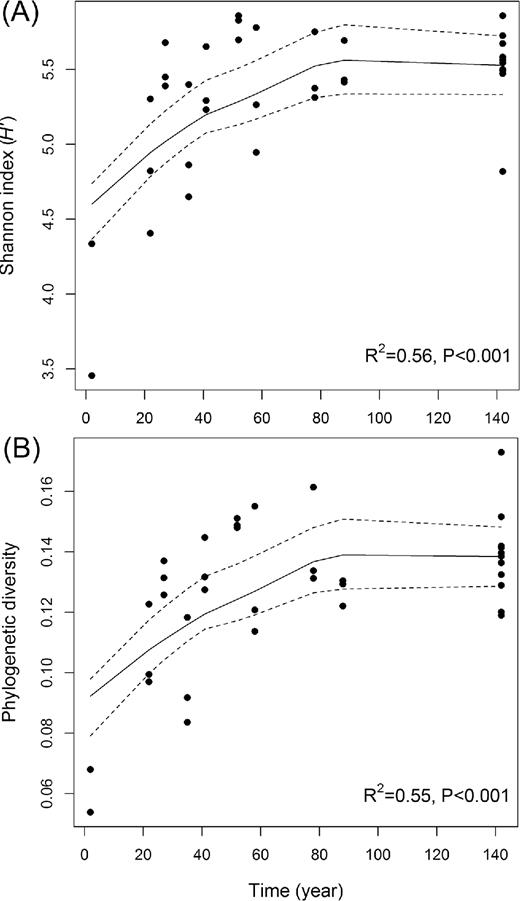
Changing patterns of (A) phylotype diversity (Shannon index) and (B) PD of soil bacterial communities along the chronosequence. Cubic regression was best fit to the data points for both Shannon index and PD. LOESS function in R was used for polynomial regression fitting (solid lines) with 95% confidence intervals (dashed lines).
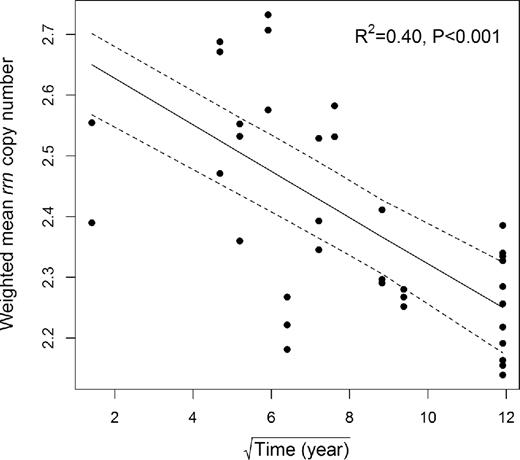
Changing pattern of weighted mean rrn copy number along the chronosequence. The variable ‘Time (years since glacier retreat)’ was square root-transformed to meet the assumption of linear regression. Linear regression was used to fit the data points, and 95% confidence interval was represented in dashed lines.
Shifts in bacterial community structure along the chronosequence
Bacterial communities were structured by time at six intervals (ANOSIM Global R = 0.75, P < 0.001). The youngest soils (0–3 years) were the most distinct across all samples (ANOSIM pairwise test: 0.89 < R < 1 and all P < 0.01), and the oldest soils (before LIA) were the next most distinct (0.80 < R < 0.99 and all P < 0.01) (Table S2, Supporting Information). We performed a multivariate analysis to examine how bacterial community composition and soil physicochemical properties changed along the chronosequence. There was a significant but moderate correlation between two matrices (Mantel test: r = 0.50, P < 0.001). Closer inspection revealed that a set of environmental variables determining soil properties and bacterial community composition were different from each other. Trend surface analysis revealed that soil physicochemical properties was significantly structured along the successional time gradient (R2 = 0.92, P < 0.001) (Fig. 5A). Successional time was still one of the major factors determining the bacterial community composition (R2 = 0.76, P < 0.001), but compositional variations were also shaped by other environmental variables (Fig. 5B). When the vectors of environmental variables were fitted onto the ordination space, bacterial community variation was explained by soil temperature (R2 = 0.71), soil pH (R2 = 0.64) and TIC (R2 = 0.55). Additionally, we performed a DistLM test to see the extent to which environmental variables account for significant proportions of the variation in bacterial communities (Table 2). Successional time was the single best predictor variable that explained bacterial community variation (11.0%). Among the environmental variables, SOC (10.2%), soil temperature (9.7%) and pH (9.4%) also accounted for significant proportions of community variation (all P < 0.001).
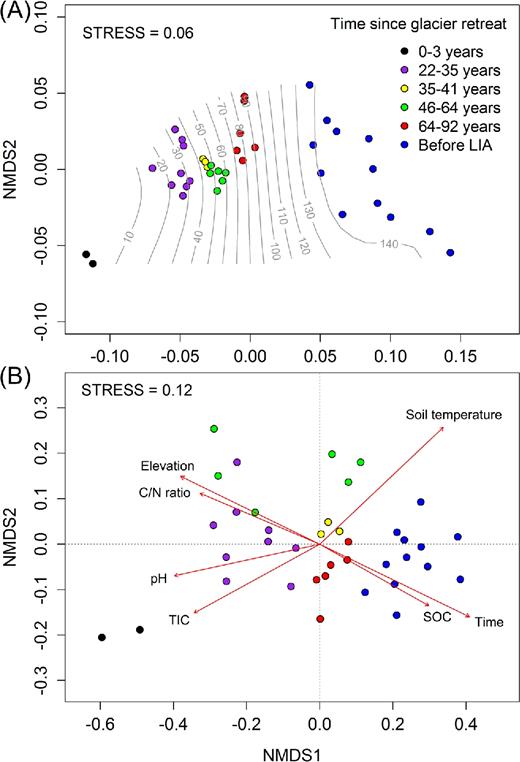
Clustering of soil samples based on (A) soil physicochemical properties and (B) bacterial community composition. The trend surface of the variable, time (years), was fitted onto the ordination space using the ‘ordisurf’ function of the vegan R package in (A). Highly correlated and significant vectors of environmental variables (R2 > 0.40, P < 0.001) were overlaid onto the ordination space using the ‘envfit’ function in (B). The arrow indicates the direction of most rapid change in the variable, and its length is proportional to the correlation between ordination and the variable.
Proportion of community variation explained by each predictor variable based on the marginal DistLM test.
| Category | Variable | Pseudo-F | P-value | Proportion explained (%) |
|---|---|---|---|---|
| Edaphic | Soil organic carbon (SOC)a | 4.08 | 0.001 | 10.2 |
| Soil temperature | 3.89 | 0.001 | 9.7 | |
| pH | 3.72 | 0.001 | 9.4 | |
| Total inorganic carbon (TIC) | 2.93 | 0.001 | 7.5 | |
| C/N ratio | 2.77 | 0.001 | 7.1 | |
| Fine-earth fraction (<2 mm) | 2.21 | 0.001 | 5.8 | |
| Moisture content (MC) | 1.17 | 0.150 | 3.1 | |
| Conductivity (EC) | 1.04 | 0.339 | 2.8 | |
| Temporal | Time since glacier retreata | 4.43 | 0.001 | 11.0 |
There is collinearity between time and elevation, and between SOC, TC and TN (all |r| > 0). SOC and time since glacier retreat are shown as representatives of collinear variables.
DISCUSSION
Factors determining bacterial community structure in glacier foreland
The most distinct shift in bacterial community structure was found in young soils, indicating that a high degree of community turnover occurs during early successional stages. A high community turnover rate was also observed in early stages of other deglaciated forelands (Schütte et al.2010; Jangid et al.2013). Regarding compositions of soil physicochemical properties showing a similar pattern to that of bacterial communities, high community turnover in young soils may be ascribed to considerable changes in soil environments during early stages. Time since glacier retreat was the single best predictor determining variations of soil properties and bacterial community compositions in this deglaciated foreland. However, we found that significant proportion of bacterial community variation was explained by environmental filtering (e.g. pH, soil temperature, etc.) as well as successional time. Among the environmental variables measured in this study, excluding the variables that have strong positive or negative associations with time, soil temperature was the key determinant for explaining bacterial community variation. This temperature effect is in agreement with the results of Freedman and Zak (2015) and Mateos-Rivera et al. (2016). Soil temperature was the second best predictor of bacterial community variation in the Wisconsin glacier foreland (Freedman and Zak 2015). Mateos-Rivera et al. (2016) found a shift in microbial community composition in response to different incubation temperatures. For example, the relative abundance of Betaproteobacteria in young soils was significantly reduced at high temperatures (22°C), while it remained dominant at lower temperatures (5°C and 10°C). Colonization and assembly of soil bacterial communities in deglaciated forelands may be mediated by temperature-dependent processes, which may not be true for soil development.
Successional trajectories of dominant bacterial taxa upon glacier retreat
There was a strong correlation between relative abundance of bacterial phyla (or classes in proteobacteria) and successional time. The relative abundance of Acidobacteria, Chloroflexi and Alphaproteobacteria increased along the chronosequence, and the opposite pattern was observed for Bacteroidetes and Betaproteobacteria. The increase of acidobacterial abundance over time was likely related to soil pH; a decrease in pH generally occurs in glacier retreat sites due to an increase in plant root activity and the weathering process as succession proceeds (Matthews 1992). A negative correlation between acidobacterial relative abundance and soil pH has been reported in many studies (Jones et al.2009; Rousk et al.2010). The majority of Acidobacteria in this area were assigned to subgroups 4 and 6, both of which showed a negative correlation with pH in a range of pH 8.1–6.7. This is in contrast to the previously described trend, where relative abundance of both subgroups increased with increasing pH from alkaline to neutral (Jones et al.2009; Rousk et al.2010). This opposite pattern may be attributed to different responses by the endemic taxa that are confined to the glacier forelands in the Arctic, as previous results were obtained from non-polar regions (e.g. temperate zone and tropics).
Becteroidetes and Betaproteobacteria are the most abundant bacterial phyla and/or classes in early stages of deglaciation and their relative abundance decreased over successional time. Members of the soil Bacteroidetes and Betaproteobacteria are known copiotrophs; their abundance increases with an increasing C availability and mineralization rate (Fierer et al.2007). Similar abundance patterns were found in other glacier foreland during both short-term and long-term ecosystem successions. The relative abundance of Bacteroidetes and Betaproteobacteria was high at early successional stages and declined with age along the Franz Josef chronosequence (c. 120 000 years) in New Zealand (Jangid et al.2013). Betaproteobacteria was prevalent in recently exposed young soils and decreased along the glacial chronosequence in the glacier forelands of Peru, Switzerland and Norway (Nemergut et al.2007; Zumsteg et al.2012; Mateos-Rivera et al.2016). The highly versatile physiology of Betaproteobacteria could be a reason for their dominance in young soils. For example, the genus Polaromonas (Comamonadaceae) accounted for 12% of the betaproteobacterial sequences. Polaromonas species are known to oxidize a wide range of substrates in cold environments, and recent genomic studies have revealed their metabolic versatility and alternative dormancy mechanism, which may allow them to survive in extreme glacial environments and colonize recently deglaciated areas in higher abundance (Darcy et al.2011). Darcy et al. (2011) also showed members of this genus are globally distributed, suggesting that their higher dispersal capacity may also facilitate the colonization of young deglaciated soils.
Changes in bacterial diversity and rrn copy number over successional time
Taxonomic diversity increased rapidly in early stages of succession and more slowly during the later stages, which is one commonly observed pattern in plants during primary succession (Reiners, Worley and Lawrence 1971; Birks 1980; Matthews 1992). It is not clear why bacterial diversity shows a similar pattern to that of plants. A possible explanation is that bacterial diversity changes along altered environmental gradients as succession proceeds. For example, a decrease in soil pH towards later successional stages is a common feature of glacier forelands. Soil bacterial diversity generally peaks at around neutral pH and decrease towards acidic and alkaline extremes (Lauber et al.2009; Chu et al.2010). This pH-dependent diversity trend was also found in other glacier forelands. Bacterial diversity increased during succession in alkaline to neutral forelands of the Midtre Lovénbreen glacier (Schütte et al.2010), while both richness and diversity decreased in moderately to strongly acidic forelands of the Franz Josef glacier (Jangid et al.2013).
The decrease in average rrn copy number is a consistent feature of bacterial communities during ecological succession (Green, Bohannan and Whitaker 2008; Nemergut et al.2015), which suggests that bacteria with a higher rrn copy number respond more rapidly to resource availability. We argue that bacteria rapidly responding to nutrient availability may have the potential to adapt well to fluctuating environmental conditions or perturbations by shifts in their cellular metabolism and physiology. However, this generalization should be tested further in various other ecosystems.
Caveats
Average rrn copy number inferred by PICRUSt should be considered carefully as high scores of NSTI (the nearest sequenced taxon index) (mean NSTI = 0.18 ± 0.03 SD) were obtained from soil samples in this study (Table S3, Supporting Information). NSTI is an index of metagenome prediction accuracy of PICRUSt by quantifying availability of nearby genome representatives for each sample (Langille et al.2013). In general, NSTI scores are high (>0.15) in environments with fewer available reference genomes and PICRUSt accuracy increase with decreasing NSTI scores. For example, relatively higher NSTI scores (0.23 and 0.17, respectively) have been reported in highly diverse environments such as hypersaline mat and soil because fewer reference genomes of bacterial taxa were sequenced (Langille et al.2013). Nevertheless, given the high proportion of database matching (76.6%–92.1%) of 16S rRNA gene sequences obtained in this study, the decreasing trend of rrn copy number throughout the succession is convincible at least with bacterial taxa classified by the reference database.
CONCLUSIONS
In this study, we showed that overall trajectory of bacterial community succession parallels that of soil development following the time since glacier retreat. However, environmental filters, in particular pH and soil temperature, also played important roles in determining bacterial community structure over the course of succession. This highlights both temporal and environmental filtering act together in structuring bacterial communities in this deglaciated foreland. In addition, our functional trait-based analysis revealed that average rrn copy number of bacterial communities decreased over successional time, suggesting that soil bacterial taxa with higher rrn copy number have a selective advantage in early successional stages due to their ability of rapidly responding to nutrient inputs in newly exposed soils after glacier retreat.
SUPPLEMENTARY DATA
Supplementary data are available at FEMSEC online.
FUNDING
This study was supported by Korea Polar Research Institute (PE16030). This study was also supported by the National Research Foundation of Korea (NRF-2011-0021067; NRF-2016M1A5A1901770), (PN15082 and PN16082, KOPRI), and by the Korea Research Council of Fundamental Science & Technology (BSPG11040-252-7).
Conflict of interest. None declared.
REFERENCES
