


Marine protist diversity inventories have largely focused on planktonic environments, while benthic protists have received relatively little attention. We therefore hypothesize that current diversity surveys have only skimmed the surface of protist diversity in marine sediments, which may harbor greater diversity than planktonic environments. We tested this by analyzing sequences of the hypervariable V4 18S rRNA from benthic and planktonic protist communities sampled in European coastal regions. Despite a similar number of OTUs in both realms, richness estimations indicated that we recovered at least 70% of the diversity in planktonic protist communities, but only 33% in benthic communities. There was also little overlap of OTUs between planktonic and benthic communities, as well as between separate benthic communities. We argue that these patterns reflect the heterogeneity and diversity of benthic habitats. A comparison of all OTUs against the Protist Ribosomal Reference database showed that a higher proportion of benthic than planktonic protist diversity is missing from public databases; similar results were obtained by comparing all OTUs against environmental references from NCBI's Short Read Archive. We suggest that the benthic realm may therefore be the world's largest reservoir of marine protist diversity, with most taxa at present undescribed.
INTRODUCTION
Molecular studies of marine plankton have uncovered an enormous diversity of protists, many of which could not be assigned to any accession in taxonomic reference databases (e.g. de Vargas et al.2015). Planktonic studies have thus found a very large pool of unknown marine protist species. However, initial molecular studies unveiled highly diverse protist communities from marine benthic habitats which exhibit key ecosystem functions and whose diversity may even exceed that of planktonic protists. Most of these benthic studies were conducted in hydrothermal vent systems (Edgcomb et al.2002; López-García et al.2003; López-García, Vereshchaka and Moreira 2007) and anoxic sediments (Dawson and Pace 2002; Stoeck and Epstein 2003; Takishita et al.2005), both of which environments emerged as hotspots of protist biodiversity. More recently, similarly high diversity was reported from deep-sea and coastal sediments, with many genetic signatures only distantly related to taxonomically described protists (Scheckenbach et al.2010; Pawlowski et al.2011; Bik et al.2012; Gong et al.2015). At least for the three major protist lineages of ciliates, diatoms and Foraminifera, the existing species inventories of morphologically delineated species support a higher and distinctively different diversity of benthic compared to planktonic species (Patterson, Larsen and Corliss 1989; Mann and Evans 2007; Pawlowski, Holzmann and Tyszka 2013).
Marine benthic studies, though, remain scarce and limited compared to the considerably larger amount of planktonic studies. Based on the sparse and locally restricted amount of data, no consensus has been reached on the extent of microbial eukaryotic diversity in marine sediments (Epstein and López-García 2007; Fierer 2008; Bik et al.2012). Methodological difficulties are a partial explanation for this undersampling. The clean extraction of nucleic acids from environmental marine sediment samples is challenging (Hurt et al.2001) and extensive amounts of extracellular DNA may severely bias the environmental sequencing studies (Dell'Anno and Danovaro 2005). Furthermore, specific techniques and expensive equipment are required to access these physically remote environments (Orcutt et al.2011). Published benthic studies of protists are thus not only restricted in geographic scope, but also in their comparisons to the overlying planktonic protists. Despite our limited knowledge of benthic protists, there is strong agreement among microbial ecologists that marine coastal sediments play a pivotal role for the diversity and dynamics of overlying plankton communities by acting as seedbanks (Marcus and Boreo 1998). The benthic species reservoir consists of both truly active benthic species and resting stages of dormant planktonic species. Most of the latter occur in low abundances, but blooms can be initiated in response to environmental changes (Marcus and Boreo 1998). Furthermore, studies on microfossil protists have suggested that several planktonic lineages have evolved from benthic ancestors, which have colonized the pelagic realm on different occasions (Leckie 2009).
In this study, we used previously published data from Massana et al. (2015) that surveyed protist diversity in European coastal waters and sediments from Norway to Bulgaria using the V4 region of the 18S rRNA. Massana et al. (2015) provided a general taxonomic overview of planktonic and benthic protists, with particular attention on examining differences in size-fractionated planktonic protist communities and comparing results obtained from DNA and RNA templates. Building upon this initial study, here we focus on a more detailed comparison of benthic and planktonic protist diversity, with a special emphasis on the richness and phylogenetic novelty contained in marine benthic protist assemblages, two topics that were not covered by Massana et al. (2015). Our results not only support previous notions of more diverse benthic than planktonic protist communities, but also present clear indications of a higher degree of novelty in genetic signatures within benthic communities.
METHODS
Sampling, pyrosequencing and data processing
In the framework of the BioMarKs project (Logares et al.2014; Dunthorn et al.2014a; Massana et al.2015), water samples from the surface and deep chlorophyll maximum (DCM) layer, and sediment samples were collected from six different European coastal sites including the Skagerrak, the English Channel, the Atlantic Ocean, the Mediterranean Sea and the Black Sea (Table 1). For details on sampling protocols, nucleic acid extraction, 454-pyrosequencing of the hypervariable V4 18S rDNA region and data processing see Massana et al. (2015). Briefly, RNA from benthic samples was extracted from 2.5 g of surficial sediment using the Power Soil RNA kit (MoBio, Carlsbad, USA). RNA from planktonic samples was extracted with the NucleoSpin RNA kit (Macherey-Nagel, Düren, Germany) from filters of DCM and surface water samples collected with Niskin bottles. Both extraction kits are specifically optimized to gain high RNA yields from the respective samples and are routinely used in environmental high-throughput sequencing (HTS) studies. Because of the difficulties in RNA extractions from sediment samples (Hurt et al.2001), using an optimized kit for the recovery of nucleic acids from benthic samples was especially important. By targeting environmental (e)RNA rather than environmental (e)DNA, we minimized potential biases induced by accumulation and preservation of extracellular eDNA in sediments (Dell'Anno and Danovaro 2005; Stoeck et al.2007). The effect of extracellular eDNA is less critical when only water samples are analyzed (Logares et al.2014), but relevant for a comparison of water with sediment samples. Extracted RNA was then transcribed to cDNA for further processing.
Overview of BioMarKs samplings along the European coastline.
| Quality sequences per sampled habitat | |||||
|---|---|---|---|---|---|
| Sampling event | Latitude/Longitude | Oceanic region | Surface water | DCM | Sediment |
| Blanes | 41°40′N/2°48′E | Mediterranean Sea | 16 568 | n.d. | 3576 |
| Gijon | 43°40′N/5°35′W | Atlantic Ocean | 20 966 | n.d. | n.d. |
| Naples 2009 | 40°48′N/14°15′E | Mediterranean Sea | 62 250 | 52 114 | 15 739 |
| Naples 2010 | 40°48′N/14°15′E | Mediterranean Sea | 22 132 | 31 268 | 3159 |
| Oslo 2009 | 59°16′N/10°43′E | Skagerrak | 33 133 | 36 988 | 12 835 |
| Oslo 2010 | 59°16′N/10°43′E | Skagerrak | 19 316 | 24 819 | 3071 |
| Roscoff | 48°46′E/3°57′W | English Channel | 9298 | n.d. | 1720 |
| Varna | 43°10′N/28°50′E | Black Sea | 22 939 | 39 003 | n.d. |
DCM, deep-chlorophyll maximum; n.d., no data available
Total number of surface water quality sequences: 206 602.
Total number of DCM quality sequences: 184 192.
Total number of sediment quality sequences: 40 100.
Targeted amplification of the hypervariable V4 18S rDNA region was performed with the eukaryotic primer pair TAReuk454FWD1 and TAReukREV3 (Stoeck et al.2010). This primer pair, though, does not cover Foraminifera and several excavate lineages that are important contributors to benthic protist communities but whose taxonomy is not very well delineated by the V4 region (Pawlowski et al.2011; Lax and Simpson 2013). In contrast to other barcode genes, the V4 region does allow for better comparisons with published full-length 18S rRNA Sanger sequencing studies and has a better database coverage for taxonomic assignment (Stoeck et al.2010; Dunthorn et al.2012). Pyrosequencing of the amplified PCR product was conducted on a 454 GS FLX Titanium system (454 Life Sciences, USA). Resulting 454 reads were subject of a strict quality filtering, including two steps of chimera checking in UCHIME (Edgar et al.2011) and ChimeraSlayer (Haas et al.2011). All quality sequences were then clustered into OTUs using USEARCH (Edgar 2010) on a 97% sequence similarity value. In the second step of quality filtering, one representative of each OTU was subjected to a BLASTn analysis against NCBI's nucleotide database release 183.0. All OTUs assigned to Bacteria, Archaea, Metazoa, Embryophyta and OTUs with less than 80% similarity to database entries were removed from the dataset. The final dataset included 430 894 V4 18S RNA sequences, which clustered into 12 438 distinct OTUs. The complete BioMarKs sequencing dataset is available at the European Nucleotide Archive under the study accession number PRJEB9133.
Taxonomic assignment of OTUs
To search for the best hit of each OTU to a described organism, we conducted a local BLASTn analysis (using default settings) against the protist reference database PR2 (Guillou et al.2012). Additionally, we compared our environmental data against reference data of previous environmental HTS diversity surveys of protists using a similar BLASTn analysis. To build this environmental reference database, we manually screened NCBI's Short Read Archive (SRA) for studies that at least partially included protist data of the eukaryotic 18S gene (according to the experiment's descriptions in the SRA). After downloading the respective data, we removed all references shorter than 100 bp. The final customized SRA reference database consisted of 11 708 385 references from 167 datasets (Table S1, Supporting Information).
Statistical analyses and diversity measures
All statistical and diversity analyses were performed in R Studio (version 2.15.1, http://r-project.org). Following recommendations of previous studies (Dunthorn et al.2014b), we relied on incidence-based rather than abundance-based data to avoid biases induced by uneven gene copy numbers among different protist taxa. Species richness was estimated with the incidence-based coverage estimator (ICE) as implemented in the ‘fossil’ package (Vavrek 2011). ICE appropriately estimates asymptotic species richness from datasets containing many rare species (Colwell et al.2012), which we expect in benthic protist communities. Additional species richness estimations in CatchAll (Bunge et al.2012) are provided as supplemental material (Fig. S2, Supporting Information). Non-metric multidimensional scaling (NMDS) using (binary-) Jaccard distances as a measure of β-diversity was performed with the ‘vegan’ package (Oksanen et al.2015). Non-parametrical, two-sided Kolmogorov–Smirnov tests (KS-tests) using 1000 bootstrap replicates were used to assess the significance of sequence divergence distribution from planktonic and benthic datasets in the package ‘Matching’ (Sekhon 2011).
RESULTS
Comparison of planktonic and benthic protist diversity
The number of quality-filtered sequences among the three habitats differed: 206 602 from the surface, 184 192 from the DCM and 40 100 from the sediment (Table 1). Despite these differences, the sequences clustered into similar numbers of OTUs: 5747 in the surface, 5685 in the DCM and 5616 in the sediment. However, ICE-based richness estimates predicted a difference in the number of total OTUs between the plankton and the sediment: 7763 from the surface, 8140 from the DCM and 16 652 from the sediment (Fig. 1A). The proportion of OTUs thus not detected through our sequencing effort was 26% in surface, 30.2% in the DCM and 66.3% in the sediment. Richness estimations based on abundance data revealed similar trends but predicted even more undetected OTUs (Fig. S2, Supporting Information). The observed trends on OTU richness were further congruent with rarefaction results of sequencing data, which were closer to saturation for water column than for sediment samples (Fig. S3, Supporting Information). Differences in community composition between plankton and benthos were first shown by the number of shared and exclusive OTUs (Fig. 1B). Of 7729 non-singleton OTUs observed in total, only 708 (9.2%) were shared among all three habitats. This low number is, in part, explained by the low number of co-occurring OTUs in plankton and benthos: the plankton had 4368 non-singleton OTUs not found in the benthos, of which 701 were exclusively found in the surface and 762 were exclusively found in the DCM; the benthos had 2364 non-singleton OTUs not found in the plankton.

OTU richness and shared OTUs of planktonic and benthic protist communities. (A) For each habitat the bars show the number of observed (left, dark-colored part) and estimated OTUs (right, lighter colored part). Estimations are based on the ICE. (B) The Venn diagram highlights how many non-singleton OTUs were shared between all habitats, shared between any two of the sampled habitats or exclusively detected in a single habitat. Numbers indicate the amount of OTUs which fall into the respective category. The area of each category was proportionally approximated to the number of OTUs from the respective habitat.
NMDS analysis further demonstrated the partitioning of the observed diversity patterns in plankton and benthos (Fig. 2). Since differentiation in size fractions was only possible for planktonic samples and beyond the scope of this work, we pooled planktonic data of different size fractions from the same sampling events. In this analysis, surface and DCM samples clustered closely together, indicating a higher similarity in community composition among plankton samples than among benthos samples. Sediment samples were separated from the water communities in the analysis. In contrast to the narrow cluster of surface and DCM samples, the sediment samples were more widely distributed, indicating high dissimilarity in community composition between individual samples. This also applied to sediment samples from the same sampling site taken in consecutive years, as shown by the large distances between both samples from Naples and both samples from Oslo.
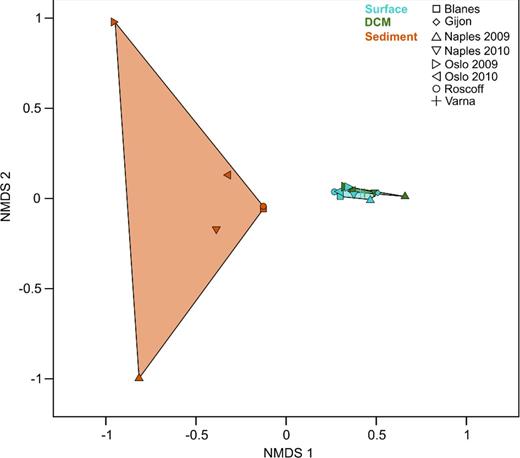
Beta diversity analysis of single sampling events. The NMDS is based on binary-Jaccard distances between protist communities of single samples (NMDS stress level = 0.2). Colors of the data points were chosen with respect to their habitat affiliation. Data points of the same affiliation were linked and the area between the linked points was colored with respect to their habitat affiliation.
Taxonomic affiliation of plankton and benthos OTUs
Most OTUs in each habitat were assigned to the groups of Alveolata, Stramenopiles and Rhizaria (Fig. 3). While the Alveolata dominated the planktonic communities (3281 OTUs in surface, 3638 OTUs in DCM samples), rhizarian OTUs of the phylum Cercozoa dominated the benthic communities (1566 of 1622 benthic rhizarian OTUs). Approximately the same proportion of OTUs was assigned to Stramenopiles in all three habitats. The number of OTUs from the Amoeboza, Apusozoa, Opisthokonta (predominantly fungi) and Picozoa were notably higher in the benthos than in the plankton. In contrast, Archaeplastida and Hacrobia were more diverse in planktonic (238 and 309 OTUs in surface samples; 175 and 264 OTUs in DCM samples) than in benthic communities (50 and 179 OTUs).
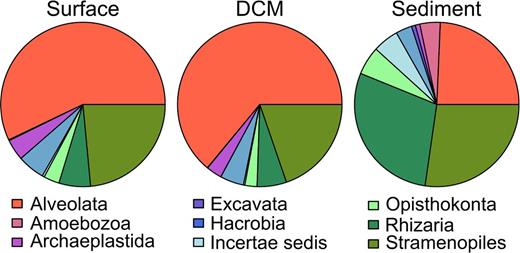
Taxonomic community compositions as revealed by the PR2 database. The pie charts reflect the distribution of OTUs within major protist groups, by pooling the data of all samples from each habitat. The surface dataset included 5747 distinct OTUs, the DCM dataset 5685 distinct OTUs and the sediment dataset 5616 distinct OTUs.
On a lower taxonomic level, we observed a higher OTU richness in benthic samples for 10 of the 19 most abundant groups (Fig. 4). In seven of these groups, the OTUs detected in the benthos accounted for more than 70% of the OTUs. These groups comprised the Apicomplexa (Alveolata), Apusomonadidae (Incertae Sedis), Centrohelida (Hacrobia), Discosea and Tubulinea (both Amoebozoa), as well as the previously mentioned Cercozoa and Fungi. Further groups mainly detected in the benthos included Ciliophora (Alveolata), Bacilliarophyceae and Labyrinthulomycetes (both Stramenopiles). Dinoflagellates, however, as the taxonomic group with highest OTU richness in total, were predominantly detected in planktonic samples. Acantharea (Rhizaria), MAST (Stramenopiles) and MALV (Alveolata) are three other taxonomic groups with heterotrophic members that were distinctively more often detected in planktonic than in benthic samples. Similar observations were made among the predominantly phototrophic groups Chlorophyta (Archaeplastida), Chrysophyceae and Dictyochophyceae (both Stramenopiles), and Haptophyta (Hacrobia). Figures S4 and S5 (Supporting Information) provide a closer look on the occurrence and distribution of phototrophic taxa and show that Cryptophyta and Rhodophyta were also mostly found in planktonic samples, while more diatoms were found in the benthos (677 OTUs) than in the plankton (445 OTUs).
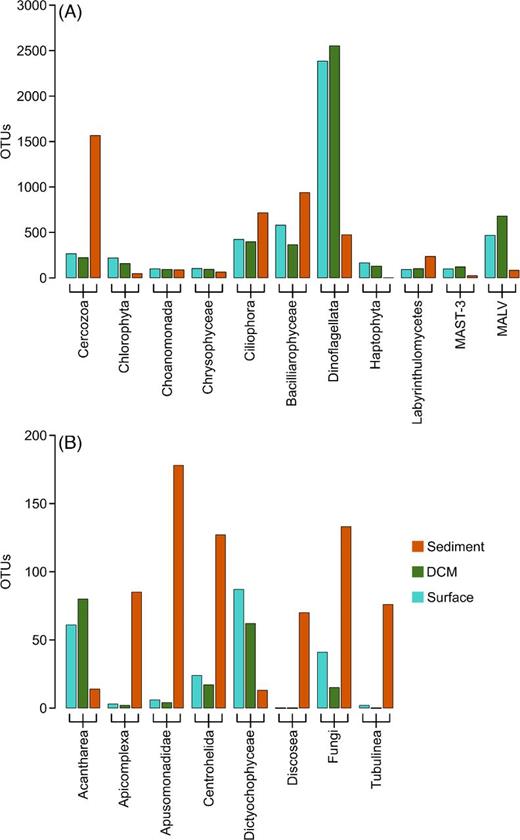
Number of OTUs within taxonomic groups in planktonic and benthic samples. Only groups contributing to at least 1% of the OTU number in either surface, DCM or sediment communities were considered. Note the different scale among the two panels, to display taxonomic groups with more than 200 OTUs in total (A) or with less than 200 OTUs in total (B).
Database coverage and genetic divergence of plankton and benthos OTUs
To assess how well the observed diversity of OTUs matched previously collected data, we calculated their degree of genetic similarity to reference sequences of the taxonomically curated PR2 database and to environmental reference sequences of earlier protist diversity inventories deposited in NCBI's SRA (Fig. 5). In both BLAST analyses, the novelty profile was much higher for benthic OTUs, while surface and DCM OTUs exhibited an almost identical profile. Moreover, the genetic similarity of BioMarKs OTUs to PR2 references (Fig. 5A) was significantly lower (P < 0.001) than to environmental references of the SRA database (Fig. 5B). Considering that 71.8% of the planktonic OTUs in our study can be assigned on a 97%-sequence similarity value to references in PR2, this database misses 28.2% of the potentially detectable plankton species (conservative estimate, see discussion). Among benthic protist communities, 74.4% of the OTUs did not retrieve a taxonomically assigned hit in PR2 at the same threshold of 97% similarity. Regarding the SRA BLAST results, 78.6% of the planktonic OTUs in our study (n = 8988 OTUs) were at least 97% similar to previously deposited environmental references, compared to only 42.7% of the OTUs from benthic samples (n = 2400 OTUs). These numbers illustrate that the vast majority of planktonic OTUs had already been detected in previous environmental diversity surveys. This, however, was not the case for benthic OTUs. Thus, BioMarKs benthos analyses contributed a high proportion of novel OTUs to the environmental reference database.
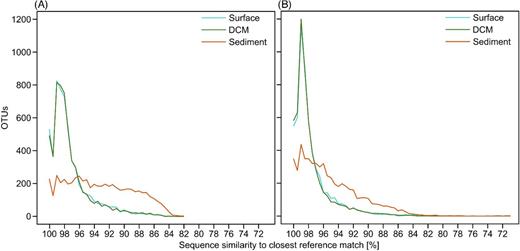
Rank abundance curves displaying the sequence similarity distribution of OTUs against reference databases. Results are shown for two different BLAST queries, against the PR2 database (A) and against a custom-built subset of NCBI's SRA (B). The curves display the number of OTUs with a given similarity with the closest match from the respective reference database. Sequence similarities are binned in 0.5% intervals.
On closer examination of the PR2 BLAST results, the mean sequence divergence of OTUs detected in surface and DCM samples from references of the taxonomic reference database was 2.6% (Fig. 6). By contrast, the mean sequence divergence of OTUs from sediment samples to PR2 accessions was 6.6%, indicating that the benthic compartment contains protist species more distantly related to previously deposited taxa than the planktonic compartment. Specifically among the Alveolata, Hacrobia, Opisthokonta, Rhizaria and Stramenopiles, the difference in divergence between plankton and benthos was statistically significant (P < 0.001). For example, while the mean sequence divergence of OTUs assigned to Rhizaria from PR2 references was 3.5% in both the surface and DCM, the averaged divergence was 8.2% in the sediment.
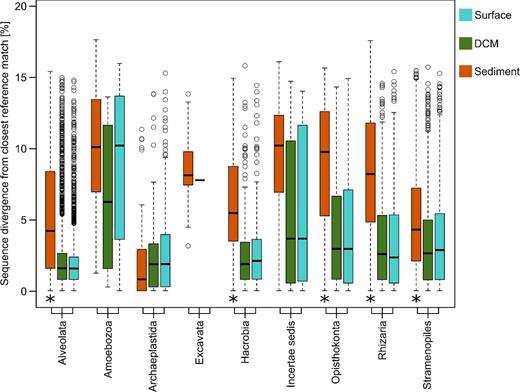
Sequence divergence of OTUs to their closest taxonomic hit. Each boxplot comprises the sequence divergence values of all OTUs within a given taxonomical group from the same habitat to their closest reference in the PR2 database. The taxonomic assignment is shown at the supergroup level. Missing boxplots indicate that the taxonomical group was not detected in the respective habitat. For each taxonomic group, differences between the distribution of sequence dissimilarity values of sediment OTUs to planktonic OTUs were tested for significance (P < 0.001, indicated by asterisks). The distribution of sequence dissimilarity values was never significantly different between DCM and surface OTUs. Black bars represent the median of each boxplot, the part of the box above the median represents the upper quartile; accordingly, the part of the box below the median represents the lower quartile. Circles show the outliers of each group of data.
DISCUSSION
High α- and β-diversity shapes coastal benthic protist communities
The α- and β-diversity patterns (Figs 1 and 2) of protists along the European coastline support previous notions of highly diverse protist communities from different benthic habitats in the world's oceans (Dawson and Pace 2002; Edgcomb et al.2002; López-García et al.2003; Stoeck and Epstein 2003; Takishita et al.2005; López-García, Vereshchaka and Moreira 2007; Scheckenbach et al.2010; Pawlowski et al.2011; Bik et al.2012; Gong et al.2015). A direct comparison of OTU numbers to many of these initial studies is difficult, since most relied on clone library approaches (Dawson and Pace 2002; Edgcomb et al.2002; López-García et al.2003; Stoeck and Epstein 2003; Takishita et al.2005; López-García, Vereshchaka and Moreira 2007; Scheckenbach et al.2010) that produced fewer genetic signatures than the current pyrosequencing approach. Consequently, Scheckenbach et al. (2010) estimated a mean OTU richness of 489 in benthic biodiversity hotspots, such as hydrothermal vents, and 1240 in abyssal sediments. These numbers would be well below the mean estimated species richness of 2776 OTUs in BioMarKs sediment samples. Other studies relying on 454-pyrosequencing detected similarly high benthic diversity (Pawlowski et al.2011; Bik et al.2012; Gong et al.2015). One of these surveys observed between 393 and 1049 protist OTUs, and estimated between 421 and 1051 OTUs in coastal sediment sites of the Yellow Sea (Gong et al.2015). OTU richness in European coastal sediment samples was higher, with observed protist OTU numbers ranging from 493 to 2499 and estimated OTU numbers ranging from 721 to 3573. The BioMarKs numbers are closer to those observed in Arctic and Southern Ocean deep-sea samples (between 942 and 1756 observed OTUs) (Pawlowski et al.2011).
In contrast to most previous studies, our data allowed us to analyze benthic communities in the context of planktonic communities from overlying water masses of the euphotic zone. Such data are scarcely available for protists and usually limited to specific lineages. One example is a Sanger sequencing study that focused on ciliates (Doherty et al.2010), which reported little overlap between genetic signatures of benthic and planktonic communities in the Gulf of Maine and Long Island Sound. This finding corroborates our observations on whole protist communities in European coastal habitats (Fig. 1B). More data exist, however, for benthic-planktonic community comparisons of marine bacteria. Zinger et al. (2011) showed that bacterial OTU richness and β-diversity was much higher in coastal sediments than in coastal surface waters. Similar results were obtained in an arctic fjord HTS survey (Teske et al.2011). These patterns nicely reflect those obtained in our study on protists.
Building upon the Massana et al. (2015) study, we targeted the question of the magnitude of benthic compared to planktonic diversity by contrasting the degree of observed richness with the degree of estimated richness (Fig. 1A). In the same context, we highlighted how much of this observed diversity likely represented novel diversity (Figs 5 and 6), a previously unexamined topic. Furthermore, we contrasted the β-diversity among benthic and planktonic communities (Fig. 2), illustrating small overlap between benthic and planktonic diversity, but also among benthic communities in particular. Given that biodiversity is considered to be higher in coastal than in open ocean habitats (Gray 1997; Zinger et al.2011), the BioMarKs data suggest that marine coastal sediments may be the world's largest reservoir of protist diversity, much of which is still undetected and most of which is still undescribed in public databases.
One major factor that might promote high diversity in benthic protist communities is a large number of distinct benthic habitats due to horizontal and vertical gradients in both physical and chemical characteristics. Even at microscale, habitat heterogeneity in marine sediments reflects gradients in grain-sizes, oxygen concentration or organic matter content (Pedersen, Smets and Dechesne 2015). The diversity of physicochemical microhabitats likely promotes the existence of highly specialized organisms and is probably an important driver for species-richness patterns (Hortal et al.2009). We thus argue that our findings of high protist richness and heterogeneity at comparably small geographical scales represent a general trend in benthic diversity, which is well supported by previous findings, e.g. in the Yellow Sea, where high α- and β-diversity patterns in coastal marine sediments were unveiled (Gong et al.2015). To further investigate the effect of niche partitioning, species-area relationships and distance-decay relationships on small spatial and temporal scales could be analyzed for planktonic and benthic protists at the same locales (Franzén, Schweiger and Betzholtz 2012; Zinger, Boetius and Ramette 2014). In addition to habitat heterogeneity, geological structures at the seafloor may act as biogeographical barriers. Even locally, this results in a spatial separation of protist communities (Scheckenbach et al.2010). Both factors, niche partitioning and allopatric speciation processes may work in concerto to generate and maintain a high diversity of protists in sediments. In direct comparison, environmental heterogeneity is surely much more pronounced in the benthos (Orcutt et al.2011) than in the plankton, although the pelagic realm may create patchy distributions of protists as well (Menden-Deuer and Fredrickson 2010; Dolan and Stoeck 2011).
Additional reasons for diverging protist communities between individual benthic sites (Fig. 2) may also be of technical nature: we found that all sediment samples were severely undersampled as a result of their high diversity (Fig. S3, Supporting Information). Because of this undersampling, community divergence among different sediment samples may be artificially inflated. It is, however, reasonable to assume that with increasing sampling effort the proportion of OTUs that are shared between two samples and the proportion of OTUs that are unique to each of these samples would remain similar. We therefore argue that the observed high Jaccard distance between the sediment protist communities is more due to true (biological) heterogeneity in species memberships rather than to (technical) undersampling.
Different protist taxon groups thrive in plankton and benthos
Benthic protist diversity uncovered by environmental HTS is comprised of (i) resident species of truly benthic origin; (ii) transient species, which spend at least part of their life cycle living actively in or on sediments; (iii) non-resident species of planktonic origin present as inactive resting stages, or as recently settled cells. OTUs of resident species clearly dominated the benthic protist communities in our analyses (Fig. 1B). Though transient species are commonly found among different taxonomic groups (Garstecki et al.2000), we found only little overlap between benthic and planktonic OTUs (Figs 1B and 2). A notable fraction of this overlap was related to diatoms, Chrysophyceae and Chlorophyta (Fig. S4, Supporting Information). Since all of these groups include species of planktonic origin which are able to form benthic resting stages (McQuoid and Hobson 1996; Duff, Zeeb and Smol 2013), we cannot rule out that at least some of the phototrophic OTUs in sediments could correspond to phytoplankton cysts or cells that had sunk to the sea floor shortly before sampling. Genetic signatures of the planktonic diatom family Leptocylindraceae in sediment samples represent such a peculiar case (Nanjappa et al.2014). However, particularly among phototrophic protists, diatoms were more often detected in the benthos than in the plankton. Indeed this group is known to harbor a larger diversity of benthic than planktonic species, especially in shallow coastal waters (Mann and Evans 2007). Regarding the small amount of shared OTUs between benthos and plankton in general, we argue that genetic signatures of dead or sinking organisms or dissolved RNA were considerably limited.
A striking difference in the community composition between planktonic and benthic protists at a higher taxonomic level is the dominance of numerous previously undescribed Rhizaria in coastal sediments. More than 95% of these rhizarian OTUs were assigned to the phylum Cercozoa (Fig. S6, Supporting Information), which have emerged as an abundant and diverse lineage in several other benthic protist diversity studies (summarized by Epstein and López-Garcia 2008). This phylum comprises a large number of gliding zooflagellates, filose and often large reticulose amoebae, which are well adapted to a psammophilic lifestyle (Bass et al.2009; Howe et al.2011), but also occur as parasites of invertebrates, algae and Stramenopiles with benthos-associated stages of their lifecycles (Hartikainen et al.2014). Recent studies on cercozoans could link many previously uncultured environmental sequences to novel benthic cercozoans (Chantangsi and Leander 2010; Howe et al.2011; Berney et al.2013). In addition, genetically divergent benthic cercozoans, both free-living and parasitic, are common and diverse but rarely detected in eukaryote-wide environmental surveys, e.g. the amoebo-flagellate Reticulamoeba (Bass et al.2012) or the parasitic Ascetosporea (Hartikainen et al.2014). These examples further emphasize the importance of this phylum in the marine benthos.
Among the most abundant taxonomic groups we observed a trend of distinctively higher OTU richness in benthic than in planktonic communities (Fig. 4). Besides Cercozoa, this trend was especially prominent for Discosea and Tubulinea, two groups of rhizopod Amoebozoa, which are common inhabitants of coastal benthic ecosystems (Garstecki and Arndt 2000). Likewise, the detection of a high proportion of saprotrophic fungi that contributes to detritus processing in marine sediments is not surprising (Richards et al.2012). Higher OTU richness in benthic samples, though less pronounced, was also observed for ciliates. This result is supported by previous morphological and molecular studies that reported higher benthic than planktonic ciliate diversity (Patterson, Larsen and Corliss 1989; Doherty et al.2010). As discussed above, the situation was similar for diatoms.
We detected an inverse trend in diversity among the Acantharea, Dinoflagellata and MALV, all of which are commonly observed in planktonic communities (Guillou et al.2008; Jeong et al.2010; Massana 2011; Decelle et al.2013). Acantharea and dinoflagellates are mostly planktonic organisms and both groups comprise mixotrophs or members with phototrophic symbionts (Gilg et al.2010; Hansen 2010). MALV, on the other hand, can be found as parasites of ciliates, dinoflagellates, radiolarians and fish eggs (Massana 2011) and are known to form planktonic lifecycles (Guillou et al.2008). Unicellular Archaeplastida (Chlorophyta) and Hacrobia (Haptophyta) were also largely missing from benthos samples but occurred in plankton samples. These groups mainly consist of autotrophic organisms performing carbon fixation (Vaulot et al.2008; Not et al.2012) and are major contributors to the pico- and nanoplankton diversity and biomass across the world's oceans (Bittner et al.2013; Egge et al.2015).
High degree of genetic novelty among benthic protist assemblages
The genetic divergence of benthic OTUs from reference sequences described the marine coastal benthic realm as a habitat having a vast majority of protist diversity still uncharted. This applied to both BLAST analyses, against the curated PR2 reference database and the environmental genetic signatures of the SRA database. Thereby, the mean sequence similarity to taxonomic references (93.4%, Fig. 5A) and to environmental references (95.4%, Fig. 5B) was higher than reported from abyssal sediment communities of protists (87% similarity to taxonomic references, 89% to environmental references) (Scheckenbach et al.2010). Recent advances in sequencing technologies enable the detection and assemblage of a broader diversity of genetic signatures in environmental microbial surveys than ever, but there still remains a clear discrepancy between what can be detected and what can be taxonomically assigned. This discrepancy is especially pronounced among benthic organisms, which display a much higher novelty in genetic diversity surveys than planktonic organisms (Figs 5 and 6). A promising approach towards exploring this novel diversity is the combination of multiple SRA datasets in network analyses to screen for groups of sequences that do not have closely described relatives (Forster et al.2015). Such highly divergent groups detected in independent environmental samples have a high potential to represent genuine undescribed organisms. The design of novel probes and primer-sets specifically for these groups will in turn enable the targeted recovery and identification of the respective organisms from life samples by molecular methods (Gimmler and Stoeck 2015). As our picture of protist diversity heavily depends on the coverage of available public databases (Pawlowski et al.2012), increasing the efforts to isolate, cultivate and describe benthic protist species will also help to link genetic signatures obtained in environmental sequencing studies to a real biological entity with a phylogenetic context. Although the isolation of individual specimen remains a challenging task, methods exist to successfully address organisms in benthos samples. For example, even small flagellates can be isolated by quantitative centrifugation (Starink et al.1994). More recently, a serial dilution method enabled the recovery of diatom spores from coastal sediment samples (Montresor et al.2013). First studies on highly divergent BioMarKs sediment OTUs already led to the discovery of novel cercozoan vampirellids (Berney et al.2013) and opisthokont Fonticulida (del Campo et al.2015), two groups that were mostly known from soil or freshwater samples. Regarding the divergence of benthic OTUs from publicly available reference sequences, we suppose that we are just scratching the surface of protist diversity in coastal sediments. Thus, we understand the BioMarKs data as a starting point that may guide the discovery of more novel benthic protist diversity by further taxon-specific screening.
CONCLUSIONS
Over the last 60 years, our perception of marine benthic environments has changed from being biologically inert deserts towards being highly heterogeneous habitats teeming with a multitude of microbial organisms. Even though new technologies allow for addressing this vast diversity, the results of the BioMarKs project strongly imply that the most part of benthic protist diversity remains a black box. While sampling the deep seafloor surely imposes many challenges and restrictions that have lagged the exploration of benthic diversity, our data show that it is not mandatory to focus on such remote environments when looking for highly diverse protist communities. From a quantitative (i.e. OTU richness) and qualitative (i.e. degree of genetic divergence) point of view, coastal sediments inhabit intriguingly rich protist assemblages on local and regional scales. Increasing the efforts to explore these assemblages will be beneficial to learn more about the dispersal patterns of benthic protists, their roles in ecosystem functioning and to complement current species inventories by identifying many still unknown organisms.
SUPPLEMENTARY DATA
We would like to thank the Regional Computing Center at the University of Kaiserslautern for providing computational resources.
FUNDING
This work was supported by the and is part of the EU-FP7 ERA-net program BiodivERsA, under the project BioMarKs []. Dominik Forster was supported by a graduate scholarship of . Micah Dunthorn and Frédéric Mahé were supported by the [grant ]. Thorsten Stoeck was supported by the [grant ]. Daniel Vaulot was supported by the European Union [grants , ].
Conflict of interest. None declared.
REFERENCES
