


The plant microbiome is a key determinant of plant health. Less is known about the phyllosphere microbiota and its driving factors in built environments. To study the variability of the microbiome in relation to plant genotype and climate under different controlled conditions, we investigated 14 phylogenetically diverse plant species grown in the greenhouses of the Botanical Garden in Graz (Austria). All investigated plants showed specific bacterial abundances of up to 106 CFU cm−2 on their leaves. Bacterial diversity (H′: 2.4–7.9) and number of putative OTUs (461–2013) were strongly plant species dependent. Statistical analysis showed a significantly higher correlation of community composition to plant genotype in comparison to the ambient climatic variables. In addition to the microbiome structure, we studied the antagonistic potential towards the foliar pathogen Botrytis cinerea as functional indicator. A high proportion of isolates (up to 58%) were able to inhibit pathogen growth by production of volatile organic compounds (VOCs). Data of structure and function were linked: frequently isolated VOCs producers (e.g. Bacillus and Stenotrophomonas) were highly present in phyllosphere communities, which were dominated by members of Firmicutes. This study indicates that indoor ornamentals feature a distinct, stable microbiota on leaves irrespective of the indoor climate.
INTRODUCTION
Plants harbour different microbial communities specific to each individual plant organ: the phyllosphere (Vorholt 2012), rhizosphere (Philippot et al.2013) and endosphere (Hardoim et al.2015). The aboveground parts of a plant are dominated by leaves with an estimated global leaf area of 109 km2 (larger than the plain surface area of our planet ∼0.5 × 10⁹ km2; Woodward and Lomas 2004). Although filamentous fungi, archaea, yeast and algae are known to inhabit the leaves, bacteria are the most dominant microbial colonisers of the phyllosphere found on average of 106–107 bacterial cells cm−2 of leaf surface (Lindow and Brandl 2003). While the microbiome of the rhizosphere is influenced by soil type and genotype and has been thoroughly studied for over a century (Smalla et al.2001; Berg and Smalla 2009; Philippot et al.2013), less is known about the drivers that influence microbial communities in the phyllosphere (Vorholt 2012). The phyllosphere represents the plant–air interface, which is characterised by permanently changing abiotic conditions. Moreover, leaves can be an extreme habitat for microorganisms especially when they are exposed to elevated radiation levels, low water and nutrient content, as well as to other physical and chemical adversities. Secondary metabolites produced by the plant, the presence of antimicrobial wax layers, trichomes and hairs shape the composition of phyllosphere communities (Bodenhausen et al.2014; Ritpitakphong et al.2016). Studies also showed that plant genotype along with environmental factors can influence bacterial community structure in the phyllosphere (Vorholt 2012). Recently, carbohydrates such as sucrose, fructose and glucose, and amino acids influencing bacterial colonisation were identified on the Arabidopsis leaf surfaces by environmental metabolomics (Ryffel et al.2016). Plants grown indoors provide specific conditions for microorganisms. For example, a distinct bacterial signature was shown for lettuce grown under greenhouse conditions and in the field (Williams and Marco 2014). Disentangling the factors shaping microbial composition is an important objective (Hacquard 2016). However, an overview of a broader range of leaf-associated phyla especially on indoor ornamentals is still lacking.
Phyllosphere-colonising bacteria are not only residents inhabiting leaves, they also help to stimulate plant growth and inhibit or promote pathogen infection of plant tissues (Lindow and Brandl 2003). Phyllosphere bacteria can additionally play a key role in carbon and nitrogen cycling (Delmotte et al.2009), and help in important environmental processes such as methanol degradation (Van Aken et al.2004) and nitrification (Papen et al.2002). Recently, beneficial effects of phyllosphere bacteria on built environments and their potential to change microbial abundance and diversity in built environments have been reported (Mahnert, Moissl-Eichinger and Berg 2015). Indoor plants can act as an important source of beneficial microbes by increasing microbial diversity and beneficial microorganisms and can influence the microbiome of a room (Mahnert, Moissl-Eichinger and Berg 2015). Due to the fact that we spent most of our lifetimes in built environments in many parts of the world, this is an important health issue (Berg, Mahnert and Moissl-Eichinger 2014). Despite this potential, there is limited information about the functional diversity of phyllosphere bacterial communities on the surface of the leaves of plants grown inside a built environment.
Pathogen defence is also an important function of host-associated microbiomes; this was intensively studied in the rhizosphere. However, the community patterns in the rhizosphere are biofilm-like while in the phyllosphere more dispersed communities were found. Therefore, we expected that bacteria in the phyllosphere interact with host plants and other microbial species through emissions of volatile organic compounds (VOCs), which we discovered for plant-associated bacteria in 2003 (Ryu et al.2003). VOCs are of great importance in their capacity as signalling molecules in fungal–bacterial interactions (Schmidt et al.2016) and are able to suppress fungal plant pathogens (De Vrieze et al.2015). However, nothing is known about how they are produced by leaf-associated bacteria and their function on indoor plants. We expect that leaf-associated bacterial strains produce VOCs to suppress plant pathogens.
The objective of our study was to analyse the phyllosphere microbiome of 14 plant species (Aechmea eurycorymbus, Aloe arborescens, Beaucarnea recurvata, Chlorophytum comosum, Dracaena draco, D. marginata, D. fragrans, Epipremnum aureum, Howea forsteriana, Malvaviscus penduliflorus, Musa acuminata, Musa × paradisiaca, Nephrolepis cordifolia and Olea europaea), which represent phylogenetically different plant families as well as widespread indoor ornamentals. We also aimed to study the variability of the microbiome in relation to plant genotype and climate. Thus, we used a unique facility, the greenhouses of the Botanical Garden of Graz, where all of the plants were grown under different controlled conditions (tropical, warm temperate, cold temperate climate), allowing the possibility to unravel the factors shaping microbiota composition. We analysed the microbiomes of leaves by using 16S rRNA gene amplicon libraries in the controlled greenhouse setting. The production of VOCs against the pathogenic fungus Botrytis cinerea was additionally monitored to identify the functional potential of culturable bacterial strains by bioactive volatiles. We decided for Botrytis as model organism because (i) this is one of the most important pathogens causing foliage plant diseases, (ii) its cosmopolitan and ubiquitous occurrence and (iii) its broad host range, including a lot of the studied ornamentals.
MATERIALS AND METHODS
Site description and plant maintenance inside the greenhouses
Samples were collected from the greenhouse complex of the Botanical Garden of Graz. The Botanical Garden is situated in Graz, Austria at 47°04′55″ N, 15°27′28″ E, with an elevation of 378 m above sea level. The greenhouse complex (Fig. S1, Supporting Information) has four different houses simulating different terrestrial climatic conditions (Figs S2 and S3, Supporting Information) and a nursery where all the young plants and seedlings are located. Plant-care measures for the greenhouse plants included watering, application of fertilisers and a microbial pesticide. Watering of plants in different houses varied in frequency, depending on seasonal changes. Plants in the cold temperate house, for example, were watered only in the morning during winter, while those found in the tropical house were watered more frequently. The Botanical Garden has a cistern that catches rainwater and serves as a reservoir for watering of the plants. Two types of fertilizer were used to help maintain healthy plants: (i) an NPK liquid fertilizer for foliar application (Wuxal® Top N) and (ii) a water-soluble phosphate and potash nutrient (Hakaphos® Rot 8 + 12 + 24 + (4)) applied in the soil. Application of these fertilizers also varied depending on the state of plant health. The biological pesticide DiPel® was also used to protect the leaves of greenhouse plants from Lepidoptera larvae (caterpillar) that forages on them. This pesticide contains the naturally occurring bacterial strain Bacillus thuringiensis (Bt) kurstaki known for its toxicity against caterpillars. DiPel application is carried out whenever there is an apparent infestation of Lepidopteran larvae, and is applied by spraying the solution on the leaves of affected plants. Along with foliar fertilizer and microbial pesticide, a non-ionic surfactant (Break Thru® S240) was also applied to safeguard the effectiveness of the treatments. Both protocols were taken in all greenhouse areas except the nursery.
Sampling design and procedure
We selected 14 different species of indoor plants based on (i) studies of plants, which specifically focused on health issues (Orwell et al.2004; Pegas et al.2012); (ii) plants belonging to the same genus able to grow under different greenhouse conditions; and (iii) the distribution and importance of indoor ornamentals. Only one plant per species was used as sample plant, and several leaves from this plant (except for Musa sp. where only one leaf sample was taken from each plant) were chosen randomly from all directions and height of the stem. Using sterile gloves and instruments, the leaves were separated from the rest of the plant by cutting from the base of the petiole avoiding any possible contact with the leaf blade. To obtain four replicates per sample, excised leaves from one plant were placed in four different 25 × 32 cm bags (ARO freezer bags, Düsseldorf, Germany). Immediately after collection, all samples were stored in a portable cooler with ice packs (GIO'STYLE Colombo Smart Plastics, Italy). All samples were immediately transported back to the laboratory at the Institute of Environmental Biotechnology, Graz University of Technology (TU Graz), Graz, Austria for microbial isolation and DNA extraction.
A total leaf area of 720 cm2 was measured for samplings by placing random leaves on top of a pre-prepared cardboard stencil covered with sterile freezer bags, done inside a laminar hood to prevent contamination. Removal of microbial cells from leaves was conducted by placing 720 cm2 of a leaf inside a freezer bag (doubled as precaution from wear and tear) containing 50 ml 0.85% NaCl solution with Tween 80. Bags with leaves were then subjected to a series of steps including washing and sonication. Washing was done by subjecting the leaves to bag-mixer treatment (BagMixer Interscience, St. Nom, France) for 3 min. This step was immediately followed by sonication, using a Transsonic Digital T910 DH sonicator (Elma, Singen, Germany), at 60 Hz for 3 min. Immediately after the first sonication step, a bag mixer treatment for 1 min, a sonication at 60 Hz for 3 min and a final bag mixing for 1 min followed consecutively to complete the series. The resulting microbial solution was then transferred to a 50 ml Sarstedt tube. For culture-dependent experiments, 100 μl of the solution was serially diluted 10-fold and plated on both Reasoner's 2A (R2A) (Carl Roth GmbH + Co. KG, Karlsruhe, Germany) and Nutrient Broth II agar (NA) media (SIFIN, Berlin, Germany) in duplicates. The remaining microbial solution was then centrifuged (using Sorvall RC-5B Refrigerated Superspeed Centrifuge; DuPont Instruments, USA) at 6169 g for 20 min to pellet cells. The moist pellets were then transferred to 2.0 ml sterile Eppendorf tubes and were further centrifuged at 18 000 g for 20 min. Pellets were stored at −70°C until DNA extraction.
16S rRNA profiling using MiSeq Illumina Sequencing
Genomic DNA was extracted using the FastDNA® SPIN kit for soil (MP Biomedicals, Solon, OH, USA) as directed in the instruction manual. A total of 56 DNA samples were extracted, including four replicates for each of the 14 plant samples.
PCR amplifications targeting the V4 region of the 16S rRNA gene were conducted for each of the 56 samples using 515f/806r primers carrying sample-specific tags (Caporaso et al.2011). Using the thermocycler TC-Plus (TECHNE, Staffordshire OSA, UK), DNA was amplified in triplicate PCR reactions (50 μl each); 25 μl of 2 × Plant buffer, 0.40 μl of 1 × KAPA3G Plant DNA polymerase, 3 μl of 5 μM for each primer, 17.60 μl PCR grade water and 1μl of the DNA template (95°C, 3 min; 32 cycles of 95°C, 30 s; 60°C, 15 s; 72°C 12 s; and elongation at 72°C, 30s). Amplicons from three independent reactions were then pooled and purified using the Wizard SV Gel and PCR Clean-Up System (Promega, Madison, USA).
Purified amplicons with inline barcodes were pooled in equimolar concentrations and sent for sequencing on the Illumina MiSeq platform (Eurofins Genomics, Ebersberg, Germany) with chemistry version 3 (2 × 300 bp). Pre-sequencing preparations were conducted by the company. Samples were quantified and pooled in equimolar concentrations according to HT DNA-QC (Agilent Technolgies Sales & Services GmbH & Co.KG.). After indexing, Illumina flow cells were prepared for sequencing including DNA of PhiX as a sequencing quality control. Illumina reads were demultiplexed according to 6 bp index codes with one mismatch allowed. All reads passed the default chastity filter from Illumina. 78% of all reads passed a quality filter of Q30 (99.9% base call accuracy). No mismatches were allowed for the following demultiplexing of filtered reads and sorted according to barcodes. Only true pairs (corresponding barcodes and primers on both reads) were used for following analysis in QIIME.
Bioinformatics and statistics
Illumina reads were filtered and sorted according to barcodes on 5′ and 3′ prime site. Raw reads (see Table S1, Supporting Information) are accessible under project PRJEB13300 in the European Nucleotide Archive (www.ebi.ac.uk). Corresponding forward and reverse reads were joined, and length and quality were filtered in QIIME 1.8.0 (Caporaso et al.2010; Mahnert, Moissl-Eichinger and Berg 2015). Barcodes and primer sequences were trimmed and chimeric sequences (reference: Greengenes gg_13_8) were removed with USEARCH (Edgar 2010). Grouping of reads into OTUs (operational taxonomic units) was done based on the Greengenes gg_13_8 release as an open reference. The resulting OTU table in biom format was filtered for single and doubletons as well as assigned reads to ‘chloroplasts’ and ‘mitochondria’ before it was rarefied and served as input for following alpha and beta diversity analysis and statistics. Adonis, ANOSIM (analysis of similarities), ANOVA (analysis of variances), Kruskal-Wallis, MRPP (multi response permutation procedure), BIO-ENV (Clarke and Ainsworth 1993) and Mantel tests were calculated in QIIME and R (vegan package) with 999 permutations (Dixon 2009). Linear discriminant analysis effect size (LEfSe) analysis was conducted on a galaxy module provided by the Huttenhower lab (Segata et al.2011). Resulting BEST values of measured variables (plant species, leaf weight, temperature and relative humidity) of the BIO-ENV were then superimposed on an NMDS (non-metric multidimensional scaling) ordination with calculated ellipses per greenhouse area. Since no anatomical analysis was done to complement the plant species-specific effect on the microbial composition, the factor leaf weight (in respect of equal leaf surface areas) was included to represent a numerical morphological characteristic that is unique to a plant species.
Cultivation and isolation of bacteria
Serial dilutions of microbial solutions were plated on Reasoner's 2A (R2A) and Nutrient broth II (NB II) agar media, and incubated at room temperature for 5 days. Colony counts were expressed as CFU log 10 cm−2 leaf. Colonies with distinct phenotypes were then transferred to 96-well plates with NB II medium and 30% glycerol for storage. Each strain was numbered according to plant sample genus (except for Aechmea eurycorymbus where the common name Bromelia was used as a reference), origin, and isolation medium (e.g. Dth1N1: bacterial isolate from Draceana from the tropical house grown on NB II medium). All isolates were kept in at −70°C at the Institute of Environmental Biotechnology, TU Graz, Graz, Austria.
Functional characterisation of isolates
A two-clamp VOCs assay (TCVA) was performed using the set-up described in Cernava et al. (2015) for analysis of the antagonistic property of the volatiles produced by the isolated microbes against spore germination and mycelial growth of Botrytis cinerea. Botrytis cinerea, maintained on a potato dextrose agar (PDA), from the Institute of Environmental Biotechnology, TU Graz, was used as model pathogen for this study. Fungal inoculum was prepared by growing the fungus for 6 days on fresh PDA medium. After this period, the B. cinerea isolate was observed to have well-developed hyphae and was already sporulating.
A total of 1284 bacterial isolates were screened for their antagonistic activity against the pathogenic fungus B. cinerea. Isolates were streaked onto Nutrient agar (NB II with agar) in 6-well plates and incubated for 24 h at 30°C. After the 24 h incubation period, plates observed positive for growth were clamped together with freshly prepared B. cinerea 6-well plates. Botrytis cinerea containing plates were prepared by cutting 5 mm plugs from a 6-day-old B. cinerea inoculum plate and placing it on the centre of each well of a 6-well plate with Synthetic Nutrient-Poor Agar (SNA pH adjusted to 5.5). Setting up of the plate pair was carried out according to Cernava et al. (2015) and was done in four replications.
The set-up was incubated at room temperature for 3 days under dark conditions to eliminate any light-induced effect on the experiment. Inhibition of spore germination was determined by the absence of spore formation on the B. cinerea plates with VOCs treatment. On the other hand, the percentage of mycelial growth inhibition of B. cinerea was calculated by measuring the difference of respective diameters of B. cinerea with VOCs treatment and the control of B. cinerea, which was then divided by the diameter of the control.
Characterisation and identification of isolates
BOX-PCR fingerprint analysis followed by Sanger sequencing was carried out in order to group the active VOCs-producing bacterial isolates. DNA was extracted by homogenisation of bacterial colonies using the MP FastPrep-24 sample preparation system FastPrep-24 Instrument (Illkirch, France) (30 s; 6 m s−1). Homogenised samples were frozen (at −20°C for 30 min), heat-shocked at 100°C, and immediately centrifuged (16 000 g at 4°C for 5 min; HERMLE Labor Technik, Germany). Using the Tpersonal Combi, Biometra thermocycler (Biometra GmbH, Germany) DNA was amplified in 25 μl PCR reaction mix, containing 1 μl of the extracted DNA, 5 μl of Taq&Go PCR mix, 2.50 μl of 100 pmol ml−1 BOX A1 primer (5′-CTA CGG CAA GGC GAC GCT GAC G-3′) and 16.50 μl PCR grade water (95°C, 6 min; 35 cycles of 94°C, 1 min; 53°C, 1 min, and 65°C, 8 min; with final extension at 65°C, 16 min). The resulting BOX-PCR fingerprints were evaluated using the GelComparII program (Kortrijk, Belgium). Cluster analysis was done using the unweighted pair-group average algorithm.
Representative isolates from each box cluster were used for Sanger sequencing. DNA extraction was done by denaturation of isolates (preheating at 105°C; denaturation at 98.05°C, 15 min; final hold at 10°C; using the thermocycler TC-Plus (TECHNE, Staffordshire OSA, UK) immediately followed by centrifugation (3220 g for 2 min; using Centrifuge 5810 R (Eppendorf, Germany). PCR amplification for each strain was performed using 30 μl of PCR reaction mix (6 μl Taq&Go, 1.5 μl 27f primer, 1.5 μl 1492r primer, 20 μl PCR grade water and 1 μl DNA template). Amplification was done using a TC-Plus thermocycler (TECHNE, Staffordshire OSA, UK) (95°C, 5 min; 40 cycles of 95°C, 30 s; 57°C, 30 s; 72°C, 1 min 30 s; final extension at 72°C, 5 min). PCR products were then purified using the Wizard SV Gel and PCR Clean-Up System (Promega, Madison, USA), and sent to LGC Genomics (Berlin, Germany) for Sanger sequencing. Sequences were identified by BLASTn against the NCBI 16S rRNA gene reference database (http://blast.ncbi.nlm.nih.gov/Blast.cgi). Sanger sequences with a minimum length of 700 bp were considered acceptable for analysis. These reads are accessible under accession number SUB1654201 in GenBank of NCBI.
RESULTS
Phyllosphere bacterial community structure
A total of 1.04 × 10⁶ sequences were generated for the 14 plant samples. The average read number per sample was 18 594; ranging from 757 to 61 561 sequences. A total of 12 704 OTUs were identified at 97% similarity. Amplicon reads showed a high relative abundance of the phyla Firmicutes (40.4%), Proteobacteria (22.5%) and Actinobacteria (15.7%) (Fig. 1). Two archaeal phyla were also detected, namely Crenarchaeota and Euryarchaeota with 0.13% and 0.01% abundance, respectively.

Overview of phyllosphere microbial communities found on 14 different greenhouse plants on phylum level. The size of the spheres indicates the relative abundance of the corresponding phylum; larger spheres indicate higher abundance. Index shows the top 10 most abundant phyla.
Members of the phylum Firmicutes were most abundant on the phyllosphere of plants from the tropical, warm temperate and succulent houses of the greenhouse complex, whereas Proteobacteria were most abundant on the phyllosphere of plants from the cold temperate house, and Deinococcus-Thermus in the nursery (Fig. 2). Relative abundance of bacterial phyla also differed for each plant. Firmicutes were found in greatest abundance on the leaves of Epipremnum aureum (88.6%), Musa × paradisiaca (61.4%), Dracaena fragrans (74.7%), Howea fosteriana (48.8%), D. draco (62.5%), Olea europaea (40.5%) and Beaucarnea recurvata (77.5%), while Proteobacteria were observed in their greatest abundance on the leaves of Malvaviscus penduliflorus (50.6%) and Chlorophytum comosum (44.0%). On the other hand, Actinobacteria were found in greatest abundance on the leaves of D. marginata (35.9%) and Musa acuminata (56.0%), and phylum Deinococcus-Thermus on the leaves of Aechmea eurycorymbus (40.7%), Nephrolepis cordifolia (44.1%) and Aloe arborescens (41.8%) as shown in Fig. 2. Using LEfSe, bacterial taxa that were significantly distinct either for different greenhouse rooms (Fig. 3A) or respective plant species (Fig. 3B) could be identified. Therefore, several archaeal taxa (mainly attributed to the phylum of Thaumarchaeota) were characteristic for samples obtained from plant leaves growing in a cold temperate climate, while sequences of Stenotrophomonas were representative for the dry climate of the succulent house and Streptomyces was associated with samples from warm temperate environments. Likewise certain plant species featured distinct microbial taxa on their leaves. However, most representative OTUs were only poorly resolved. For instance, A. eurycorymbus was distinguishable by sequences of Deinococcus, while Be. recurvata showed distinct profiles for Bacillus and Stenotrophomonas. Chlorophytum comosum grown in a cold temperate climate revealed most distinct features by the LEfSe analysis.
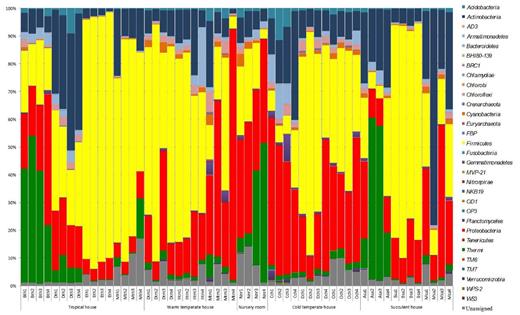
Relative abundance of phyllosphere bacterial community composition from 14 different greenhouse plants (four different replicates each). Bth: Aechmea eurycorymbus, Dth: Dracaena marginata, Eth: Epipremnum aureum, Mth: Musa paradisiaca, Dtm: Dracaena fragrans, Htm: Howea forsteriana, Mtm: Malvaviscus penduliflorus, Nnr: Nephrolepis cordifolia, Cch: Chlorophytum comosum, Dch: Dracaena draco, Och: Olea europaea, Asa: Aloe arborescens, Bsa: Beaucarnea recurvata, Msa: Musa acuminate.
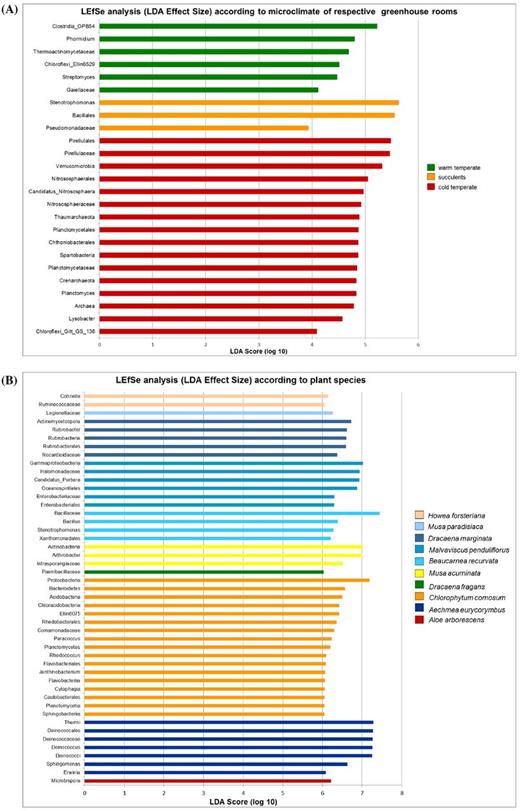
(A) LEfSe based on different microclimates of sampled greenhouse rooms (alpha value for the factorial Kruskal-Wallis test among classes: 0.05; alpha value for the pairwise Wilcoxon test between subclasses 0.05; threshold on the logarithmic LDA score for discriminative features: 2.0; strategy for multi-class analysis: all-against-all, more strict). (B) LEfSe analysis based on different plant species phyllosphere samples inside greenhouse rooms (alpha value for the factorial Kruskal-Wallis test among classes: 0.001; alpha value for the pairwise Wilcoxon test between subclasses 0.001; threshold on the logarithmic LDA score for discriminative features: 6.0; strategy for multi-class analysis: all-against-all, more strict).
The relative abundance of sequences assigned to a genus at a cut-off of 1% for all plant samples is shown in Fig. 4. Highly abundant genera included Deinococcus (10.4%), Arthrobacter (4.6%), Sphingomonas (4.4%), Bacillus (4.2%) and one unidentified genus from the family Bacillaceae (30.1%). The unidentified genus from Bacillaceae was observed to be ubiquitous in all the plant samples. The abundance of Bacillus was found to be higher than 1% in all samples except on N. cordifolia, and Sphingomonas was found ≥1% in all samples except E. areum and Be. recurvata.
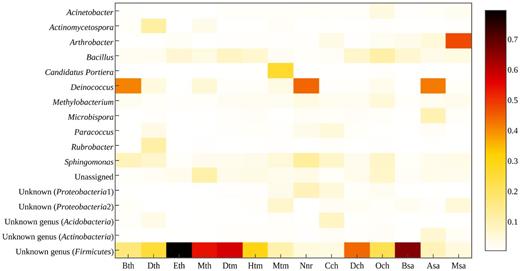
Relative abundance of dominant sequences assigned to genus level (1% cut-off) found on the phyllosphere of 14 different greenhouse plants.
The diversity of the phyllosphere bacterial communities
Rarefaction analysis along with diversity, richness and evenness estimates revealed variation in the phyllosphere bacterial communities per greenhouse and per plant sample. Calculated rarefaction curves showed low slopes and did not reach the saturation point. Correspondingly, the number of OTUs observed covered only 23.6%–37.6% of the estimated taxonomic richness (Chao1), where putative OTUs ranged from 461.3 to 2013.5, as seen in Fig. S4A–F and Table S2 (Supporting Information). The computed Shannon index of diversity (H′) per greenhouse area was found highest in plants inside the cold temperate house (7.9) and was lowest in plants inside the tropical house (2.4). Similar results were visible on the level of respective plant species with E. aureum from the tropical house revealing the lowest (2.6) and C. comosum from the cold temperate house the highest (7.5) diversity (H′) per plant species. Statistical analysis on all applied alpha diversity metrics showed significance for individual plant species and for different greenhouse rooms except estimates for evenness (Table S3, Supporting Information).
Drivers of bacterial community structure
In order to determine the uniqueness of the associations of the phyllosphere bacterial communities in relation to room climate and plant host species, ordination analysis, ANOSIM tests and BIO-ENV were performed. Principal coordinate analysis (PCoA) using Bray-Curtis dissimilarities showed inconspicuous clustering of the phyllosphere bacterial communities (Fig. 5A and B). The phyllosphere bacterial communities of the nursery and succulent house were highly scattered and were observed to overlap with the phyllosphere bacterial communities found in the warm temperate and cold temperate houses, while the communities in the tropical house were distinctly different from all the other greenhouses with a slight overlap of microbial composition to phyllosphere bacterial communities of the succulent house. Furthermore, phyllosphere bacterial communities in the warm temperate and cold temperate houses were distinctly closer to one another than to the rest of the houses. Nevertheless, ANOSIM results showed weak correlation between room climate and phyllosphere bacterial community composition (P = 0.001, R = 0.25).
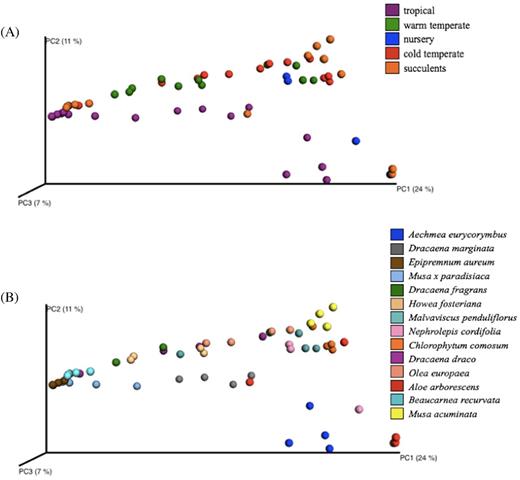
PCoA plots showing the beta-diversity clustering patterns of samples in (A) greenhouse areas, and (B) plant species, based on Bray-Curtis dissimilarities.
On the other hand, ANOSIM showed a stronger correlation between phyllosphere bacterial communities and plant samples (P = 0.001, R = 0.66). This association was attributed to the plant genotype based on the observed correlation of bacterial community composition with similar leaf morphology. It was observed that D. fragrans, H. fosteriana, D. draco and Be. recurvata, having a common ensiform (sword-like) leaf shape, exhibited bacterial communities with smaller distances to each other than to the rest of the sampled plants (Fig. S5, Supporting Information). On the other hand, while the two Musa species share a common leaf shape they have different leaf sizes and exhibit highly distant clusters of bacterial communities. It is, however, highlighted that the leaf characteristic that highly influenced the bacterial community structure may be those that were not covered in this study (e.g. cuticle thickness, number of stomata, thickness of leaves and presence of trichomes).
BIO-ENV analysis provided further evidence of a stronger correlation between bacterial communities and plant species. In Fig. 6, the vectors represent the Spearman rank correlations (ρs) between the variables influencing the phyllosphere bacterial community distribution. According to BIO-ENV correlation analysis (Table S4, Supporting Information), plant species best explains the dissimilarity of the bacterial community structure (BEST = 0.9157), and Fig. 6 showed that the highest degree of influence of the plant species was observed in the phyllosphere of plants from the tropical house, represented by the longest vector. Although humidity and room temperature showed directional influences on the bacterial community distribution, BIO-ENV BEST values (Table S4, Supporting Information) showed that they have lesser influence compared to the plant species, since their addition to the variable combination generated a lower coefficient (ρs) (Clarke and Ainsworth 1993).

NMDS (stress = 0.05; 999 permutations) plot based on Bray-Curtis dissimilarities and the influence of biotic and abiotic variables, shown as vectors, on bacterial community composition determined via BIO-ENV analysis based on Euclidean distances. The length of the vectors is proportional to the degree of influence of the corresponding variable. Species = plant species; H = relative humidity inside the room; C = temperature inside the room; oC = temperature outside the room; g = leaf weight.
Population densities of phyllosphere communities
The highest abundance of culturable bacteria was found on the leaves of C. comosum where 5.05 × 10⁶ and 6.69 × 10⁶ CFU cm−2 were recorded from the R2A and NA media, respectively, while the lowest density was observed on the leaves of M. acuminata with 3.36 × 10² (R2A) and 2.94 × 10² CFU cm−2 (NA) as shown in Table 1. One-way ANOVA results (Table S5, Supporting Information) showed that there are significant differences in the bacterial population densities on the phyllosphere of 14 indoor plants (P < 0.001).
Plate counts (CFU cm−2) and percentages of antagonistic bacteria against the plant pathogenic fungus B. cinerea*.
| CFU ± SD** | Total isolates | Isolates inhibiting both | |||
|---|---|---|---|---|---|
| Greenhouse | Plant species | R2A | NA | tested | growth and sporulation |
| Aechmea eurychorymbus | 1.61E+06±2.95E+04 | 1.48E+06±1.34E+05 | 96 | 2 | |
| Dracaena marginata | 1.13E+06±1.68E+04 | 9.01E+05±6.14E+04 | 96 | 36 | |
| Tropical | |||||
| Epipremnum aureum | 2.99E+05±1.68E+04 | 2.04E+05±6.14E+04 | 96 | 17 | |
| Musa x paradisiaca | 8.13E+05±3.92E+05 | 5.67E+05±2.02E+05 | 96 | 1 | |
| Dracaena fragrans | 4.53E+04±2.14E+04 | 8.39E+03±3.75E+03 | 96 | 21 | |
| Warm temperate | Howea forsteriana | 2.11E+04±1.89E+04 | 3.32E+03±1.45E+03 | 96 | 35 |
| Malvaviscus penduliflorus | 2.41E+04±2.06E+04 | 3.17E+04±3.00E+04 | 90 | 2 | |
| Nursery | Nephrolepis cordifolia | 1.44E+05±1.04E+05 | 1.12E+05±1.09E+05 | 96 | 23 |
| Chlorophytum comosum | 5.05E+06±2.33E+06 | 6.69E+06±3.08E+06 | 96 | 5 | |
| Cold temperate | Dracaena draco | 4.79E+04±3.45E+04 | 1.15E+04±5.81E+03 | 96 | 6 |
| Olea europaea | 1.88E+04±1.61E+04 | 1.39E+04±1.22E+04 | 91 | 22 | |
| Aloe arborescens | 1.15E+05±3.28E+04 | 1.74E+05±4.68E+04 | 96 | 4 | |
| Succulents | Beaucarnea recurvata | 9.89E+04±6.18E+03 | 4.33E+04±8.80E+03 | 96 | 56 |
| Musa acuminata | 3.36E+02±1.76E+02 | 2.52E+02±6.24E+01 | 47 | 3 | |
Colony forming units (CFU) cm−2 shown per growth medium used; Reasoner's 2A (R2A) agar and Nutrient broth II agar (NA) medium.
ANOVA showed that there are significant differences in the bacterial population densities at P < 0.001. (Table S5, Supporting Information)
Antagonistic potential of phyllosphere bacterial communities against Botrytis cinerea
A total of 1284 bacterial isolates from the phyllosphere of 14 indoor plants were screened for their antagonistic potential against B. cinerea using TCVA. Antagonistic effects observed included inhibition of mycelial growth and spore germination (Fig. S6, Supporting Information). Table 1 shows all 233 isolates which were tested positive for both antagonistic effects. Beaucarnea recurvata harboured the highest percentage of antagonistic bacterial strains with 58% of the 96 bacterial isolates exhibiting inhibitory effect on both mycelial growth and spore germination of B. cinerea.
This study focused on identifying these 233 isolates that showed optimum antagonistic potential against the model pathogenic fungus. BOX-PCR fingerprinting and analysis further divided these isolates into 49 genotypic groups at a cut-off level of 60% for cluster analysis generated through GelCompar. Out of these 49 genotypic groups (Table 2), 24 species were identified by Sanger sequencing. Frequently isolated antagonistic bacterial species included Ba. thuringiensis (10), Ba. toyonensis (6), Stenotrophomonas rhizophila (6), Ba. cereus (4), Kocuria haloterans (3) and K. sedeminis (2). There was a high representation of the genus Bacillus with seven different Bacillus species identified (Ba. thuringiensis, Ba. licheniformis, Ba. cereus, Ba. aerius, Ba. toyonensis, Ba. anthracis and Ba. subtilis). Three days after the initial set-up, the VOCs produced by these bacterial species decreased the fungal colony diameter by about 36%–61% compared with the control. The mean percent inhibitions caused by each bacterial species are also shown in Table 2 and ANOVA results showed no significant differences between the means (Table S6, Supporting Information).
Taxonomic classification and mean growth inhibition percentage against B. cinerea of isolated phyllosphere bacterial strains from 14 greenhouse plants.
| Greenhouse | Strains | Plant of origin | % inhibition | Species | Similarity (%) | Accession |
|---|---|---|---|---|---|---|
| Tropical | Bth1N11 | Aechmea eurycorymbus | 52.8 | Deinococcus grandis DSM 3963 | 99 | NR_026399.1 |
| Dth4N3 | Dracaena marginata | 52.1 | Bacillus thuringiensis Bt407 | 100 | NR_102506.1 | |
| Dth4R1 | 49.9 | Bacillus thuringiensis Bt407 | 100 | NR_102506.1 | ||
| Dth3R4 | 47.0 | Bacillus thuringiensis Bt407 | 100 | NR_102506.1 | ||
| Dth3R5 | 52.8 | Bacillus thuringiensis Bt407 | 100 | NR_102506.1 | ||
| Dth1R12 | 38.9 | Staphylococcus saprophyticus ATCC 15305 | 99 | NR_074999.1 | ||
| Dth3R1 | 49.1 | Bacillus thuringiensis Bt407 | 100 | NR_102506.1 | ||
| Dth3N9 | 41.4 | Sphingobium yanoikuyae NBRC 15102 | 99 | NR_113730.1 | ||
| Dth4N9 | 48.0 | Kocuria haloterans YIM 90716 | 99 | NR_044025.1 | ||
| Dth1R9 | 40.0 | Kocuria haloterans YIM 90716 | 99 | NR_044025.1 | ||
| Dth2R10 | 61.2 | Sphingomonas dokdonensis DS-4 | 99 | NR_043612.1 | ||
| Dth4N5 | 37.0 | Brachybacterium conglomeratum J1015 | 99 | NR_104689.1 | ||
| Warm temperate | Dtm2N2 | Dracaena fragrans | 61.3 | Bacillus licheniformis DSM 13 | 99 | NR_118996.1 |
| Dtm2R12 | 51.5 | Bacillus toyonensisBCT-7 112 | 100 | NR_121761.1 | ||
| Dtm3R12 | 53.1 | Kocuria haloterans YIM 90716 | 99 | NR_044025.1 | ||
| Dtm3N4 | 51.0 | Bacillus cereusATCC 14579 | 99 | NR_074540.1 | ||
| Warm temperate | Htm3N10 | Howea forsteriana | 56.2 | Bacillus aerius 24K | 100 | NR_118439.1 |
| Htm2N10 | 36.8 | Bacillus toyonensisBCT-7 112 | 99 | NR_121761.1 | ||
| Htm4R1 | 53.2 | Bacillus toyonensisBCT-7 112 | 99 | NR_121761.1 | ||
| Mtm3R3 | Malvaviscus penduliflorus | 49.9 | Bacillus cereusATCC 14579 | 99 | NR_074540.1 | |
| Nursery | Nnr2N2 | Nephrolepis cordifolia | 44.6 | Micrococcus flavusLW4 | 99 | NR_043881.1 |
| Nnr3R10 | 54.9 | Bacillus toyonensisBCT-7 112 | 99 | NR_121761.1 | ||
| Nnr4R12 | 50.7 | Bacillus thuringiensis Bt407 | 100 | NR_102506.1 | ||
| Nnr2R7 | 40.5 | Bacillus anthrasisstrain Ames | 99 | NR_074453.1 | ||
| Nnr3N9 | 39.4 | Kocuria sediminis FCS-11 | 99 | NR_118222.1 | ||
| Nnr2R11 | 49.2 | Bacillus thuringiensis Bt407 | 100 | NR_102506.1 | ||
| Nnr4N11 | 42.4 | Pseudomonas aeruginosa SNP0614 | 99 | NR_118644.1 | ||
| Nnr3N6 | 42.9 | Deinococcus xibeiensis | 99 | NR_116670.1 | ||
| Nnr1R4 | 44.6 | Sphingobium xenophagum BN6 | 99 | NR_026304.1 | ||
| Nnr3R3 | 43.7 | Janibacter melonis CM2104 | 99 | NR_025805 | ||
| Cold temperate | Cch2R2 | Chlorophytum comosum | 38.2 | Pantoea vagans C9-1 | 99 | NR_102966.1 |
| Cch2R9 | 58.3 | Stenotrophomonas rhizophila e-p10 | 99 | NR_121739.1 | ||
| Cch2N9 | 55.8 | Stenotrophomonas rhizophila e-p10 | 100 | NR_121739.1 | ||
| Cch4R6 | 56.9 | Bacillus cereusATCC 14579 | 99 | NR_074540.1 | ||
| Cch1N3 | 48.3 | Stenotrophomonas rhizophila e-p10 | 99 | NR_121739.1 | ||
| Dch3R8 | Dracaena draco | 45.9 | Bacillus thuringiensis Bt407 | 100 | NR_102506.1 | |
| Dch4R3 | 54.0 | Stenotrophomonas rhizophila e-p10 | 98 | NR_121739.1 | ||
| Och1N4 | Olea europaea | 49.7 | Bacillus subtilis SBMP4 | 100 | NR_118383.1 | |
| Och2R2 | 42.3 | Bacillus thuringiensis Bt407 | 99 | NR_102506.1 | ||
| Och4N12 | 61.2 | Bacillus thuringiensis Bt407 | 100 | NR_102506.1 | ||
| Och2N7 | 51.2 | Erwinia aphidicola X001 | 99 | NR_104724.1 | ||
| Och4N8 | 43.4 | Bacillus cereusATCC 14579 | 99 | NR_074540.1 | ||
| Och4R5 | 51.5 | Stenotrophomonas rhizophila e-p10 | 100 | NR_121739.1 | ||
| Succulents | Asa3N6 | Aloe arborescens | 45.2 | Kocuria turfanensis HO-9042 | 99 | NR_043899.1 |
| Asa1N1 | 45.1 | Kocuria sediminis FCS-11 | 99 | NR_118222.1 | ||
| Bsa3N9 | Beaucarnea recurvata | 52.8 | Bacillus toyonensisBCT-7 112 | 100 | NR_121761.1 | |
| Bsa3N2 | 56.3 | Bacillus thuringiensis Bt407 | 100 | NR_102506.1 | ||
| Bsa3R7 | 56.3 | Bacillus toyonensisBCT-7 112 | 99 | NR_121761.1 | ||
| Msa2R2 | Musa acuminata | 56.3 | Microbacterium oleivorans BAS69 | 99 | NR_042262.1 |
DISCUSSION
In this study, we examined the phyllosphere bacterial community profile of 14 different plants grown under controlled greenhouse conditions. Using this unique experimental design, we were able to find out that the plant genotype was the most important driver determining the phyllosphere microbiome structure and function. Moreover, we discovered that a high proportion of phyllosphere-associated bacteria can produce VOCs, many of which were highly active against the fungal plant pathogen Botrytis cinerea. This supports the functional role of phyllosphere bacteria to defend against pathogens and the finding that phyllosphere microbes have the potential to support health issues in a built environment (Berg, Mahnert and Moissl-Eichinger 2014; Mahnert, Moissl-Eichinger and Berg 2015).
The plant genotype was identified as the most important driver determining the phyllosphere microbiome structure of the 14 indoor plants. All leaves displayed high and individual bacterial diversity; however, at phylum level the composition was very similar. Proteobacteria and Actinobacteria were often reported on phyllospheres (Whipps et al.2008; Redford et al.2010; Zhang et al.2010). However, contrary to most studies where Proteobacteria were reported to be dominant in the phyllosphere (Vorholt 2012; Izhaki, Fridman and Gerchman 2013), the phylum Firmicutes was found to be dominant in the overall sequences of the bacterial community profile of all sampled indoor plants in the greenhouse. There are two potential reasons for the high proportion of Firmicutes: (i) the controlled greenhouse conditions with mainly higher temperatures than outside and (ii) the application of the biopesticide Dipel, consisting of the Bacillus thuringiensis strain. Some Firmicutes members are adapted to higher temperatures and they have the ability to form spores; therefore, they are more present in plant-associated habitats under high temperatures and arid conditions (Köberl et al.2011). The high proportion of OTUs assigned to Bacillus species suggests that Ba. thuringiensis was well established in all investigated leaves. Although this has to be proven by other methods, this can be a result of the frequent application of the biopesticide Dipel in all greenhouses. Until now, only short-term effects of Ba. thuringiensis on the microbial population structure were reported (Raymond et al.2010). Another remarkable observation was the presence of many sequences assigned to Deinococcus-Thermus in all of the plant samples and its high abundance in the phyllosphere of Aechmea eurycorymbus, Nephrolepis cordifolia and Aloe arborescens. Members of this bacterial phylum are known for their ability to tolerate an array of environmental stresses including resistance to UV radiation (Blasius, Hübscher and Sommer 2008) that can enable them to thrive on the hostile phyllosphere environment. These findings support previous studies suggesting that the presence of this bacterial phylum may be more common in the phyllosphere than previously acknowledged (Redford et al.2010; Shade, McManus and Handelsman 2013). The bacterial communities inhabiting the leaves of the 14 ornamentals also showed pronounced interspecies variation within and across different greenhouses. These findings support previous reports of interspecies variability in microbial phyllosphere communities (Whipps et al.2008; Redford et al.2010) and suggest a stronger influence of the plant species on the structure and composition of their associated bacterial communities. Further investigation of plant species effects on the bacterial community composition revealed community assembly patterns driven by plant leaf morphology. Since the characteristics of microbial communities on leaves was based to a large degree on the phenotypic characteristics of the plant that is ultimately controlled by its genetic background (Whipps et al.2008; Cordier et al.2012; Bodenhausen et al.2014), the correlation between leaf morphology and dissimilarity in bacterial assembly implies an effect of the plant genotype on the bacterial community. Thus, in accordance with the previous literature, this study demonstrates the direct influence of the plant host on the phyllosphere microbial community composition correlated to the plant genotype (Redford et al.2010; Cordier et al.2012).
Cultivation-dependent techniques revealed that the phyllosphere of 14 indoor plants harboured bacterial isolates that exhibit antagonistic VOCs activity to both the growth and sporulation of B. cinerea. Remarkable high frequencies of Bacillus spp. that are active VOCs producers were isolated from the phyllosphere of all plant samples. Bacillus spp. has shown VOCs inhibitory effects against a variety of plant pathogens (Fiddaman and Rosall 1993; Islam et al.2012). A study by Islam et al. (2012) on the antagonistic effect of VOCs produced by Ba. subtilis showed that ethyl acetate crude extract and fraction DG4 (an isomer of acetylbutanediol) induced significant inhibition of mycelial growth of diverse pathogenic fungi. Acetylbutanediol was also isolated from Ba. subtilis GB03 and Ba. subtilis IN937a and was found antagonistic to the pathogenic bacteria Erwinia carotovora in Arabidopsis thaliana (Ryu et al.2004), suggesting that these compounds have a wide range of antimicrobial effects. Another remarkable observation was the antifungal VOCs production of Janibacter melonis and Deinococcus spp., bacterial species that are known for their biodegradation potential. Janibacter spp. are capable of degrading aromatic compounds such as pentachlorophenol and dioxins making these Actinobacteria species important for bioremediation of polluted environments (Hiraishi 2003; Yamazoe, Yagi and Oyaizu 2004). Deinococcus spp., on the other hand, has been reported to be one of the phyllosphere colonisers that degrade phenanthrene, a model polycyclic aromatic hydrocarbon that are urban air pollutants (Waight, Pinyakong and Luepromchai 2007). Production of potential biocontrol compounds has been reported on Janibacter spp. The newly discovered tetrahydroquinoline antibiotic, helquinoline, was isolated from J. limosus and J. melonis (Asolkar et al.2004). Tetrahydroquinoline derivatives containing simple or complex substituents are used as antioxidants, corrosion inhibitors, pesticides and pharmaceutical agents (Asolkar et al.2004). Alongside this antibiotic production, J. melonis was also reported to produce active VOCs that are antagonistic to Ralstonia solanacearum, the causative agent of vascular wilt in many crop plants (Achari and Ramesh 2014). However, reports on the biocontrol potential of Deinococcus are still lacking. Thus, the results presented here illustrate the biocontrol potential of Deinococcus and adds as well to the growing knowledge on the biocontrol capability of Janibacter. Aside from the clear defensive effect on their host plants, the volatiles produced by the phyllosphere bacterial colonists are also important for successful establishment of microbial communities. VOCs were postulated as important determinants in shaping epiphytic bacterial communities, since bacteria may produce VOCs that can elicit transcriptional changes in their plant hosts enabling them to control microbial colonisers on their surfaces (Junker and Tholl 2013). In addition, since adhesion and aggregation on the leaf surface is the dominant lifestyle of phyllosphere microbes (Vorholt 2012), long-distance mechanisms for antagonism is vital for their survival. Moreover, these organic compounds can serve as ideal signaling molecules in facilitating both short- and long-distance intercellular and organismal interactions (Bitas et al.2013) due to their ability to move through air spaces (Effmert, Kalderás and Warnke 2012).
Our results provide insights into the structure and function of phyllosphere bacterial communities of plants grown inside a built environment. It was established that the ambient room climate had little influence on the phyllosphere communities, since plant species exhibited high variation of bacterial community composition within and across different greenhouses. This implies that plants have a stable bacterial diversity composition regardless of the room climatic condition. Plant species having higher influences on the bacterial community composition of their associated microbes can be beneficial in establishing a healthy built environment that is ultimately favourable to human health. Research suggests the possibility of influencing a room microbiome by placing certain plant species indoors (Mahnert, Moissl-Eichinger and Berg 2015), which results in an increase of microbial diversity and of beneficial microorganisms (Berg, Mahnert and Moissl-Eichinger 2014). Since epiphytes are capable of degrading compounds that are toxic to plants, humans and the environment (Bringel and Couée 2015), they are also helpful to maintain a healthy indoor air quality in built environments. Both plants placed indoors (Orwell et al.2004; Pegas et al.2012) and their associated microbes work cumulatively in improving the air quality by absorbing, degrading, detoxifying and sequestering air pollutants (Weyens et al.2015). The introduction of plants to built environments has the potential to limit the growth of pathogenic molds and fungi responsible for causing ‘sick building’ syndrome (Strauss 2009), since the phyllosphere bacterial community also includes species that produce antifungal volatiles. It is, however, highly recommended that further chemical analysis on the volatile compounds produced by the bacterial isolates should be executed to help strengthen the suggested implications of this study.
SUPPLEMENTARY DATA
We would like to thank Timothy Mark (Graz) for the proofreading of the manuscript.
FUNDING
This work was supported by a grant of the Austrian Science Fund to G.B. () and by a grant of the Faculty and REPS Development Program of the and the to R.O.
Conflict of interest. None declared.
REFERENCES
