


Abstract
The formation of biofilms and biofouling is a common feature in aquatic environments. The aim of this study was to identify the primary colonizers of biofilm formed in Eastern Mediterranean Coastal water at different seasons and follow early dynamics of biofilm community development. Pre-treated coastal seawater and biofilm samples were collected from six different sampling events of 2 weeks' duration each during 1 year. The microbial community composition and specific abundance were estimated by 16S rRNA gene clone libraries and fluorescence in situ hybridization–confocal laser scanning microscopy (FISH-CLSM), respectively. The biofilm formed over the course of the year was fairly consistent in terms of community composition and overall abundance with the exception of spring season. Alphaproteobacteria (30–70% of total bacteria), in particular Rhodobacteraceae, were the dominant bacteria in the biofilm, regardless of season, followed by Bacteroidetes (5–35%) and Gammaproteobacteria (6–35%). There was a decrease in relative abundance of Alphaproteobacteria and an increase in the abundance of Bacteroidetes between the initial and 2-week-old biofilm. This observation may aid man-made facilities that have to deal with biofilm formation and help the development of appropriate strategies to control those biofilms.
Introduction
Biofouling is a common phenomenon in aquatic environments. Biofilms are formed naturally on flora and fauna (Rao et al., 2005; Egan et al., 2008), sediments (Heijs et al., 2008) and man-made structures such as ships (Candries & Atlar, 2003), pipelines (López et al., 2006), nanofiltration membranes (Ivnitsky et al., 2010) and reverse osmosis membranes (Vrouwenvelder & van der Kooij, 2001). Some of these biofilms can cause costly damages such as corrosion (Al-Malahy & Hodgkiess, 2003), drag force of ships (Candries & Atlar, 2003) and a decrease in desalination process effectiveness (Vrouwenvelder & van der Kooij, 2001). In desalination plants, biofilm can form on various components employed in the process (pipes, holding tanks, membranes) and tremendously increase operational costs, and consequently water prices (Schneider et al., 2005). Therefore, it is important to understand the nature of these biofilms in order to develop optimal operational strategies.
A basic understanding of marine biofilms has been acquired in recent years via culture-independent techniques, including clone libraries and fluorescent in situ hybridization (FISH). The most dominant bacteria on submerged surfaces in the coastal Atlantic and Pacific Oceans were shown to be affiliated with the Alphaproteobacteria class, and in particular the Rhodobacteraceae family, followed by the Gammaproteobacteria class and the Bacteroidetes phylum (Dang & Lovell, 2000, 2002; Jones et al., 2006; Dang et al., 2008). In contrast, Gammaproteobacteria are the dominant bacteria in biofilms formed on pipelines transporting seawater from the Gulf of Mexico (López et al., 2006), as well as on glass slides submerged in estuarine water at East Sabine Bay, Florida (Moss et al., 2006).
The aim of this study was to identify and quantify the primary colonizers responsible for initial biofilm development in Mediterranean coastal seawater over a course of a year. A comprehensive seasonal perspective of biofilm dynamics may help develop tactics that can reduce biofilm formation and henceforth improve operational efficiency of man-made constructions. Recent studies have described the microbial community composition of biofilms from various components of desalination plants. One study suggested that the initial biofilm community was dominated by Gammaproteobacteria, and that the mature community was dominated by Alpha- and Betaproteobacteria (Hörsch et al., 2005). Another study suggested that the Sphingomonas subgroup, which belongs to the Alphaproteobacteria, is the main component in the biofilm (Bereschenko et al., 2010). Whereas those studies focused on one season, the current study evaluated biofilm formation dynamics at different times during 1 year.
Materials and methods
Site description and sample collection
The Palmachim desalination plant is located on the central Mediterranean coast of Israel (about 15 km south of Tel-Aviv). The plant desalinates shallow seawater, close to the shore. To study biofilm formation, a medium pressure (up to 100 psi) biofilm device (Robbins Device, Tyler Research, Edmonton, Canada) was used since it is a convenient apparatus for biofilm formation and sampling. The device was positioned after a 15-μm particle removing pre-filter and before the entry of the water to the RO systems. The device contained 12 sterile glass coupons (1 cm diameter each) later used for microbial community composition and FISH analyses. To investigate the initial community of biofilm at different times of the year, six 2-week experiments were performed between May 2008 and May 2009 with a seawater flow rate of 0.5 m3 h−1 at all experiments. In other marine environments, longer incubation times were selected to investigate mature biofilms (Acuña et al., 2006; Wietz et al., 2009), whereas in the current study 2 weeks' incubation was chosen to estimate the initial biofilm. The length of experiments was determined to fit the growth of biofilms developing in pretreated seawater even in winter conditions. In each experiment, water was sampled once per week and biofilms were sampled after 1 and 2 weeks of flow for microbial community analysis by 16S rRNA gene clone libraries and FISH. Water was also sampled for dissolved organic carbon (DOC), total organic carbon (TOC), total organic nitrogen (TON), and chlorophyll and these analyses were performed by a certified commercial lab (Bactochem, Ness-Ziona, Israel). Temperature was measured once a week, and the data for each month was averaged.
Samples of the planktonic community were collected by filtering 750 mL of the cells collected onto the membrane 0.2-μm polycarbonate membrane (GE Water and Process Technologies) for phylogenetic affiliation analysis using a 16S rRNA gene clone library. For biofilm community composition, glass coupons were removed gently from the medium pressure biofilm device on site and placed in a 15-mL tube. All samples for DNA extraction were stored at −80 °C until further processing. Seawater samples of 50 mL for FISH analysis were fixed in 2% paraformaldehyde overnight and collected on a 0.2-μm polycarbonate membrane (GE Water and Process Technologies). Biofilm samples for FISH analysis were fixed in 4% paraformaldehyde for 4 h. Following fixation, samples were washed with phosphate-buffered saline, pH 7.2 (36% (v/v) of 0.2 M Na2HPO4, 14% (v/v) of 0.2 M NaH2PO4, 0.7% (w/v) of NaCl) for 30 min, and then with double-distilled water for 10 min. The glass coupons were then air dried and kept at −20 °C until further analysis.
DNA extraction and clone library construction and sequencing
DNA extraction was performed using the UltraClean soil DNA isolation kit (MoBio Laboratories, Inc., CA) with minor modifications to the initial step for the biofilm samples. Sterile glass beads and 1 mL extraction buffer were added to 15 mL Falcon tubes containing the glass coupons or membranes. The total developed biofilm on the coupon was used for community analysis. The tubes were vigorously vortexed for 10 min and then centrifuged at 4000 g for 15 min. Supernatants were transferred to 1.5-mL microcentrifuge tubes and the rest of the extraction process performed according to the manufacturer's instructions. The 16S rRNA gene fragments were amplified with the DreamTaq kit (Fermentas, Burlington, Canada) using the general primers 11F (Kane et al., 1993) and 1392R (Lane, 1991). The PCR products were visualized by agarose gel (1%) electrophoresis, and positive samples with an apparent band at c. 1400 bp were used for cloning. PCR products were ligated directly into the pCR2.1 TOPO TA cloning vector (Invitrogen, Inc.), according to the manufacturer's instructions. Ligation reactions were cloned and sequenced by the Genome Sequencing Center at Washington University (St. Louis, MO). A total of 2403 sequences were obtained using the 907R primer (Muyzer et al., 1993).
16S rRNA gene library data analysis
A base-calling analysis was performed on all sequences using bioedit (http://www.mbio.ncsu.edu/BioEdit/bioedit.html). The sequences were aligned with the phylogenetic software package arb (Ludwig et al., 2004). Affiliation was determined according to the location of the aligned sequences in a tree constructed from 500 000 reference sequences (2010 silva database). To determine the similarities among the samples, a neighbor-joining distance matrix with Jackknife correction was constructed and exported into unifrac (Lozupone & Knight, 2005). Percent coverage was calculated by mothur (Schloss et al., 2009). On average, the libraries covered 66% of the diversity in the environment at the 95% similarity level (Tables2 and 3). The sequences determined in this work were submitted to GenBank under accession numbers JF947375 –JF949718.
FISH-CLSM
FISH was performed as described previously (Manz et al., 1992) using the following phylogenetic probes, chosen based on the sequence data obtained from the clone libraries: Alf968 for Alphaproteobacteria (Glöckner et al., 1999), GRb for Rhodobacteraceae (Eilers et al., 2000), CF319a for Bacteroidetes (Manz et al., 1996), Gam42a combined with a competitive unlabeled probe Bet42a for Gammaproteobacteria (Manz et al., 1992) and Pla46 for Planctomycetes (Neef et al., 1998). Non-specific hybridization was tested using the NON338 probe (Wallner et al., 1993). Hybridization was performed for 5 h at 46 °C using 30% (Gam42a and Pla46) or 35% formamide (Alf968, GRb, CF319a, and NON338) in hybridization buffer (0.9 M NaCl, 20 mM Tris-HCl, pH 7.2, 5 mM EDTA, 0.01% sodium dodecylsulfate, SDS). Following hybridization, samples were washed in a wash buffer (20 mM Tris-HCl, pH 7.2, 10 mM EDTA, 0.01% SDS, and NaCl according to formamide percentage; 102 and 80 mM for 30% and 35% formamide, respectively) for 1 h at 48 °C, to remove excess and non-specifically bound probes. The samples were then counterstained with 0.5 ng μL−1 4′,6′-diamidino-2-phenylindole (DAPI) and kept at −20 °C until data collection. Confocal laser scanning microscopy was performed using the Leica SP5 (Leica, Germany). Twenty fields of view were collected for each sample.
FISH-CLSM data analysis
The CLSM files were compiled in the imagej software (http://rsbweb.nih.gov/ij/) and the cells labeled with individual probes were counted with the daime software (Daims et al., 2006). The DAPI images were used for total counts and as verification of the accuracy of the FISH hybridization. For each phylogenetic group, relative abundances (percent of total bacteria) as well as absolute abundances were calculated for each field of view and averaged. Less than 5% of DAPI-stained cells were hybridized non-specifically with the NON338 probe.
Results
Environmental parameters
The Mediterranean coastal seawater exhibited typical temperate (physical and chemical) characteristics throughout the study. Water temperature ranged from about 17 °C during winter to 30 °C during summer, and the spring season was characterized by intermediate temperatures of about 20 °C (Table1). DOC concentrations of the seawater correlated with temperature (r = 0.97, P < 0.05) and were the highest in August 2008 (1801 μM C), when the combination of high temperature and high DOC may have influenced biofilm biomass. These high DOC concentrations were maintained through September 2008 and decreased towards winter, in which the concentration was about 108 μM C. The percentage DOC of TOC changed seasonally. In August 2008, the DOC made up only 50–60% of the TOC, but this percentage increased to c. 100% in September 2008 to January 2009 (Table1). The total organic nitrogen (TON) was in the range of 32–95 μM N throughout the year (Table1) and there was no visible trend with season.
Average temperature, organic carbon (DOC and TOC), and total organic nitrogen (TON) of processed seawater at the different sampling times during the year
The temperature values are averages of the sampling points for each experiment (2–3 weeks).
The DOC, TOC and TON are averages of two to three time points for each experiment (2–3 weeks). Large variations as reflected in the standard deviations are a result of variations between sampling dates within each experiment.
Microbial community composition of seawater and biofilm
In the seawater, a few phylogenetic groups dominated the microbial community, as reflected by 16S rRNA gene diversity. Alphaproteobacteria was the most dominant phylogenetic group on most sampling occasions, comprising 26–48% of the microbial community (Table2). Three additional phylogenetic groups were also abundant in the seawater community and included Bacteroidetes, Actinobacteria and Cyanobacteria (Table2). The highest relative abundance of Cyanobacteria (27%) was detected in August 2008 and the lowest (1%) in March 2009. The lowest abundance of Cyanobacteria coincided with a phytoplankton spring bloom, as indicated by elevated chlorophyll concentration (1.5 mg L−1 in March–April 2008 vs. 0.1–0.5 mg L−1 in other months). During the rest of the year, this group represented 9–15% of the total microbial community. In contrast, the highest relative abundance of Bacteroidetes was observed in March 2009 (23%) and the lowest (6%) in September 2008 (Table2). Actinobacteria was the second most dominant group in the clone libraries during September 2008 (25%) and May 2009 (35%). Less prominent (< 5%) phylogenetic groups detected in the clone library analyses included Betaproteobacteria, Acidobacteria, Chloroflexi, Fusobacteria, Verrucomicrobia, Firmicutes and sequences affiliated with candidate divisions TM6, OD1 and OP3 (Table2).
Microbial community composition of processed seawater as determined by 16S rRNA gene clone libraries. The average (± SD) percentages of three sampling dates in each month are presented. (n.d., not detected). Numbers in parentheses represent number of clones analyzed for each library. Percent coverage was calculated for the 95% similarity level according to 1–(n/N) where n is the number of singeltons and N is the number of clones
Other bacteria = clones that were affiliated with various other bacterial phyla which their overall percentage in the community was below 4%. Some of these groups appeared only once in the entire year. These bacterial groups included Betaproteobacteria, Acidobacteria, Chloroflexi, Fusobacteria, Verrucomicrobia, Firmicutes and bacteria affiliated with candidate divisions TM6, OD1 and OP3.
In the biofilm, several reoccurring trends could be identified during the year. Similar to the seawater, the biofilm microbial community was dominated by Alphaproteobacteria (Table3). In the one week old biofilm 64–78% of the clones at all sampling dates (with the exception of January 2009, 32%) were affiliated with this class. In January 2009 the other dominant phylogenetic group was Gammaproteobacteria, making up 35% of the community. As biofilm matured, the overall percentage of Alphaproteobacteria decreased in May–September 2008 and March 2009 (Table3). This decrease was accompanied by an increase in the relative abundance of Gammaproteobacteria, Bacteroidetes or both. In January, the 1-week-old biofilm was composed of equal amounts of Alpha- and Gammaproteobacteria; as the biofilm matured, the relative abundance of Alphaproteobacteria increased, whereas that of Gammaproteobacteria decreased (Table3).
Microbial community composition (percentages of total amount of clones for each sample) as determined by 16S rRNA gene clone libraries of biofilm formed in Mediterranean seawater at the different sampling times during the year. W1 and W2 represent biofilm age of 1 and 2 weeks, respectively, for each sampling experiment. (n.d., not detected). Numbers in parentheses represents number of clones analyzed for each library. Percent coverage was calculated for the 95% similarity level according to 1–(n/N) where n is the number of singeltons and N is the number of clones
Other bacteria = clones that were affiliated with various other bacterial phyla in which their overall percentage in the community was below 4%. Some of these groups appeared only once in the entire year. These bacterial groups included Betaproteobacteria, Acidobacteria, Chloroflexi, Fusobacteria, Verrucomicrobia, Firmicutes and bacteria affiliated with candidate divisions TM6, OD1 and OP3.
Overall, we could not detect a clear relationship between the biofilm communities by unifrac analysis (Fig.1). The communities sampled in August 2008 and March 2009 were the only two to cluster within themselves, and together made up cluster A (Fig.1). Two other major clusters (B and C) contained communities from various sampling seasons and biofilm ages, and no particular association could be observed. Whereas biofilm samples from either September 2008 or May 2009 could be detected in each of the clusters (clusters C and B, respectively), the communities from May 2008 and January 2009 were spread between clusters B and C, in no particular order.
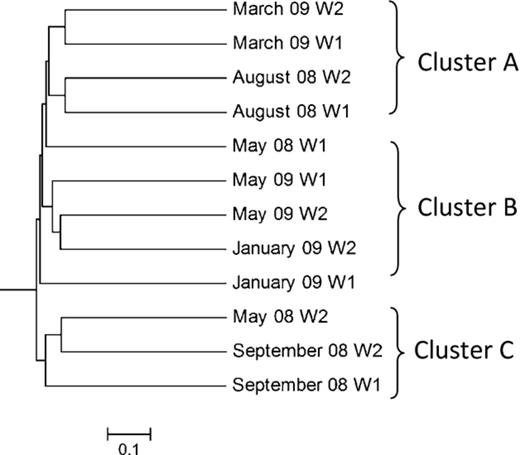
Community similartity dendrogram of biofilm clone libraries by unifrac analysis. W1 and W2 represent 1- and 2-week-old biofilms, respectively. Months and year of each library are indicated.
As mentioned above, Alphaproteobacteria was the most dominant component of the water and biofilm microbial communities. In the water, Rhodobacteraceae and SAR11 were the two major subgroups, comprising 50–90% of all Alphaproteobacteria (Fig.2). In May and August 2008 the percentage of these two groups was similar, in September 2008 and January 2009 SAR11 was the dominant subgroup in the water (50–70%), and in March and May 2009 Rhodobacteraceae became the dominant Alphaproteobacteria group (c. 40%). The Surface 1 cluster (Brown & Fuhrman, 2005) was the most dominant SAR11 clade in the water communities. This group was detected only once as a minor component of 1-week-old biofilm community in January 2009, and was completely absent from all other biofilm communities (Fig.2).
![Relative abundance of Rhodobacteraceae and SAR11 [Surface 1 SAR11 cluster; (Brown & Fuhrman, 2005)] (a) and the Rhodobacteraceae genus CHAB-I-5 (b) in processed seawater and biofilms at the different sampling times during the year. The data from the clone libraries of the water samples were averaged (three consecutive weeks) for each experiment. W, B1 and B2, water, 1- and 2-week-old biofilm, respectively.](https://oup.silverchair-cdn.com/oup/backfile/Content_public/Journal/femsec/85/2/10.1111_1574-6941.12122/2/m_fem12122-fig-0002.jpeg?Expires=1749959206&Signature=If058TWRkghgisjjCgGwsOBt2GHPQyxwQbmCUBtED5Cw9d7Sr7P-L1CdttaQ7BtqKPjq9P7pQaxNJWi6Bpu2RY0kAqlL78Qml3US2u7W2LafzdrPT2zHp8ZmPm6rdYaVzKVWUMCTEiJsbiyU~iRCrFBO~Oz~qYt49LEBwRU3nfMKkp~iI6B9Zs19JKjawdn6gdAMcR21Acst12QHyPgHmcRNg2b~IRfoDiV-VQKG~EmPMkjUzJdRxf~vjNs6t64XigFfojL8JvEmqDUM1Lj8WOrs4LUIjLhYAN8UfNYKhaiXlV9RA46Xi0G807Xp0NN16JLefkHSocWVgCfKAx0zow__&Key-Pair-Id=APKAIE5G5CRDK6RD3PGA)
Relative abundance of Rhodobacteraceae and SAR11 [Surface 1 SAR11 cluster; (Brown & Fuhrman, 2005)] (a) and the Rhodobacteraceae genus CHAB-I-5 (b) in processed seawater and biofilms at the different sampling times during the year. The data from the clone libraries of the water samples were averaged (three consecutive weeks) for each experiment. W, B1 and B2, water, 1- and 2-week-old biofilm, respectively.
In the biofilm, Rhodobacteraceae was the most dominant alphaproteobacterial subgroup (Fig.a2), making up 90% of all Alphaproteobacteria in August and September 2008 in the 2-week-old biofilms (Fig.a2). The lowest (30%) relative abundance of Rhodobacteraceae was detected in a 1-week-old biofilm in January 2009. In the remaining biofilm samples this family represented 40–80% of all Alphaproteobacteria. The Roseobacter genus represented a substantial fraction of the Rhodobacteraceae family, constituting on some occasions the majority of this group in the biofilms (September 2008, March and May 2009) (Fig.a2). The Roseobacter clade CHAB-I-5 made up 10–70% of the Alphaproteobacteria community in biofilm samples collected throughout the year (Fig.b2). The highest percentage of this subgroup was detected in 2-week-old biofilm formed in September 2008, followed by a 1-week-old biofilm in March and May of 2009.
Microbial community composition by FISH
FISH analyses were performed concomitant with clone library analyses on the water and biofilms to quantify the abundance and spatial distribution (biofilm only) of selected microbial groups. For the water samples, hybridization was below detection limits, likely due to a low content of ribosomes in the cells (data is not shown). Consistent with the clone library results, the dominant phylogenetic groups in the biofilm were affiliated with Alphaproteobacteria and Bacteroidetes, which represented 26–70% and 10–50% of the bacterial community (as determined by DAPI), respectively (Fig.3). Gammaproteobacteria made up only up to 10% of the community according to the FISH analysis and on some occasions were below detection limit (Fig.3). The FISH analysis managed to detect over 70% of the DAPI-stained cells with the exception of one, a 2-week-old biofilm formed in May 2009, in which only 50% of the DAPI-stained cells were detected by FISH.
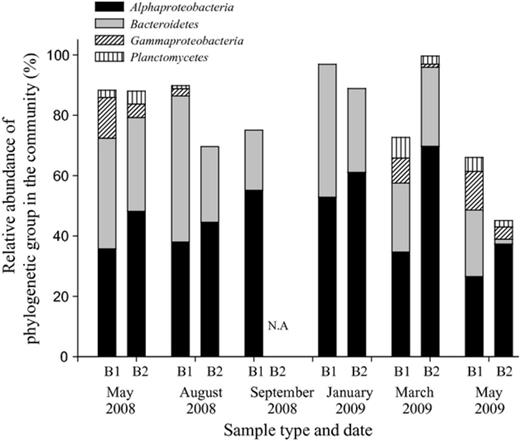
Percentage of the major phylogenetic groups as determined by FISH-CLSM in biofilms sampled from processed seawater at the different sampling times during the year. B1 and B2 refer to 1- and 2-week-old biofilms, respectively. NA, sample not available.
While relative abundance is a common form of presenting FISH data, it is necessary to calculate absolute cell quantities in order to compare the changes in biofilm biomass on an annual basis. In general, the total amount of bacteria per cm2 was in the range of 1–7 × 10⁶ throughout the year (Fig.a4). One exception was documented in the 1-week-old biofilm of March 2009, when the total amount was 3 × 10⁷ bacteria cm−2 (anovaP < 0.0001, Tukey HSD). A similar trend was observed with the specific bacterial groups, with a peak in cell amounts in March 2009. The absolute amount of Alphaproteobacteria (majority of which always belonged to the Rhodobacteraceae) was usually higher than Bacteroidetes at all sampling times (Fig.4b).
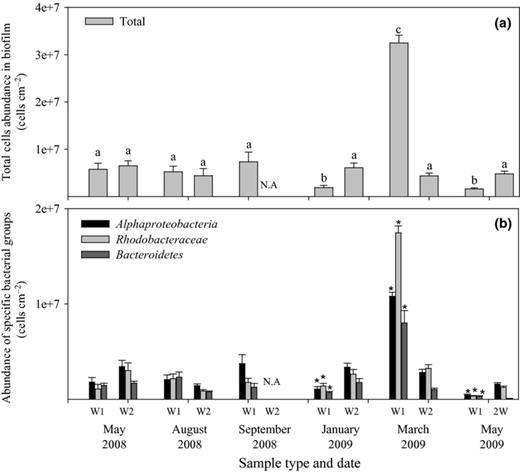
Amount of (a) total bacteria and (b) bacteria in specific groups in the biofilm formed at the different sampling times during the year in seawater as determined by FISH-CLSM. Error bars indicate SE of 20 fields of view. Significantly different total amounts of cells (anova,P < 0.005) are indicated by the letters a, b and c in panel A. The significantly different amounts of bacteria (anova,P < 0.005) within each phylogenetic group are indicated with * in panel B. W1 and W2 represent 1 and 2 weeks of biofilm age, respectively. N.A., result not available.
Discussion
The aim of the current study was to identify and quantify the early bacterial colonizers of biofilms developed in Mediterranean coastal seawater. The majority of the planktonic bacteria in seawater were affiliated with the Alphaproteobacteria, Bacteroidetes, Cyanobacteria and Actinobacteria taxa. Whereas the relative abundance of the first three was typical for marine environments (Giovannoni & Stingl, 2005), the relative abundance of Actinobacteria was unexpectedly high. This discrepancy could be explained by the fact that the water used in the study was pumped close to the shore, which could be affected by terrestrial inputs, as described previously in other environments (Crump et al., 1999; Garneau et al., 2006).
The most important phylogenetic group in the water and biofilms was the Alphaproteobacteria. In the planktonic community, the relative abundance of the SAR11 clade was equal to or higher than that of the Rhodobacteraceae. SAR11 related sequences represented c. 15% of the whole community obtained from the water samples, similar to what was documented in other coastal environments (Rappé et al., 1997, 2000; Crump et al., 1999) but was lower than observed in the Western Mediterranean Sea (Alonso-Sáez et al., 2007) and the world's oceans (Morris et al., 2002). However, bacteria affiliated with the SAR11 clade were almost completely absent from the biofilm communities. This was not surprising, as SAR11 is usually absent from particles and other marine biofilms (Crump et al., 1999; Jones et al., 2006) and generally is considered to be a planktonic group (Giovannoni & Stingl, 2005). Similarly, Cyanobacteria and Actinobacteria, although of significant levels in the water, were also absent from the biofilms.
In contrast, Rhodobacteraceae, and in particular the Roseobacter genus, was the dominant bacterial group in the biofilm, constituting about 25% of the community. The highest fraction of Rhodobacteraceae in the water was detected in March, which could be attributed to a spring bloom that occurred at the time, as suggested by the high chlorophyll level obtained for that sampling time. Roseobacter are known for their close association with algal blooms that produce dimethylsulfoniopropionate (DMSP), which in turn is recycled by various Roseobacter strains (Wagner-Döbler & Biebl, 2006). However, as Rhodobacteraceae were not always abundant in the water, their high relative abundance in the biofilm suggested a selection for certain types of bacteria to settle and form a biofilm. The dominance of Rhodobacteraceae is not unique to the Mediterranean region, and this group has also been identified as a major biofilm component in various locations of the Atlantic and Pacific Oceans (Dang & Lovell, 2002; Jones et al., 2006).
A recent genomic study of an isolated marine Roseobacter, Phaeobacter gallaeciensis, which is a primary colonizer of surfaces, revealed capabilities to produce antibiotics as a mechanism to eliminate potential competitors, as well as the production of siderophores which may aid in scavenging iron from the nutritionally poor environment (Thole et al., 2012). In a recent review, the genomes of various Roseobacter isolates were screened for surface colonization traits (Slightom & Buchan, 2009). A comparison of the 16S rRNA gene sequences retrieved in the current study with some of these isolates indicated phylogenetic similarities and suggested that the Roseobacter community that occupied the biofilm in the current study may have a similar capability.
The Roseobacter strain related to Roseobacter CHAB-I-5 was dominant in the biofilm communities throughout the year. This subgroup composed 10–40% of the entire biofilm community and 10–70% of all Alphaproteobacteria in the biofilms, but comprised only a very low percentage of total bacteria in the water samples. A quantitative analysis of surface water bacterioplankton in the Chesapeake Bay suggested that the overall abundance of this subgroup was low than that of other Roseobacters (Buchan et al., 2009). Although CHAB-I-5-like organisms seem important in biofilm formation in the current study, little is known about them as they have no cultured representatives (Wagner-Döbler & Biebl, 2006) and, as such, cannot be related as yet to any potential function. Further environmental genomic studies, however, may reveal some of its functional traits.
Members of the Bacteroidetes phylum also represented a significant fraction of the bacterial community in the water and biofilm samples. Whereas Alphaproteobacteria made up the majority of the microbial community in the 1-week-old biofilm, the relative abundance of Bacteroidetes increased between week 1 and 2 on most sampling occasions. This suggests that Bacteroidetes may be secondary colonizers. Alphaproteobacteria are known to survive better in poor environments (Alonso & Pernthaler, 2006), as in the case of initial phase of biofilm formation, when the amount of nutrients and organic carbon close to the surface is limiting (Flemming, 2002). In contrast, Bacteroidetes requires higher levels of nutrients and organic matter (Kirchman, 2002; Elifantz et al., 2007), which could be available with biofilm maturation and matrix development. The mature biofilm may include nutritional niches for this group and therefore one can expect a higher abundance of this phylogenetic group in the biofilm (Flemming, 2002). One exception was observed for January 2009, during which Alphaproteobacteria abundance increased with time, whereas that of Bacteroidetes decreased. A possible explanation could be attributed to the low temperature of the seawater. However, the unifrac analysis for community similarities suggested that on most occasions the biofilm community of 2-week-old biofilm was more similar to the 1-week-old biofilm from that period than to other 2-week-old biofilm communities obtained from other periods, indicating that the initial colonization community may determine subsequent community composition.
In addition to the clone libraries, the relative and absolute abundances of the major phylogenetic groups and total bacteria were quantified using FISH-CLSM. As mentioned above, diversity studies only estimate relative abundance, whereas microscopy allowed us to count accurately the actual amount of bacteria in the community. The concentration of bacteria per cm2 in the biofilm formed in seawater was fairly constant at the different sampling times during the year. One exception was noted in March 2009, when the amount of bacteria in the 1-week-old biofilm was 7.5 times higher than in other sampling dates. During this month, there was a phytoplankton bloom typical for this region after winter mixing (Krom et al., 1992). This was also reflected in the higher chlorophyll levels measured during that season, although surprisingly not in the DOC measurements.
In conclusion, this study suggests that overall the dynamics of the initial biofilm formation in Eastern Mediterranean coastal seawater was consistent over a year and may be easy to predict in this type of water in the future. Whereas Rhodobacteraceae are the primary colonizers of surfaces, Bacteroidetes seem to be the secondary colonizers. However, careful attention should be paid to the spring season, in which phytoplankton blooms occur in the region and may affect the microbial community composition dynamics and overall biomass of these biofilms, as suggested by the cell counts in the biofilm developed in the current study. This may be of a particular interest for man-made facilities that use coastal seawater for desalination, industrial water cooling, aquaculture, etc. The information collected in the current and similar studies may aid in developing strategies to eliminate or remove biofilm from these facilities.
Acknowledgements
We would like to thank Lisa A. Waidner, Eddie Cytryn and Linda Popels for their valuable comments on the manuscript. This work was funded by the Ministry of Industry, Commerce and Employment as part as Magnet ‘Maim’ project.
References
