


Abstract
Life in the Taylor Valley, Antarctica, is dominated by microorganisms, with cyanobacteria being key primary producers in the region. Despite their abundance and ecological importance, the factors controlling biogeography, diversity, dispersal of cyanobacteria in Taylor Valley and other polar environments are poorly understood. Owing to persistent high winds, we hypothesize that the cyanobacterial diversity across this polar landscape is influenced by aeolian processes. Using molecular and pigment analysis, we describe the cyanobacterial diversity present in several prominent habitats across the Taylor Valley. Our data show that the diversity of cyanobacteria increases from the upper portion of the valley towards the McMurdo Sound. This trend is likely due to the net transport of organisms in a down-valley direction, consistent with the prevailing orientation of high-energy, episodic föhn winds. Genomic analysis of cyanobacteria present in aeolian material also suggests that wind mixes the cyanobacterial phylotypes among the landscape units. Our 16S rRNA gene sequence data revealed that (1) many of the cyanobacterial phylotypes present in our study site are common in polar or alpine environments, (2) many operational taxonomic units (OTUs) (22) were endemic to Antarctica and (3) four OTUs were potentially endemic to the McMurdo Dry Valleys.
Introduction
By virtue of their pristine nature and the relative lack of confounding effects owing to higher trophic levels, the McMurdo Dry Valleys (MDV) of Antarctica provide a unique landscape for studying microbial dynamics. Despite the apparent simplicity of the system, we know little about the factors affecting organismal distribution in this region (Bahl et al., 2011). Cyanobacteria are known to be one of the most widespread, morphologically distinct and abundant prokaryotes on our planet (Whitton & Potts, 2000). They successfully inhabit many Arctic and Antarctic habitats because they can withstand frequent freeze–thaw cycles, prolonged winter dormancy, persistent low temperatures and high summer solar irradiance (Šabacká & Elster, 2006; Zakhia et al., 2008).
Cyanobacteria are present in many MDV habitats (i.e. exposed soils, glaciers, ephemeral streams and perennially ice-covered lakes) (Broady & Kibblewhite, 2004; Takacs-Vesbach et al., 2010). Their biomass is most conspicuous in glacial streams and lake margins where they often produce thick, cohesive mats (Hawes et al., 2001). These mats are vertically structured with distinct layers containing different pigments, which confer resistance against the effects of UV radiation and photo-oxidation in the austral summer's continuous light regime (Sutherland & Hawes, 2009). Cyanobacteria are important community members of this polar desert because they contribute significantly to in situ net primary productivity (Barrett et al., 2006) and, even though cyanobacteria comprise < 5% of the soil diversity, they play an important role in soil biogeochemistry (Cary et al., 2010). Despite relatively low annual growth rates, slow loss rates lead to organic carbon levels that often exceed 150 g m−2 in these mat communities (Davey, 1993). These communities survive through the dark Antarctic winter, where temperatures can drop to −60 °C, in a freeze-dried state and resume metabolism rapidly with the onset of solar radiation and glacial meltwater in summer (Hawes et al., 1992; Vincent et al., 1993). Soil cyanobacteria are likely derived from the aeolian transport of lake and stream mats to the surrounding soils (Wood et al., 2008). Aeolian processes have also been shown to seed the cyanobacteria that grow within the lake ice itself (Priscu et al., 1998). Strong föhn winds originating from the Polar Plateau are a conspicuous feature in the MDV (Fountain et al., 1999) and have been shown to be responsible for redistribution of large amounts of abiotic and biotic particles across the valley landscape (Šabacká et al., 2012).
Most cyanobacteria isolated from polar environments are not true psychrophiles, but rather psychrotolerant organisms that can survive cold temperatures, but grow faster at temperatures above 20 °C (sensu stricto Morita, 1975; Nadeau & Castenholz, 2000). Their psychrotolerant nature has led many scientists to hypothesize that these cyanobacteria originated in temperate climates. Molecular-based studies of antarctic cyanobacteria have already revealed a potentially large degree of endemism despite the organisms’ tendencies towards pyschrotolerance (Taton et al., 2006a; Namsaraev et al., 2010).
Despite their ubiquity and ecological importance in the MDV, the factors regulating biodiversity at the landscape scale remain unknown (Taton et al., 2006b; Wood et al., 2008; Namsaraev et al., 2010). The overall goal of our study was to describe genetic and pigment diversity of cyanobacteria from the mosaic of habitats across the Taylor Valley landscape. Our genetic analysis also compared Taylor Valley cyanobacteria with previously described cyanobacteria from other polar and alpine regions to assess the degree of endemism. Owing to the strong and persistent winds that transport sediment and associated organic matter (OM) across the MDV, we hypothesize that the distribution and diversity of cyanobacteria across this polar landscape are influenced, to a large degree, by aeolian processes.
Materials and methods
Study area
The MDV are located in Southern Victoria Land, Antarctica (Fig. 1). The McMurdo Sound bounds the valleys to the east and the East Antarctic Ice Sheet to the west. The average annual temperature is approximately −17 °C, and mean annual precipitation is below 50 mm year−1 water equivalent (Fountain et al., 2009). The MDV have been largely ice free since at least the mid-Miocene (Lewis et al., 2008), and more than 95% of the valley bottom is covered by permafrost (Burkins et al., 2001). Major landscape features include perennially ice-covered lakes, ephemeral streams and glaciers. Taylor Valley (77°S, 163°E) is a steep-walled coastal valley extending 33 km from the Taylor Glacier to the McMurdo Sound coastline in a SW–NE direction (Fountain et al., 1999). It has three closed drainage basins containing Lakes Fryxell, Hoare and Bonney (Lyons et al., 2000). During the austral summer, melt from the surrounding glaciers supply water to ephemeral streams that carry nutrients into these lakes, while moistening nearby soils (Fountain et al., 1999). Strong föhn winds (up to 40 m s−1) originating from the Polar Plateau are common in the Taylor Valley (Nylen et al., 2004) and move large quantities of soil and associated microorganisms onto lake ice (Priscu et al., 1998) and glaciers (Foreman et al., 2007) in addition to a redistribution of soils in the direction of the prevailing föhn winds (Šabacká et al., in press).
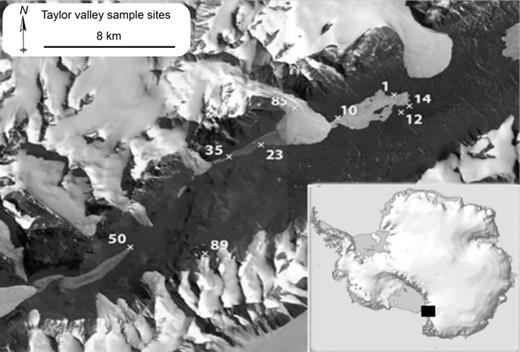
Map of Taylor Valley with marked sampling sites: 1 and 10: Lake Fryxell mat from lake ice; 12: Fryxell basin soil; 14: Fryxell aeolian material; 23: Hoare aeolian material; 35: Lake Hoare ice sediment; 50: Bonney stream mat; 85: Canada Glacier sediment; 89: Marr Pond mat. Insert shows area of detail in black square with respect to the Antarctic continent. Map prepared by Brad Herried, Polar Geospatial Center. A 2.4 m QuickBird imagery ©DigitalGlobe, Inc. Provided by NGA commercial imagery program. Insert: Courtesy of Australian Antarctic Division © Commonwealth of Australia 2006.
Sampling
Nine samples representing conspicuous cyanobacterial habitats were collected from Taylor Valley during the austral summers of 2006–2007 (Fig. 1, Table 1). Samples were collected in sterile WhirlPack® bags using sterile spatulas and laboratory gloves. Wind-blown material was collected from aeolian sediment traps that were deployed in the Fryxell and Hoare basins (Nkem et al., 2006; Šabacká et al., in press). All samples were stored at −20 °C in the dark until analysis at Montana State University (typically within 6 months).
Physical and chemical composition of each sample
| ID | Location and Habitat | WC (%) | OM (% dw) | PC (% dw) | PN (% dw) | TP (% dw) |
| 1 | Fryxell lake ice mat | 10.7 | 38.8 | 20.5 | 1.29 | 0.036 |
| 10 | Fryxell lake ice mat | 9.85 | 44.5 | 36.6 | 1.96 | 0.054 |
| 12 | Fryxell soil | 0.740 | 0.880 | 0.045 | 0.002 | 0.001 |
| 14 | Fryxell aeolian sed. | 0.150 | 0.450 | 0.023 | 0.002 | ND |
| 23 | Hoare aeolian sed. | 0.150 | 0.230 | 0.011 | 0.001 | ND |
| 35 | Hoare lake ice sed. | 13.7 | 0.240 | 0.013 | 0.001 | 0.001 |
| 50 | Bonney stream mat | 5.41 | 1.340 | 0.507 | 0.035 | 0.020 |
| 85 | Canada Glacier sed. | 1.79 | 0.330 | 0.127 | 0.016 | 0.009 |
| 89 | Marr Pond mat | 54.8 | 11.9 | 9.69 | 0.652 | 0.017 |
ND, not detected (< 0.001%).
Thawed (4 °C in the dark) soil, aeolian, glacier and lake ice sediment samples were fractioned into three size classes: coarse/medium sand (> 250 μm), fine sand (63–250 μm) and silt and clay (< 63 μm), using sterile soil sieves. Gravimetric moisture (WC – water content) was determined from the mass loss at 105 °C after 48 h. OM content was determined as the difference between dry weight (dw) and weight of samples after combustion at 550 °C for 4 h. Particulate organic carbon (PC) and particulate organic nitrogen (PN) were determined for each size fraction using a Thermo Finnigan Flash 112 EA elemental analyser and expressed as milligram of PC or PN per g of dry weight. Sediments were fumed over concentrated HCl before analysis to remove inorganic carbon. Total particulate phosphorus (TP) was determined on combusted (550 °C for 4 h) samples extracted in 1 N HCl following Saunders & Williams (1955) as modified by Walker & Adams (1958) and Olsen & Sommers (1982).
Clone libraries and sequencing
DNA was extracted from ~ 0.5 g of each mat sample or ~ 1.5 g of soils, aeolian sediments, glacier or lake ice sediment (silk/clay fraction size only) using MoBio PowerSoil® and PowerMax® Soil DNA Isolation kits following the manufacturer's instructions. The 1183-bp-long portion of the 16S rRNA gene and internal transcribed spacer were amplified using cyanobacterial-specific PCR primers: 16S378F (5′-GGG GAA TTT TCC GCA ATG GG-3′) and 23S30R (5′-CTT CGC CTC TGT GTG CCT AGG T-3′) (Taton et al.,2003). The PCR was run with an initial denaturation incubation of 2.75 min at 94 °C, which was followed by 30 cycles of 45 s at 94 °C, 45 s at 56 °C and 1 min at 72 °C. The reaction was concluded with an elongation step of 1.5 min at 72 °C.
Cloning of the PCR product was carried out with a TOPO TA cloning kit (Invitrogen, Carlsbad, CA). PCR products were ligated into the PCR 2.1 vector and transformed into chemically competent Escherichia coli (supplied with the kit) according to the manufacturer's instructions. Putative positive colonies of E. coli carrying the cloned PCR product (identified by their inability to hydrolyse X-Gal) were picked from the plates and resuspended in 0.5 mL of Luria-Bertani (LB) medium and 0.5 mL of sterile 80% glycerol. Glycerol stocks were frozen at −80 °C and purified and bidirectionally sequenced by Functional Biosciences Inc. (Madison, WI) using sequencing primers M13 forward and M13 reverse. Clone sequences have been deposited into GenBank under accession numbers JN814118–JN14368.
Sequence processing
DNA sequences were cut between the end of the pUC plasmid and the 5′ end of the amplification primer (16S378F) and then again 500 bp downstream of the primer (359–859, E. coli 16S gene position). This yielded a 500-bp fragment of the 16S rRNA gene sequence. The 500-bp length was chosen as a conservative point for sequence trimming. Trimming the sequences in this manner led to Quality Scores > 40, indicating high-quality sequence data (Paegel et al., 2002). All sequences were aligned using default parameters of clustalw in mega version 4 (Tamura et al., 2007). Chimera check and Bellerophon in the program mothur (Schloss et al., 2009) were used to identify and eliminate chimeric sequences within the libraries.
Clustering clones into operational taxonomic units
Cyanobacterial taxonomy is complicated because lineage nomenclature is derived from both botanical (ICBN) and bacteriological coding (ICNB) (Oren, 2004) coupled with the fact that Ward et al. (2008) contend that there is no universal species definition for cyanobacteria. The 16S rRNA gene sequences we obtained were grouped into operational taxonomic units (OTUs) using mothur software (Schloss et al., 2009). An OTU was defined as a group of sequences that exhibit ≥ 98% similarity to each other, using the average neighbour algorithm. A representative sequence for each OTU was determined by mothur software as the sequence that has the minimum distance from all other sequences within the same OTU (Schloss et al., 2009). α and β diversity indexes (Shannon–Weaver and Bray–Curtis, respectively), and rarefaction curves were also computed for each sample using mothur. Coverage index was calculated to determine the amount of diversity detected in clone libraries compared to total diversity in the sample (Good, 1953). Closest relatives (cultured and uncultured) and phylogenetic affiliation of the obtained sequences were determined using blastn (http://blast.ncbi.nlm.nih.gov) to query the nonredundant/nucleotide (nr/nt) database. OTUs were assigned taxonomical names from cultured GenBank relatives with the highest sequence similarity. The Bray–Curtis index (Bray & Curtis, 1957) was used to describe pairwise similarities, such that all sample site pair comparisons were tested between cyanobacterial assemblages. These measurements of community structure were tested for correlation against a matrix of pairwise geographical distances between samples using a Mantel test with Monte Carlo permutation (9999 permutations) in the program R with package ade4 (R Development Core Team, 2009).
OTUs were further classified into four groups: ‘temperate’, ‘cold-adapted’, ‘Antarctic’ and ‘MDV’. Temperate OTUs were sequences possessing ≥ 98% 16S rRNA gene similarity to a sequence from a temperate habitat. Cold-adapted OTUs were characterized as those that exhibited ≥ 98% 16S rRNA gene similarity with GenBank sequences from Arctic, Antarctic or Alpine environments but not with sequences from temperate or tropical regions. Antarctic OTUs were characterized as those that exhibited ≥ 98% 16S rRNA gene similarity with GenBank sequences only from Antarctica and not from any other region (Jungblut et al., 2010). Lastly, MDV OTUs were described as sequences with ≥ 98% 16S rRNA gene similarity to cyanobacterial sequences recovered from the MDV only.
Community composition analysis was conducted using mothur (Schloss et al., 2009) and UniFrac (Lozupone et al., 2006). The chloroplast sequences (OTUs 46 and 49) were omitted from the community analysis. Briefly, the UPGMA algorithm in the program mothur was used to describe similarities in community composition, resulting in an output file suited for UniFrac analysis. Weighted and normalized Fast UniFrac analysis was run using the mothur output and the sequences annotated by environmental type (habitat and location), with OTU abundances taken into account using the UniFrac significance test. The UniFrac algorithm provided an estimate of the phylogenetic distance among the samples (Lozupone et al., 2006).
High-performance liquid chromatography (HPLC) pigment analysis
Concentrations of photosynthetic and photoprotective pigments were measured in 90% aqueous acetone extracts. The acetone solution (10 mL) was added to known weights of sample (~ 0.5 g of mat and ~ 5 g of soil, aeolian material, lake ice and glacier sediment), vortexed vigorously for 2 min and stored in the dark at 4 °C for 16 h to extract hydrophobic pigments. Following extraction, the samples were centrifuged, and the supernatant was transferred to cryovials and frozen at −80 °C. A Varian 9012 HPLC system was used to measure pigments in the extracts using the method described by Bidigare et al. (2005). Briefly, pigments were separated on a reverse-phase Waters Spherisorb® 5-μm ODS-2 (4.6 × 250 mm2) C18 column with a corresponding guard cartridge (7.5 × 4.6 mm2) and a Timberline column heater (26 °C) (Bidigare et al., 2005). Individual pigments were transferred to dual-wavelength UV/VIS spectrometer (SpectraSYSTEM Thermo Separation Products UV2000 with FL2000 detectors) for characterization. Pigment identification was based on absorbance spectra, co-chromatography with standards, and relative retention times. Peak identity was determined by comparing retention times with a chlorophyll-a standard and representative culture extracts. Spectra-Physics WOWs software was used to calculate peak areas (Rii et al., 2008).
Concentrations of different pigments were normalized to chlorophyll-a and subjected to Ward's hierarchical clustering using the pvclust package in R (R Development Core Team, 2009). Approximately unbiased (AU) P-values were calculated via multiscale bootstrap resampling (Suzuki & Shimodaira, 2006) for each cluster. A redundancy analysis was performed using the program canoco to relate abundances of different cyanobacterial genera (based on OTU frequencies) to pigment concentrations and environmental characteristics (habitat and location) of their observation (ter Braak & Šmilauer, 2002).
Results
Physical and chemical characteristics
Samples of soil, aeolian material, lake ice sediment and glacier sediment were composed primarily of abiotic particles and contained little (< 1% per unit dry weight; dw) OM (Table 1). The OM content of microbial mats was 11.9–44.5% of the dry weight of the sample. The only exception was the Bonney stream mat, which contained only 1.34% OM. WC varied greatly among the samples (0.15–54.81%) and was influenced by the bulk water present in the habitat at the time of sampling. Samples of aeolian material, lake ice sediment and soil contained similar amounts of PC (0.011–0.045% dw), PN (0.001–0.002% dw) and TP (< 0.001–0.001% dw). The glacier sediment sample was richer in organic material, containing 0.127% PC, 0.016% PN and 0.009% TP, on a dry weight basis. Lake ice mats and pond mats had on average 2–3 orders of magnitude more PC, PN and TP per unit dw compared to all the other habitats (PC = 9.69–36.6% dw, PN = 0.652–1.96% dw and TP = 0.017–0.054% dw).
Cyanobacterial diversity
A total of 249 clones were sequenced from the nine Taylor Valley habitats. We were able to obtain only nine high-quality sequences for sample 1 (Fryxell lake ice mat 1), which covered only 33% of the total cyanobacterial diversity (Table 2); hence, we did not include this sample in our detailed statistical analyses. The 249 clones corresponded to 71 unique OTUs defined at 0.02 distance cut-off (98% 16S rRNA gene similarity). Rarefaction curves revealed that > 96% of the OTUs were accounted for by our cloning efforts for the Fryxell aeolian sediment (sample 14) and Bonney stream mat (sample 50) samples (Fig. 2). Coverage index for all samples indicated that 71.4–100% of the population was sampled (Table 2), so our cyanobacterial diversity may be underestimated for some of these samples.
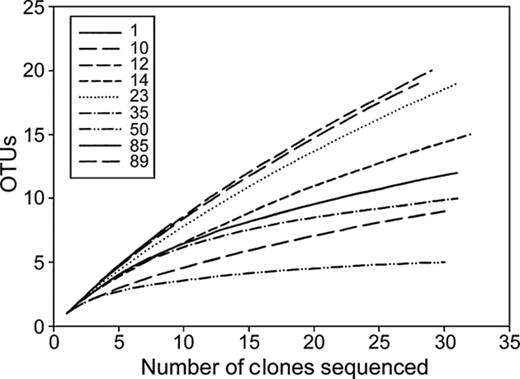
Rarefaction curves describing the dependence of discovering novel OTUs as a function of sampling effort for OTUs defined at 0.02 distance cut-off.
Measures of α diversity for Taylor Valley samples and distribution of clones (%) across the different taxonomical orders of cyanobacteria (Chroococcales, Oscillatoriales and Nostocales)
An OTU was defined at 98% similarity using average neighbour algorithm. OTU signifies the number of OTUs observed, H′ characterizes Shannon–Weaver diversity index, and C characterizes coverage index.
Coverage index (Good, 1953) was calculated as C = [1 − (n/N)] × 100, where n is the number of OTUs composed of a single clone and N is the number of clones.
The largest number of OTUs (25) occurred in aeolian material from the Hoare basin (sample 23; Table 2). A large number of OTUs (19) were identified mat samples from Lake Fryxell ice cover. The Hoare lake ice sediment, Bonney stream mat and Marr pond mat all had fewer than 10 OTUs. The Shannon–Weaver diversity index (H′) varied from 0.70 to 3.08 among the samples (Table 2). The highest diversity was observed in samples of Hoare aeolian material (H′ = 3.08), Fryxell lake mat (H′ = 2.78) and Fryxell soil (H′ = 2.54). The lowest diversity (H′ = 0.70) was observed in samples of Bonney stream mat, which contained only four OTUs, all belonging to the order Oscillatoriales (Table 2). Hoare lake ice sediment contained no unique OTUs, Fryxell aeolian sediment and Marr pond mat each contained only one OTU unique to those samples, whereas the remainder of the samples had 36–87% unique OTUs (Table 2). Of all 71 OTUs, no OTUs were observed across all samples.
Unifrac cluster analysis, based on the weighed abundances of OTUs, grouped all samples into two distinct clusters (Jackknife value > 99%). The first cluster contains all three samples from Fryxell basin and a sample of Marr pond mat. The second cluster contained samples of Bonney stream mat and a subcluster consisting of glacier sediment, aeolian sediment and lake ice sediment from Hoare basin (Fig. 3a).
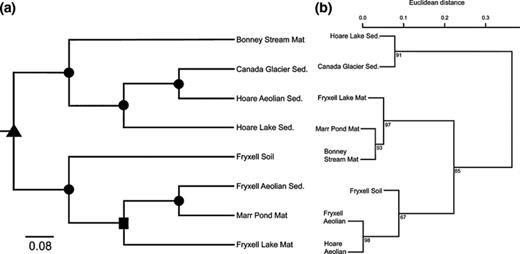
(a) Cluster analysis of the eight sample sites as reported using the 16S rRNA gene. The scale bar represents UniFrac units, in which a distance of 0 represents the two environments are identical and a distance of 1 represents the two environments contain mutually exclusive lineages. The tree was developed from an environment distance matrix, which was calculated using UniFrac, normalized abundance weights, and the unweighted pair group method with arithmetic mean (UPGMA). Nodes are supported by Jackknife values such that, ▲, > 99%; &bull1;, 70–90% and ◼, 50–70%. (b) Ward's hierarchical clustering based on the normalized concentrations of different photosynthetic and protective pigments. Node values represent approximately unbiased (AU) P-values calculated via multiscale bootstrap resampling (Suzuki & Shimodaira, 2006). Values > 95 are significant at α = 0.05.
Bray–Curtis dissimilarity index (BCij), varied from 0.74 to 1.0 between samples, where 1 denotes that the two samples shared no OTUs (Fig. 4). The highest similarity was between Hoare lake ice sediment and Canada Glacier sediment (BCij = 0.74), and Fryxell soil and Fryxell aeolian material (BCij = 0.76). Mantel statistics revealed a strong, positive correlation (r = 0.92, P = 0.0002) between similarity of cyanobacterial community composition and geographical distance (Fig. 4).
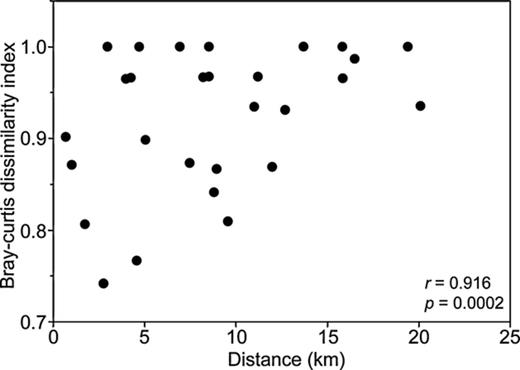
Distance–decay relationships in the eight Taylor Valley samples. Pairwise dissimilarities (Bray–Curtis index) are plotted as a function of the distance between the samples. Statistics were derived using a Mantel test with Monte Carlo permutation.
Cyanobacterial taxonomy
A total of 17.5% of the sequences obtained from the clone libraries had < 97% 16S rRNA gene similarity to public gene database libraries, suggesting the presence of, as yet, uncharacterized cyanobacteria. Seventy-three per cent of the clones (62% of all identified OTUs) were related to the cyanobacterial order Oscillatoriales, 14% of clones (20% of OTUs) belonged to the order Nostocales, and 13% of clones (17% of OTUs) were related to the order Chroococcales (Table 2, Supporting Information, Table S1). The OTUs corresponded to 10 known cyanobacterial genera. The most frequent phylotypes were sequences related to Phormidium (34% of clones) and Leptolyngbya (15% of clones), both belonging to the order Oscillatoriales. Phormidium sequences were identified in all samples with the exception of Bonney stream mat (Fig. 5). Other common, but not abundant, sequences grouped with Chamaesiphon (8%), Nostoc (5%) and Tyconema (3%) (Table S1).
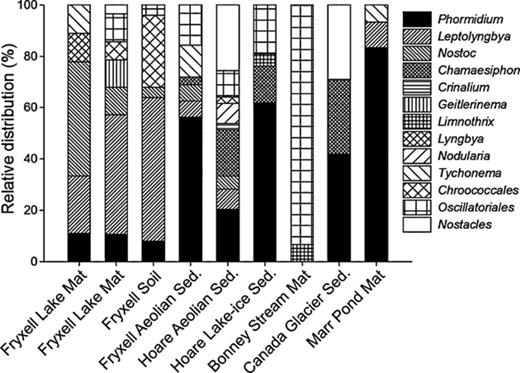
Relative distribution (%) of different cyanobacterial genera within Taylor Valley habitats. Clones that had < 95% 16S rRNA gene similarity to a cultured representative were identified by the respective order.
Many (86%) of the OTUs could be characterized as cold-adapted because they corresponded to GenBank sequences (98% similarity threshold) which were isolated from Arctic, Antarctic or alpine environments. Almost half (48%) could be characterized as Antarctic because they corresponded to no GenBank sequences from other geographical regions at the 98% similarity threshold. One-third (33%) of these ‘Antarctic’ OTUs had 98–100% sequence similarity to GenBank sequences from the MDV. Among these were sequences from lake mats in Taylor Valley, lake ice from Victoria Valley, lake mats from Miers Valley, surface rock mats from McKelvey Valley and river sediment from Wright Valley (Mosier et al., 2007; Wood et al., 2008; Pointing et al., 2009).
HPLC pigment analysis
Nine photosynthetic and photoprotective pigments were identified using HPLC. Pigments that were not detected in any of the samples were chlorophyll-c, diatoxanthin, diadinoxanthin, peridinin, prasiloxanthin, violaxanthin and alloxanthin (Table 3). Chlorophyll-b was measured in samples from all habitats except soils and aeolian material. The least diverse samples with respect to pigment distribution were samples of Fryxell soil and Hoare aeolian material that contained only chlorophyll-a and cantaxanthin. Fryxell aeolian material contained those same two pigments as well as traces of β-carotene. Neoxanthin and violaxantin were present in Hoare Lake ice sediment only. Fucoxanthin was present in Canada Glacier sediment only. Total carotenoids/chlorophyll-a ratios were very low for samples of Fryxell and Hoare aeolian material (0.003 and 0.001) and Fryxell soils (0.068). The other five samples had carotenoids/chlorophyll-a ratios between 0.111 and 0.208.
Photosynthetic and photoprotective pigments from habitats sampled and normalized to chlorophyll-a
| Pigment | FRX lake mat | FRX soil | FRX aeol. | HOR aeol. | HOR lake sed. | BON str. mat | CAN glac. sed | Marr pond mat |
| Fucoxanthin | ND | ND | ND | ND | ND | ND | 0.022 | ND |
| Neoxanthin | ND | ND | ND | ND | 0.016 | ND | ND | ND |
| Violaxantin | ND | ND | ND | ND | 0.01 | ND | ND | ND |
| Lutein | ND | ND | ND | ND | 0.053 | ND | 0.037 | 0.005 |
| Zeaxanthin | 0.035 | ND | ND | ND | ND | 0.004 | ND | 0.016 |
| Canthaxanthin | 0.073 | 0.068 | 0.002 | 0.001 | 0.041 | 0.080 | 0.070 | 0.108 |
| Chlorophyll-b | ND | ND | ND | ND | 0.187 | ND | 0.122 | ND |
| β-carotene | 0.053 | ND | 0.001 | ND | 0.017 | 0.083 | 0.018 | 0.079 |
| Total carotenoids | 0.161 | 0.068 | 0.003 | 0.001 | 0.111 | 0.167 | 0.147 | 0.208 |
ND, not detected.
The hierarchical clustering based on the concentration of the pigments, normalized to chlorophyll-a, grouped samples into three clusters (Fig. 3b). The first cluster contained Hoare Lake sediment and Canada Glacier sediment samples. All three mat samples grouped in the second cluster (AU = 97%), whereas the two samples of the aeolian material, which had very similar pigment composition (AU = 98%), clustered with the sample of Fryxell soil. A redundancy ordination diagram shows a graphical display of cyanobacterial genera and pigment distribution within different habitats and locations in Taylor Valley (Fig. 6). It is important to note that these pigment ratios are a function of the physiological state of the organisms within each respective habitat.
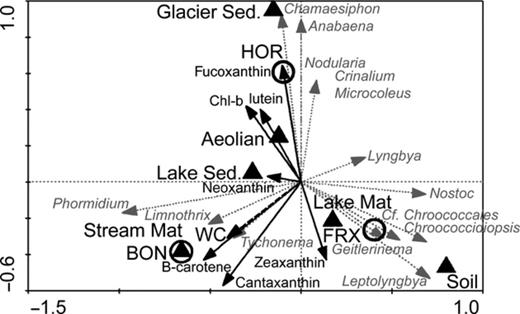
Redundancy analysis, relating the abundances of different cyanobacterial genera (grey dotted arrows) to their habitat – black triangle (lake ice mats, stream mats, aeolian material, lake ice sediment, glacier ice sediment and soil), location – open circles (Fryxell, Hoare and Bonney), pigment concentrations (solid black arrows) and WC (dashed black arrow). The model explained 100% of the variability among the samples. The direction of the arrows in the ordination diagram indicates the direction of maximum change in each variable. The length of the arrow indicates how much the genera distribution changes along that explanatory variable. lake mat, Lake ice mats; str mat, stream mats; aeolian, aeolian sediment; lake sed, lake ice sediment; glac sed, glacier sediment; FRX, Fryxell basin; HOR, Hoare basin; BON, Bonney basin; WC, water content.
Discussion
Cyanobacterial diversity in Taylor Valley
Analysis of 16S rRNA gene sequences from different habitats enabled us to determine the spatial distribution and diversity of cyanobacteria across Taylor Valley landscape units. Our data revealed that numerous cyanobacterial phylotypes (defined at 98% genetic similarity) existed within each of the Taylor Valley habitats studied (Table 2). Coverage index indicated that sampling was near-complete (96.7–100%) for the up-valley samples and relatively undersampled (71.4–96.9%) in the down-valley samples; the actual number of cyanobacterial phylotypes present in some of these habitats is likely higher. Rarefaction analyses of clone libraries from this study (Fig. 2) and other studies also indicate that most Antarctic microbial habitats and regions remain undersampled (Takacs-Vesbach et al., 2010; Vyverman et al., 2010). We identified a total of 71 OTUs from the nine Taylor Valley sample sites. A recent review of GenBank sequences reveals there are 42 cyanobacterial phylotypes known from Antarctica (Namsaraev et al., 2010). Although our definition of an OTU differed slightly from that used by Namsaraev et al. (2010) (98% compared to 97.5% genetic similarity threshold), our results reveal that the MDV habitats harbour some of the richest and most diverse cyanobacterial assemblages in Antarctica. The criteria for defining an OTU varies among authors, but published values are typically within 1.0% of our selected cut-off value (Bhaya et al., 2007; Caro-Quintero & Konstantinidis, 2011).
The Antarctic coastal regions between the latitudes 70° and 80°, which includes the MDVs, have been shown by others to be the richest in terms of both bacterial and cyanobacterial diversity (Yergeau et al., 2007; Namsaraev et al., 2010). The high diversity may be a function of proximity to McMurdo Sound, which brings moisture and nutrients into the valleys, regional glacial melt, which provides an intermittent source of liquid water to the MDVs, and strong föhn winds that can concentrate OM near the coast. The rich diversity of cyanobacteria we measured in Taylor Valley was not homogenous and apparently subject to prevailing wind conditions, environmental selection and geographical location within the valley.
Cyanobacterial diversity across the Taylor Valley landscape units
The MDV harbour a rich diversity of Cyanobacteria, which is distributed among several habitat types. Taylor Valley contains three distinct basins (Bonney, Hoare and Fryxell). These basins are demarcated by two major glaciers (Suess and Canada) that flow across the valley floor. Aeolian sediment in the Taylor Valley is primarily transported from Bonney basin (SW) towards Fryxell basin (NE) via strong south-westerly föhn winds (Šabacká et al., in press). Cluster analysis shows that microbial assemblages group by basin despite the variety of habitat types sampled (Figs 3a and 6). The cyanobacterial assemblage present in the aeolian sediment from Hoare and Fryxell basins nests with samples from each respective basin. The inclusion of the aeolian material sample within its respective basin clade indicates that organisms are mixed between habitat types via wind, within a basin. On the landscape scale, OTUs from Bonney basin are found down valley, but not all OTUs from Fryxell basin are found up valley, which suggests net dispersal in the direction of the föhn winds. Interbasin aeolian transport and intrabasin mixing may be occurring, but we believe the basins are sufficiently different (Barrett et al., 2006) to create basin-specific assemblages shown in Figs 3a and 6.
Without the passive microbial dispersal mechanism of higher organisms in the MDVs (e.g. birds, Hubálek, 2004), wind becomes the dominant means of transporting OM and microorganisms throughout the MDV (e.g. Nkem et al., 2006; Šabacká et al., in press). Our data reveal that high-energy föhn winds in the MDV mobilize the up-valley soil and associated cyanobacteria and deposit them on the surface of the permanently ice-covered lakes, glaciers and down valley soils. The physical transport of cyanobacteria via wind allows for redistribution of cyanobacterial taxa to new and potentially more favourable environmental conditions. Cyanobacteria and bacteria in sediment landing on ice-covered lakes reactivate in meltwater pockets as the sediment slowly melts through the ice during the summer (Priscu et al., 1998). Eventually, the sediment migrates through ice cracks (Jepsen et al., 2010) and the accompanying cyanobacteria are introduced into the lake ecosystem.
A significant (P < 0.0002, Fig. 4) correlation existed between pairwise dissimilarities and geographical distance for Taylor Valley phylotypes. This correlation supports distance–decay theory (Morlon et al., 2008; Bell, 2010), in that community dissimilarity increases as geographical distance increases. The slope of distance–decay curve reflects the rate at which OTU richness will increase with increased sampling area, or the species–area relationship, which indicates that species richness will increase with area (Green et al., 2004). The species–area relationship holds true for the Taylor Valley cyanobacteria assemblages, where diversity increases in the down-valley direction. The application of distance–decay relationships within Taylor Valley is constrained by the spatial extent of our sampling and, ultimately, by the Polar Plateau to the west and McMurdo Sound to the east.
In addition to analysing assemblages based on 16S rRNA gene relationships, we used pigment composition to determine the phenotypic diversity of cyanobacteria in the same landscape units of Taylor Valley. Habitat composition based on pigment diversity and abundance showed that assemblages clustered according to habitat type (Figs 3b and 6). Besides being a taxonomic trait, pigment content also reflects physiological state and acclimation to specific environmental conditions in a given habitat. The pigment data reveal that soils and aeolian material were inhabited by diverse cyanobacterial communities (> 20 OTUs) with few eukaryotic algae present. Conversely, the microbial mats and glacier and lake ice sediments contained pigments typical of microalgae, which are more abundant in the MDV environments with relatively consistent liquid water (Takacs-Vesbach et al., 2010). Therefore, cyanobacterial assemblages from analogous habitats, but different basins, have similar pigmentation to persist in comparable habitat types.
Endemism
Conclusions concerning the endemicity of organisms in Antarctica and the MDV should be approached with caution as sampling of temperate regions is not complete (Fernandez-Carazo et al., 2011). Given this caveat, endemism is evident within the cyanobacterial communities of the MDV when compared to the taxa currently in databases. We used database mining to compare phylotypes detected in this study to previously reported taxa from alpine, arctic, antarctic or temperate locations. In most instances, the sequences obtained in our study were more closely related to an uncultured clone rather than a cultured representative (Table S1). A 1% divergence in the 16S rRNA gene is equal to isolation or reduced genetic exchange for < 10 million years (Ochman et al., 1999; Jungblut et al., 2010); thus, the 16S rRNA gene is highly conserved and thought to underestimate the number of endemic species in a given habitat (Cho & Tiedje, 2000). Some clones in the public database did possess sequences related to those in the MDV or Antarctic but were < 98% similar in sequence identity. Those sequences that were ≥ 98% similar to MDV-only sequences allowed us to conclude that four OTUs may be endemic to the MDV region and 22 OTUs endemic to the continent of Antarctica. It is noteworthy that Fernandez-Carazo et al. (2011) found only one OTU to be potentially endemic from Lundström Lake, Antarctica. Lundström Lake is further south in latitude and geographically more isolated from marine influence when compared to the MDV region. Fernandez-Carazo et al. (2011) suggested that reduced geographical isolation could produce more endemic OTUs, a contention supported by our results from the MDV.
We conclude that the strong föhn winds in Taylor Valley distribute cyanobacteria throughout each basin with in the valley and individual habitats, in which they land, and place unique physical and chemical selection pressures on the organisms to define the community; favourable habitats produce ‘hotspots’ of biomass and diversity. There is a net down valley movement of Cyanobacteria taxa as well as distance correlation with community dissimilarity, consistent with the published distance–decay theory. Endemism of cyanobacterial taxa within Taylor Valley is relatively high and is more common than further inland locations of Antarctica.
Acknowledgements
We would like to thank the McMurdo LTER scientists and technicians who assisted with field work and Kara DeLeon for help with sequence processing. B. Herried assisted in Fig. 1 preparation. PHI Inc. provided helicopter assistance in the field, and Raytheon Polar Services provided logistical support. Funding for A.B.M was provided by NSF IGERT Program in Geobiological Systems (DGE 0654336) and the Montana Space Grant Consortium. This research was supported by National Science Foundation grants OPP-0838933, OPP-083975 and OPP-1115245 awarded to J.C. Priscu. The manuscript was greatly improved by the comments from three anonymous reviewers.
References
Supporting Information
Additional Supporting Information may be found in the online version of the article:
Author notes
Editor: Max Häggblom
