


Abstract
Proteins may be an important carbon and nitrogen source to bacteria in aquatic habitats, yet knowledge on the actual utilization of this substrate by proteolytic bacteria is scarce. In this study, Pseudomonas fluorescens ON2 produced an alkaline proteinase (AprX) during growth, and there was no evidence for cell density-regulated or starvation-induced proteinase production. Proteinase was produced in the absence of an organic nitrogen source, and citrate had a negative while glucose had a positive effect on the production. Hence, P. fluorescens ON2 seems to exploit protein sources by expressing the proteinase during growth unless a preferred carbon source such as citrate is present. Lake water model systems were subsequently used to investigate the ability of proteolytic vs. nonproteolytic ON2 strains to utilize protein for growth at moderate cell densities. Only cells forming surface-attached microcolonies were able to utilize this resource, while planktonic cells were not. Our experiments are the first to experimentally support models predicting that production of extracellular enzymes in dilute environments may be a waste of resources, whereas it represents a favorable feeding strategy in organic matrices such as detritus, microcolonies, or biofilm.
Introduction
Fluorescent pseudomonads constitute a widespread group of bacteria (Wiedmann et al., 2000; Sørensen et al., 2001), and the production of extracellular proteinases is a common phenotype for Pseudomonas fluorescens and related species, for example P. synxantha, P. fragi and P. lundensis isolated from natural environments and food products (Worm & Nybroe, 2001; Marchand et al., 2009). These bacteria produce an alkaline metalloproteinase commonly referred to as AprX (Woods et al., 2001; Worm & Nybroe, 2001; Martins et al., 2005; Marchand et al., 2009).
Proteinase production in P. fluorescens is affected by several environmental factors. For example, proteinase activity is repressed by high concentrations of iron (Woods et al., 2001; Maunsell et al., 2006) and by temperatures above the optimal growth temperature in many but not all strains (Burger et al., 2000; Woods et al., 2001). N-Acyl homoserine lactone (AHL)-mediated quorum sensing may modulate proteinase production in response to cell density (Liu et al., 2007), yet it should be noted that some proteolytic pseudomonads do not produce these signal molecules (Ferrocino et al., 2009).
It has been hypothesized that the function of the proteinase is to provide carbon for cell growth rather than amino acids for protein synthesis (Fairbairn & Law, 1987). A few studies indicate that both carbon and nitrogen sources may regulate proteinase production (McKellar, 1982; Fairbairn & Law, 1987) but detailed studies are missing. Furthermore, the significance of individual environmental factors controlling proteinase production often varies among strains, making it necessary to determine the regulation for individual strains of interest.
Proteins may be an important supplementary nitrogen source to bacteria in aquatic environments, because organic nitrogen is the preferred nitrogen form to many aquatic microorganisms (Seitzinger et al., 2002). Most attention has been paid to uptake of free and combined (chemically hydrolysable) amino acids (Jørgensen et al., 1999), and knowledge on the actual utilization of peptides and proteins by aquatic bacteria is scarce. Application of substrate analogs (proxy for aminopeptidase activity) suggests that utilization of peptides is a common feature in aquatic microorganisms (Unanue et al., 1998), potentially supporting a large fraction of the carbon and nitrogen demand of particle-attached bacteria in productive lakes (Middelboe et al., 1995). Supporting this, recent sequencing of marine bacterial genomes shows that genes encoding proteases for extracellular degradation as well as transporters for peptides are commonly found in aquatic bacteria (Church, 2008; Yooseph et al., 2010).
Utilization of proteins in aquatic habitats presumably involves the secretion of proteinases to the extracellular environment. Released peptides may further be cleaved by exopeptidases, for example aminopeptidases, to small peptides and amino acids that can be taken up by the cell and used in metabolism (Payne & Smith, 1994). A bacterium that relies on an extracellular proteinase may face several challenges. Importantly, the proteinase activity may be diluted because of the diffusive loss of enzymes, and the hydrolysis products may likewise diffuse away from the cell that produces the enzyme (Hollibaugh & Azam, 1983; Allison, 2005). Hence, Vetter et al. (1998) developed a model predicting that microbial foraging by secreted enzymes would be beneficial for bacteria enclosed in exopolymers, while the production of extracellular enzymes in dilute environments may be a waste of resources.
This study first aimed to determine the relative influence of nitrogen vs. carbon sources on the production of the AprX proteinase, thereby addressing the function of the AprX proteinase in providing carbon vs. nitrogen for cell growth. The second aim was to experimentally test the hypothesis that production of extracellular enzymes in dilute environments is a waste of resources, whereas it represents a favorable feeding strategy for surface-attached cells. This experiment determined the ability of planktonic- vs. microcolony-forming cells of a proteolytic bacterium to utilize protein for growth at moderate cell densities in lake water microcosms. All experiments were performed using P. fluorescens strain ON2, a strain previously used for model studies in aquatic systems (Christoffersen et al., 1997; Worm et al., 2000).
Materials and methods
Bacterial strains and growth media
Pseudomonas fluorescens ON2 was originally isolated from freshwater sediment (Christoffersen et al., 1997) and produces an AprX extracellular proteinase (Liao & McCallus, 1998; Worm et al., 2000). Pseudomonas fluorescens ON2-gfp2 and P. fluorescens ON2-pd5 were obtained by chromosomal insertions of the pUTmini-Tn5-gfp gene cassette into P. fluorescens ON2 (Worm et al., 2000) and hence express the green fluorescent protein (Gfp) constitutively (Andersen et al., 1998). Growth and expression of extracellular enzymes by P. fluorescens ON2-gfp2 are similar to characters for the wild-type strain, whereas P. fluorescens ON2-pd5 is deficient in producing the extracellular proteinase (Worm et al., 2000).
For all experiments in complex or defined media, strains were cultured at 28 °C with agitation at 150 r.p.m. in Luria–Bertani (LB) medium (10 g L−1 tryptone, 5 g L−1 yeast extract, and 10 g L−1 NaCl) or a minimal medium containing (g L−1) 7.0 K2HPO4, 2.0 KH2PO4, 0.1 MgSO4·7H2O, 0.05 CaCl2·2H2O, 1 mL trace element solution (Kragelund & Nybroe, 1994), and supplemented with carbon (C) and nitrogen (N) sources according to Table 0001. Minimal media supplemented only with citrate or only with were used for N- and C-starvation experiments, respectively. When required, caseinate Na-salt (Sigma-Aldrich) was added from a 0.2-μm prefiltered, autoclaved stock solution. All media were supplemented with kanamycin to a final concentration of 25 μg mL−1.
Media composition
Gln, Glutamine.
C:N = 0.4 (molar ratio).
Assumed carbon/dry weight ratio of 50%.
‡Applied as NH4Cl.
media used for continous culture experiments.
Media composition
Gln, Glutamine.
C:N = 0.4 (molar ratio).
Assumed carbon/dry weight ratio of 50%.
‡Applied as NH4Cl.
media used for continous culture experiments.
For all experiments, cells were pregrown in LB medium and washed three times in 0.9% NaCl (6000 g for 5 min or 10 000 g for 2 min, 20 °C) before inoculation in either supplemented minimal media or lake water. LB medium was chosen as pregrowth medium, as no proteinase activity was detectable for cells grown to stationary phase in the LB medium (data not shown).
Experiments with planktonic cells in defined media
Pseudomonas fluorescens ON2-gfp2 cells were inoculated to a final cell density of approximately 0.01 OD600 nm, equivalent to ~ 2 × 10⁷ cells mL−1, in minimal medium supplemented with C- and N-sources as specified in Table 0001. Cultures were sampled for the determination of cell density (OD600 nm), proteinase activity (colorimetric assay), the aprX gene transcript (reverse transcription (RT) PCR), and production of the AprX proteinase (Western blot).
Experiments with planktonic cells in lake water model systems
Water was collected from the mesotrophic lake Sjælsø (Denmark). Organic N is the dominant N form in the lake Sjælsø and constitutes 1.0 mg N L−1 as compared to 0.3 mg inorganic N L−1 (annual means) (Frederiksborg Amt, 2005). The concentration of protein amino acids in the lake water was 107 ± 25 μg L−1 as determined by the Quant-It Protein Assay Kit (Invitrogen). Applying the average molecular weight of 114 of combined (including protein-bound) amino acids previously found in a clear water lake (Tranvik & Jørgensen, 1995), a final concentration of protein amino acids of 0.94 ± 0.22 μM in the lake water was calculated. Thus, amino-N is estimated to make up about 1.5% of the total organic N pool.
Before use in model systems, lake water was filtered through a 0.2-μm pore-size Stericup™-GS Filter System (Millipore) to remove particles, and remaining enzymes were inactivated by autoclaving (121 °C, 20 min). Subsequently, water samples were amended with 0.35 mM CaCl2·2H2O (necessary for proper folding of the proteinase) and 25 μg mL−1 kanamycin. For casein-amended lake water model systems, caseinate Na-salt (Sigma-Aldrich) was added from a 0.2-μm prefiltered, autoclaved stock solution to obtain final concentrations of 20 or 200 mg L−1. Model systems were inoculated with P. fluorescens strains ON2-gfp2 or ON2-pd5 to a final cell density of ~ 5 × 10⁴ cells mL−1 and incubated at 20 °C with agitation at 150 r.p.m. Samples were collected for the determination of cell counts by flow cytometry during 6 days. Subsequently, the lake water systems containing 20 and 200 mg L−1 casein were amended with corresponding amounts of casamino acids (Bacto) or a mixture of 21 pure amino acids (Sigma-Aldrich) to verify whether this casein hydrolysate stimulated the growth. In a parallel setup (200 mg casein L−1), P. fluorescens ON2-gfp2 was sampled for the detection of the aprX gene transcript at 2 and 24 h, and the AprX protein and AprX activity after 24 h. For this setup, cell numbers were determined as colony-forming units (CFU) after 24-h incubation at 28 °C on LB plates containing kanamycin at 25 μg mL−1, to verify similar growth in the two setups.
Detection of proteinase and proteinase activity
In the defined medium experiments, proteinase and proteinase activity were detected directly in culture supernatants after centrifugation of 1 mL of culture at 6000 g for 5 min or at 10 000 g for 2 min at 20 °C. In the lake water experiments, samples of 150 mL were concentrated 300-fold on Vivaspin 20 ultrafiltration columns (Sartorius Stedim; 30-kDa cutoff value that retains the 50-kDa AprX) prior to detection. Columns were centrifuged at 2297 g, and portions of 20 mL were added sequentially resulting in a total spin time of approximately 2 h. The samples were sterile-filtered (0.2 μm pore size) before being loaded on the columns. Proteinase activity was measured colorimetrically using azocasein according to Smibert & Krieg (1994). In short, color development because of proteinase activity was measured as OD400 nm readings and standardized as Proteinase-K equivalents where 1 U corresponds to 1 μg mL−1 Proteinase-K (EC 3.4.21.14; Sigma-Aldrich). Detection limit of the assay corresponds to 0.2 μg mL−1 Proteinase-K. Specific proteinase activity was calculated for the culture supernatants as U × (OD600 nm)−1.
The extracellular AprX proteinase was detected by Western blot analysis. Culture supernatant samples were normalized to represent 5 × 10⁷ cells mL−1 (conversion factor: 1 mL culture with an OD600 nm of 1.0 contains 2 × 10⁹ cells). Western blot analysis was carried out essentially as described by Worm & Nybroe (2001) using 12% Nupage polyacrylamide gels with a MOPS running buffer (Invitrogen) and electrotransfer as in the study described by Kragelund et al. (1996). Following blocking and washing steps, membranes (BA85, Schleicher and Schüll) were incubated overnight in a 1 : 5000 dilution of a rabbit antibody raised against purified AprX proteinase of P. fluorescens UP206 (Lundy et al., 1996). The secondary antibody was a 1 : 1000 dilution of anti-rabbit immunoglobulins conjugated with alkaline phosphatase (DAKO). Buffers, washing steps, and color reactions using 5-bromo-4-chloro-3-indolylphosphate and nitroblue tetrazolium (Sigma-Aldrich) were as described previously (Kragelund et al., 1996).
RNA/DNA extraction and RT-PCR for the detection of the aprX gene and gene transcript
Samples for nucleic acid extraction were collected in RNase/DNase-free tubes as the cell pellet remaining when supernatants were transferred for use in the measurements described above (from 1-mL culture, 900 μL culture supernatant was removed and the rest was considered pellet). Tubes containing the pellets were immediately frozen in liquid nitrogen and transferred to −70 °C for storage. Nucleic acids were extracted simultaneously either by the method described by Nicolaisen et al. (2008) for the defined media samples or by the Qiagen RNA/DNA kit, according to the manufacturer's instructions, for the lake water samples. Regardless of the extraction procedure, 8 μL raw extract was treated with 1 μL RQ1 RNase-free DNase I (Promega) according to the manufacturer's protocol by incubation for 30 min at 37 °C. The reaction was stopped by the addition of 1 μL 20 mM EGTA (pH 8.0, provided by the manufacturer) and incubation at 65 °C for 10 min. Samples were stored at −20 °C immediately after treatment. Reverse transcription was performed using the Omniscript reverse transcription kit (Qiagen). Reactions were carried out in a 20-μL reaction volume containing 1× buffer (provided in the kit), 0.5 mM of each dNTP (provided in the kit), 400 ng hexamer primers (Promega), 4 U SUPER RNase inhibitor (Ambion), 4 U Omniscript RT (provided in the kit), and 2 μL DNase I-treated RNA. DNase- and RNase-free water (provided in the kit) was added to adjust the reaction volume. The following program was used for reverse transcription: 90 min at 37 °C followed by 10 min at 95 °C to inactivate the transcriptase. The resulting cDNA samples were cooled to 4 °C immediately after finishing the program and stored at −20 °C.
Both cDNA and DNA were subject to PCR in order to detect the aprX transcript and the aprX gene, respectively. Reactions were carried out in 20-μL reactions containing 1× buffer (provided with the DNA polymerase), 200 μM each dNTP, 0.5 μM each of the primers aprI/aprII (Bach et al., 2001), 0.4 U Phusion DNA polymerase (Finnzymes), and 2 μL template. The PCR program was as follows: 98 °C for 30 s, 35 cycles of 98 °C for 10 s, 52 °C for 20 s, 72 °C for 20 s, and a final extension step at 72 °C for 5 min. All products were visualized by gel electrophoresis on 2% agarose gels and subsequent staining of DNA for 5 min in ethidium bromide. To ensure that no contaminating DNA was present in the RNA preparations, PCR was run directly on the RNA fraction using the conditions described earlier, with the correction of template RNA to the actual amount added after dilution because of the reverse transcription step.
Selected fragments obtained based on the amplification of RNA and DNA, respectively, were excised from the gel, purified using the gel purification kit from Qiagen, cloned, and sent for sequencing using the aprI primer at Uppsala Genome Center (www.genomecenter.uu.se).
Determination of cell abundance by flow cytometry
Gfp-tagged cells of P. fluorescens ON2-gfp2 and ON2-pd5 were counted in samples from lake water model systems by a Becton Dickinson FACSCalibur™ flow cytometer (www.bd.com), equipped with a standard 488-nm argon laser. Cells were detected in a logarithmic plot of green fluorescence (530/30 nm) vs. side scatter. A known number of 2 μm-diameter yellow-green fluorescent microspheres with maximum absorption at 585 nm (Invitrogen) were added to each sample as internal standard. Densities of P. fluorescens were determined by relating the numbers of counted microspheres to the number of observed bacterial cells.
If samples were not processed immediately, pure cultures were fixed with buffered formaldehyde (Sigma-Aldrich) to a final concentration of 2% for subsequent flow cytometer analysis. In these cases, bacteria were labeled using the green fluorescent nucleic acid stain SYBR Green I (Invitrogen) as fixation reduces the fluorescence of Gfp in strain ON2.
Determination of growth in microcolonies
Growth of surface-attached cells was determined with a microcolony technique (Binnerup et al., 1993; Nybroe, 1995). Approximately 1 × 10⁶ cells of P. fluorescens ON2-gfp2 or ON2-pd5 were collected on each 0.2-μm pore-size black Poretics polycarbonate filter (GE Osmonics). Filters were incubated at 20 °C floating on the surface of liquid growth media or lake water in 6-well NuncClon multiwell plates containing 15 mL of liquid per well (Nunc). Filters were incubated for 1 day on minimal medium with 20 mM glutamine, for 3 days on minimal medium containing 20 g L−1 casein, or for 4 days on lake water. After incubation, cells were fixed and stained (as fixation reduces the fluorescence of Gfp in strain ON2) for 15 min by placing the filter on the surface of a solution of 2% buffered formaldehyde and 0.04% acridine orange (Merck). Subsequently, stain and fixative were removed by three washes, 5 min each, on deionized water (Milli-Q system; Millipore) before filters were dried and mounted on microscope slides. Single cells and microcolonies were detected at 400× magnification in a Zeiss Axioplan epifluorescence microscope. Ten to twenty random spots on the filter were digitalized as gray-scale images by a Quantix CCD-camera (Photometrics) controlled by the software IPLab for Windows v. 2.281 (Scanalytics Inc.). The images were saved in the tiff format and analyzed by Image-Pro Plus for Windows (Media Cybernetics). Images were optimized for automated image analysis by 3 × 3 median and flatten background filters followed by fixed gamma and contrast corrections. Microcolonies were counted and sized (μm2) using fixed threshold settings for the digital measurements. The minimum size of a microcolony was set to 4 μm2. Colonies were assigned to size classes containing colonies ranging from 4 to 8 μm2, 8 to 16 μm2, 16 to 32 μm2, etc.
Statistics and assay replication
All experiments have been carried out independently, at least twice. Each independent experiment has been based on replicate or triplicate samples. The relationship between media components and the production of proteinase activity was tested by Spearman's rank correlation coefficients (Sokal & Rohlf, 1995). Correlations between specific proteinase activity [U × (OD600 nm)−1] and media components were considered significant at P < 0.05.
Statistical analyses for the comparison of changes in cell densities and areas of microcolonies included t-test and Spearman's product–moment correlations, using the statistical package of SigmaPlot 11 (www.sigmaplot.com). Data were logarithmically transformed to equalize variances prior to analysis (Sokal & Rohlf, 1995).
Results
Proteinase production and activity in defined media
We initially introduced P. fluorescens ON2-gfp2 to minimal media containing the range of C- and N-sources listed in Table 0001 and determined proteinase activity after 24-h growth. Specific proteinase activity in the medium containing glutamine as the sole C- and N-source was 3.40 ± 1.52 U × (OD600 nm)−1. The relationship between specific proteinase activity and different N-sources in the growth medium was tested by Spearman's rank correlation coefficients for two independent experiments (n = 24). The proteinase activity was unaffected by the N-source, as ranking of specific proteinase activities relative to glutamine, , and casein did not indicate any significant differences (P > 0.66), (Table 0002).
Proteinase activity in response to the composition of the growth medium after 24 h. The data are mean values (SE) from two independent experiments
| Specific proteinase activity U(OD600 nm)−1 | |
| Growth medium | Mean (SE) |
| Glutamine (Gln) | 3.40 (1.52) |
| + | 3.07 (0.13) |
| + casein | 3.64 (0.02) |
| + casein+ | 2.99 (0.49) |
| Citrate | |
| + | 0.23 (0.02) |
| + Gln | 0.14 (0.05) |
| + Gln+casein | 0.26 (0.04) |
| + Gln+casein+ | 0.31 (0.02) |
| Glucose | |
| + | 5.33 (0.95) |
| + Gln | 6.84 (1.09) |
| + Gln+casein | 4.25 (0.63) |
| + Gln+casein+ | 3.50 (0.48) |
Cultures grown in minimal medium containing glucose as the only C-source gave rise to activities between 3.50 ± 0.48 and 6.84 ± 1.09 U × (OD600 nm)−1, depending on the N-source (Table 0002). Finally, low proteinase activities between 0.14 ± 0.05 and 0.26 ± 0.04 U × (OD600 nm)−1 were found for cultures in minimal medium with citrate as the only C- source. The relationship between specific proteinase activity and C-sources in the growth medium was tested by Spearman's rank correlation coefficients as above and the negative and positive effects of citrate and glucose, respectively, compared with the glutamine minimal medium, were both highly significant (P < 0.001). Hence, the C-source was more important for the level of proteinase activity in P. fluorescens ON2 than the N-source, and proteinase activity was found even in the absence of an organic N-source.
To investigate the effect of growth conditions on proteinase activity in more detail, studies were performed over the full growth cycle for selected media compositions including starving conditions (Table 0001). No evidence for starvation-induced proteinase production in P. fluorescens ON2-gfp2 was observed when grown on C- or N-depleted minimal media (data not shown).
Proteinase activity occurred during growth for all carbon and nitrogen sources applied, yet different levels and temporal patterns were found dependent on the carbon source (Fig. 0001). In glutamine minimal medium (Fig. 0001a), proteinase activity was first detectable at 8 h and increased during the exponential growth phase to reach a level of > 2 U × (OD600 nm)−1 in the late exponential phase. However, the proteinase activity decreased during the late exponential and stationary phases. During growth on glucose as the carbon source, proteinase activity peaked during late exponential phase and a stable level was maintained during stationary phase (Fig. 0001b). Growth on citrate minimal medium resulted in a low, transient proteinase activity that could only be detected in late exponential phase (Fig. 0001c), and then declined below detection limit. When P. fluorescens ON2-gfp2 was grown on a mixture of citrate and glucose (Fig. 0001d), proteinase activity was at the same low level as seen when citrate was added as the only carbon source, but in contrast, proteinase activity was stable during the stationary phase as seen for the glucose-amended cultures (Fig. 0001b).
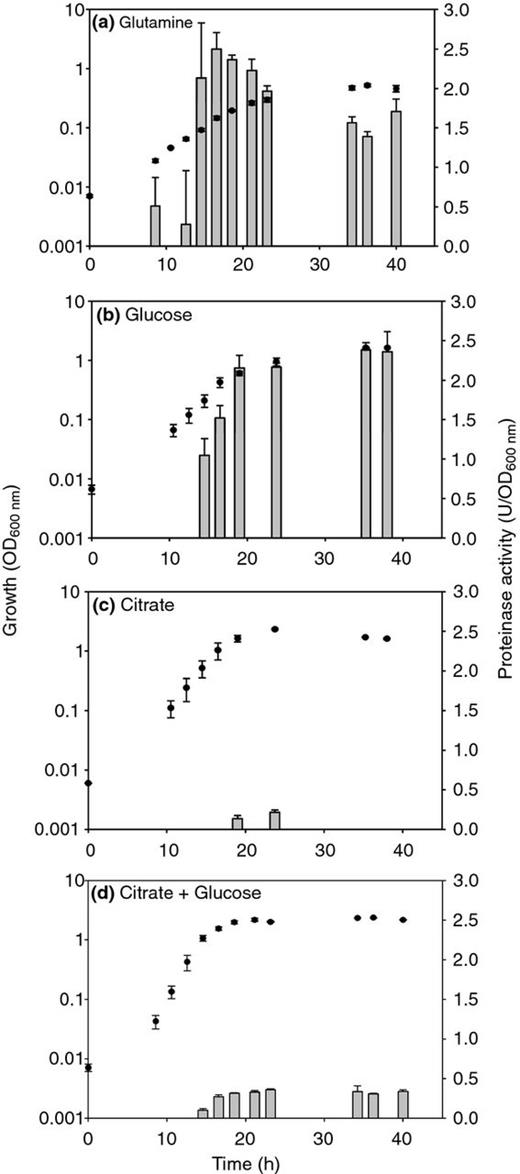
Proteinase activity of Pseudomonas fluorescens strain ON2-gfp2 during growth in minimal medium supplemented with different carbon sources. (a) Glutamine; (b) Glucose; (c) Citrate; (d) Glucose + Citrate. Growth is represented as OD600 nm (●), whereas proteinase activity is represented as U/OD600 nm (vertical bars). Data shown are mean values. The bars represent the standard deviations.
Western blot analysis of culture supernatants (normalized to cell numbers) was carried out to demonstrate the production of the AprX proteinase (Fig. 0002a). Data corresponded with the data obtained for proteinase activity. Hence, they showed the highest production of the AprX proteinase in media with either glutamine or glucose and a lower production in medium with citrate plus glucose. In minimal medium with citrate as the sole carbon source, AprX production was lower than the detection limit of the method. In contrast, transcription of the aprX gene, that is, the formation of aprX mRNA, was seen for all media compositions regardless of the measured activity of the proteinase (Fig. 0002b). As a control, PCR was performed on the DNA fraction as well (data not shown), and selected samples originating from both the RNA and the DNA fractions were sequenced to confirm specific detection of the aprX gene. All sequences were identical and had a 99% similarity to other P. fluorescens aprX genes. In conclusion, the above experiments demonstrate that P. fluorescens ON2 expresses the AprX proteinase during growth but to varying degrees depending on the C-source.
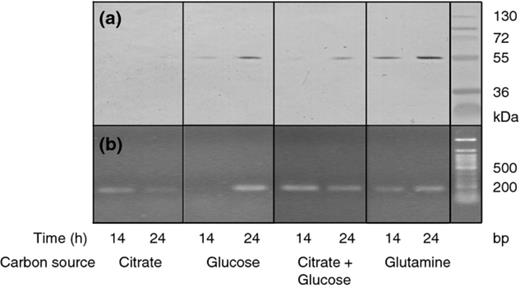
Expression of alkaline proteinase by Pseudomonas fluorescens strain ON2-gfp2 during growth in minimal medium supplemented with different carbon sources. (a) Western blot assay to demonstrate AprX proteinase in culture supernatants from growth on different carbon sources. (b) RT-PCR detection of the aprX transcript in the cells of P. fluorescens ON2-gfp2 from growth on different carbon sources.
Significance of proteinase in lake water
Growth of planktonic cells
We next addressed whether P. fluorescens ON2 was able to utilize an added protein source at more realistic cell abundances in lake water model systems. We consequently introduced the proteolytic strain ON2-gfp2 or the proteinase-deficient mutant strain ON2-pd5 to model systems containing lake water enriched with either 20 or 200 mg casein L−1. The strains were introduced at low cell densities and their growth was compared. Within 1–2 days, both strains grew from ca. 5 × 10⁴ cells mL−1 to a carrying capacity in the lake water microcosms of ca.5 × 106 cells mL−1, and this population size was maintained up to day 6 (Fig. 0003). The cell numbers of the two strains did not differ significantly when data for days 2–6 were compared (P > 0.05; paired t-test). After the addition of casamino acids (hydrolyzed casein) to a concentration of 20 or 200 mg L−1 at day 6, the bacterial cell density increased to approximately 5 × 10⁷ and 2 × 10⁸ cells mL−1, respectively, after growth overnight (Fig. 0003). No differences were found between cell densities of the strains at each of the two casamino acid concentrations (P > 0.8; paired t-test). The casamino acids were added to verify that the cells were indeed able to grow on casein in a hydrolyzed form. As the addition of casamino acids introduces certain nutrients (although in low amounts), a test experiment using pure amino acids was performed to ensure that the lack of growth on the added protein was not caused by limitations for other nutrients subsequently supplied together with the casamino acids. This test showed that the addition of 200 mg L−1 pure amino acids to lake water amended with 200 mg L−1 casein supported the growth of 1.3 × 10⁸ ± 1.2 × 10⁷ cells mL−1, which corresponded to the growth obtained after the addition of an 200 mg L−1 casamino acids Together, these results provide strong evidence that P. fluorescens ON2-gfp2 was not able to utilize the added casein in the lake water model system.
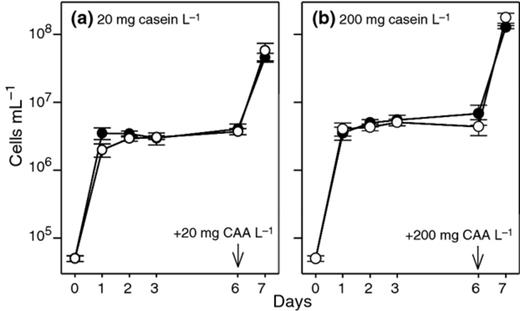
Growth of Pseudomonas fluorescens strain ON2-gfp2 (●) and proteinase-deficient strain ON2-pd5 (o) in lake water microcosms enriched with (a) 20 mg L−1 of casein and (b) 200 mg L−1 of casein. At day 6, the microcosms received 20 or 200 mg L−1 casamino acids (CAA) as indicated by arrows. Data shown are mean values. The bars represent the standard deviations. Data for days 1–7 are obtained by flow cytometry, while data for day 0 are calculated from OD600 nm values of the inoculum using the conversion factor: 1 mL of 0.01 OD600 nm is equivalent to ~ 2 × 10⁷ cells.
We subsequently investigated whether the aprX gene was transcribed and the AprX protein produced by P. fluorescens ON2-gfp2 in the lake water model system. The RT-PCR analysis showed that aprX was expressed already 2 h after incubation, at a level barely detectable owing to the very low cell number added to the microcosms (data not shown). After 24 h of incubation, the transcripts were more readily detected (Fig. 0004a) because of the growth of the bacteria to a carrying capacity of approximately 106 cells mL−1 as verified by CFU counts (data not shown). As for the defined media, all sequenced fragments originating from both the RNA and DNA fractions had a 99% similarity to aprX genes found in other biovars of P. fluorescens. It was not possible to detect any proteinase activity in the lake water samples; however, Western blot analysis revealed that the gene products were indeed translated after 24 h in the lake water model system, as the AprX protein was readily detectable (Fig. 0004b). Hence, the aprX gene was expressed and the AprX proteinase produced, even though ON2-gfp2 was not able to use this protein source for growth in the lake water model system.
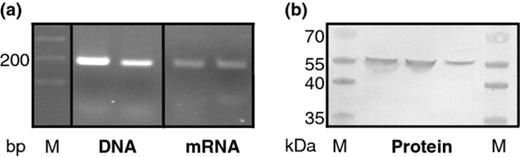
Expression of alkaline proteinase by Pseudomonas fluorescens strain ON2-gfp2 during growth in lake water. (a) Detection of aprX DNA and mRNA in cells from the lake water model system after 24 h. (b) Western blot assay on concentrated samples from lake water microcosms to demonstrate the presence of AprX in this system.
Growth of surface-attached cells
The low growth of the proteolytic ON2 strain on the added protein source could be due to the limited availability of protein hydrolysates caused by the dilution of the proteinase and the hydrolysates in the lake water. Consequently, we determined the ability of surface-attached ON2-gfp2 and ON-pd5 cells to form microcolonies when grown with or without protein amendment.
Initial experiments were performed in defined media in order to verify the microcolony growth assay. Microcolonies of P. fluorescens strain ON2-gfp2 and ON2-pd5 did not differ with respect to size classes (P < 0.001; Spearman's correlation) or area of the microcolonies (P < 0.01; paired t-test) when grown on glutamine minimal medium for 1 day (Fig. 0005a). Longer incubation times were not feasible because of the rapid growth of microcolonies on this medium. On casein minimal medium, ON2-gfp2 formed five- to tenfold larger microcolonies within 3 days than the proteinase-deficient strain ON2-pd5 (P < 0.001; paired t-test) and a bimodal distribution of the colonies was found (Fig. 0005b). This showed that the microcolony assays could reliably distinguish the growth of ON2-gfp2 utilizing an added protein source and ON2-pd5, which could not utilize added protein for growth.

Size distribution of microcolonies for Pseudomonas fluorescens strain ON2-gfp2 and the proteinase-deficient strain ON2-pd5. (a) Growth for 1 day on glutamine minimal medium. (b) Growth for 3 days on casein minimal medium. Data shown are mean values from two independent experiments. The bars represent the standard deviations.
In un-amended lake water, both ON2-gfp2 and ON2-pd5 were able to form small microcolonies of comparable size (P < 0.001; Spearman's correlation) (data not shown). However, in lake water samples amended with 200 mg L−1 casein, the proteolytic strain ON2-gfp2 formed significantly larger microcolonies than ON2-pd5 (P < 0.001; paired t-test) (Fig. 0006). Consequently, P. fluorescens strain ON2-gfp2 was able to utilize casein for growth in the lake water system when grown as surface-attached microcolonies.
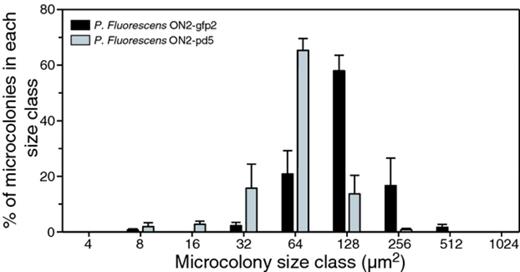
Size distribution of microcolonies for Pseudomonas fluorescens strain ON2-gfp2 and the proteinase-deficient strain ON2-pd5 after growth for 4 days in lake water amended with 200 mg L−1 casein. Data shown are mean values from two independent experiments. The bars represent the standard deviations.
Discussion
Experiments in defined media
This study reports a detailed expression analysis addressing proteinase activity, production of the AprX proteinase as well as transcription of the aprX gene in P. fluorescens ON2 to determine the role of C- and N-sources for proteinase production.
In general, the results revealed that a variation in C-source caused larger differences in proteinase activity in P. fluorescens ON2 than changing the N-source. Furthermore, production of the AprX proteinase was a trait associated directly with growth, with the highest proteinase activity obtained in the late exponential growth phase, which supports previous studies reporting growth-associated production of proteinase in P. fluorescens isolated from different environments (McKellar, 1982; Fairbairn & Law, 1987; Nicodeme et al., 2005). This expression pattern is compatible with the regulation of the AprX proteinase by the Gac two-component regulatory system (Sacherer et al., 1994). Growth-associated proteinase production probably represents a general and useful foraging strategy for pseudomonads that are r-strategists and early colonizers of new habitats. This is in contrast to the starvation-induced proteinase production observed for, for example, Pseudoalteromonas strains (Albertson et al., 1990), thus suggesting different metabolic roles of proteinase in different bacteria. The different temporal expression patterns found in P. fluorescens ON2 on different C-sources underline the importance of detailed time-series when effects of different C-sources or differences in enzyme regulation are compared between strains.
We found low proteinase activities for cells growing on citrate. This expands previous observations made exclusively at the proteinase activity level for other strains (McKellar, 1982; Fairbairn & Law, 1987), and it has been suggested that citrate reduces proteinase activity by complexing metal ions required for activity (McKellar, 1982). However, our expression analysis points to a low production of the AprX proteinase in media with citrate.
Different N-sources had a low impact on proteinase expression and activity in P. fluorescens ON2 and proteinase was produced even in the absence of an organic nitrogen source, and hence without proteins or protein hydrolysates in the medium, suggesting that proteinase activity is not merely induced by the presence of proteins in this strain. The significance of proteins in the media has not been analyzed in detail before, but previous studies have indicated that most amino acids used for growth support proteinase production in other strains (Fairbairn & Law, 1987). In concert, these observations indicate that the function of the proteinase is to provide carbon for cell growth rather than amino acids for protein synthesis. In conclusion, we speculate that the strategy which P. fluorescens ON2 uses to exploit protein sources in the environment is to express proteinase constitutively during growth unless a preferred carbon source such as citrate or other inhibitors are present in its environment. The proteinase that has been produced may or may not be available for cells in the stationary phase, depending on the nature and complexity of their habitat.
Experiments in lake water model systems
We subsequently determined whether P. fluorescens ON2 was able to utilize added protein for growth at more realistic cell concentrations in a simple lake water model system. To obtain growth, which the above experiments show is required for the expression of AprX, we inoculated model systems with approximately 5 × 10⁴ cells mL−1. Then, growth of P. fluorescens ON2-gfp2 and the nonproteolytic strain ON2-pd5 was compared in systems amended with increasing amounts of protein (casein). The basis for this approach was previous observations that the proteolytic activity of ON2-gfp2 gives this strain a higher growth potential than ON2-pd5 in protein-amended defined media at high cell densities (Worm et al., 2000). Finally, we compared the ability of the proteolytic strain ON2-gfp2 to exploit casein for growth in a biofilm to the results obtained when cells were grown as planktonic cells. The amount of resources (substrates and nutrients) available per cell was comparable for the two setups, as the initial concentration of planktonic cells was 5.0 × 10⁴ cells mL−1, and the initial cell load on membranes supporting microcolony growth corresponded to 6.7 × 10⁴ cells mL−1. Our results show that added protein was not able to support the growth of planktonic cells of the proteolytic strain ON2-gfp2, whereas the strain was able to use added protein to support the growth when grown as surface-attached microcolonies. Interestingly, the planktonic cells did express the aprX gene and did produce the AprX protein during initial growth in the lake water model system. However, this initial production of proteinase was not sufficient to support further growth using casein under the low-cell-number conditions in the lake water model system.
Soluble proteins added to an aquatic environment are generally assumed to be utilized by bacteria that secrete proteinases (Hollibaugh & Azam, 1983). However, it has repeatedly been recognized that microorganisms relying on secreted enzymes as a foraging strategy face several challenges as enzymes as well as hydrolysis products may diffuse away from the enzyme-producing cell (Hollibaugh & Azam, 1983; Vetter et al., 1998; Allison, 2005). Mathematical models developed by Vetter et al. (1998) and Allison (2005) have shown that production of extracellular enzymes in dilute environments may be a waste of resources because of the diffusive loss of enzymes and hydrolysates. On the other hand, the models predict that extracellular enzyme production represents a favorable feeding strategy when cells, enzymes, and substrate are spatially concentrated in organic matrices such as detritus or biofilms. The importance of extracellular enzymatic activity in such cellular environments was likewise emphasized in a seasonal study of aminopeptidase activity in free-living and particle-attached bacteria in a eutrophic lake. Here, particle-attached bacteria showed 60-fold higher cell-specific extracellular aminopeptidase activity than free-living cells, and the extracellular peptide hydrolysis supported a substantial part of the estimated carbon and nitrogen demand of bacteria on aggregates (Middelboe et al., 1995).
Our results can be explained by the following scenario: The AprX proteinase is produced by the proteolytic ON2-gfp2 in lake water, but the supply of protein hydrolysates to support the growth of planktonic cells is insignificant. This situation is actually predicted in the paper by Allison (2005) who states that ‘if population size is too low and mixing too rapid, producers may be unable to raise product concentrations high enough to achieve positive growth. Such a situation could occur in a well-mixed flask that contains only few enzyme-producing microbes and a complex substrate’. The surface-attached ON2-gfp2 cells utilized added protein leading to the formation of microcolonies. This is probably because the layer of exopolymers produced during early biofilm formation (Flemming & Wingender, 2010) limits the diffusion of the proteinase and of the hydrolysates away from the cells. Hence, the result presented here for the first time experimentally supports the models of Vetter et al. (1998) and Allison (2005) and the classical notion that excretion of exoenzymes is only energetically efficient in specialized microenvironments where molecular diffusion is restricted (Hollibaugh & Azam, 1983).
Acknowledgements
This work was supported by the Danish Natural Science Research Council, grant no. 21-01-0537, and 09-072829. We thank A.C. Magee and D.A. McDowell for providing the proteinase antibody. We thank P.M. Jensen for help on the statistical analysis.
References
Author notes
Present address: Jakob Worm, Fermentation Process, Chr. Hansen A/S, Bøge Allé 10 - 12, DK-2970, Hørsholm, Denmark
Editor: Philippe Lemanceau
