


Abstract
Development of inhibitors and vaccines that mitigate rumen-derived methane by targeting methanogens relies on knowledge of the methanogens present. We investigated the composition of archaeal communities in the rumens of farmed sheep (Ovis aries), cattle (Bos taurus) and red deer (Cervus elaphus) using denaturing gradient gel electrophoresis (DGGE) to generate fingerprints of archaeal 16S rRNA genes. The total archaeal communities were relatively constant across species and diets, and were less variable and less diverse than bacterial communities. There were diet- and ruminant-species-based differences in archaeal community structure, but the same dominant archaea were present in all rumens. These were members of three coherent clades: species related to Methanobrevibacter ruminantium and Methanobrevibacter olleyae; species related to Methanobrevibacter gottschalkii, Methanobrevibacter thaueri and Methanobrevibacter millerae; and species of the genus Methanosphaera. Members of an archaeal group of unknown physiology, designated rumen cluster C (RCC), were also present. RCC-specific DGGE, clone library analysis and quantitative real-time PCR showed that their 16S rRNA gene sequences were very diverse and made up an average of 26.5% of the total archaea. RCC sequences were not readily detected in the DGGE patterns of total archaeal 16S rRNA genes because no single sequence type was abundant enough to form dominant bands.
Introduction
Worldwide, ruminant-derived enteric methane emissions account for about one-quarter of all anthropogenic methane emissions, and are implicated as a driver of global climate change (Wuebbles & Hayhoe, 2002). In some countries, methane produced by ruminants can constitute the largest single source of anthropogenic greenhouse gas emissions. For example, enteric methane represented 32% of New Zealand's total anthropogenic greenhouse gas emissions in 2005 (Leslie et al., 2008). Methane is produced by methanogenic archaea in the rumen, through their utilization of hydrogen (H2) formed during microbial fermentation of the ingested feed. Concerns about the possible environmental effects and associated economic burdens of ruminant methane emissions have lead to increased interest in manipulating methanogens and methanogenesis in the rumen (Leslie et al., 2008; Buddle et al., 2011; Martin et al., 2010). This interest is not new, because methane has long been seen to represent a loss of feed energy for the ruminant animal (Czerkawski, 1969).
Knowledge of the methanogens present in the rumen could enable a more targeted manipulation of the rumen system (Leahy et al., 2010). A number of studies have investigated the diversity of archaea in the rumen, based on the presence of 16S rRNA genes, which can be used to survey the microbial groups present in an environment. Janssen & Kirs (2008) analyzed the 16S rRNA genes reported from 14 studies, performed in different parts of the world, and provided a global picture of the methanogen diversity of the rumen. They found that the majority of the rumen archaea (92.3%) were from three genus-level groups: the genus Methanobrevibacter (61.6%); the genus Methanomicrobium (14.9%); and a large group of uncultured archaea termed rumen cluster C, abbreviated here as RCC (15.8%). However, the proportions of these groups varied significantly among the different studies. These studies cannot be compared directly because the sample processing methods and primers used for PCR-mediated amplification of the 16S rRNA genes were different. There are not many directly comparable studies of archaeal diversity in the rumens of different species or animals on different diets. In one such study, using temporal temperature gradient gel electrophoresis (TTGE), Nicholson (2007) found no strong effect of host on rumen methanogen diversity in grazing sheep and cattle. In studies based on clone libraries, archaea detected in reindeer in two different locations (Sundset et al., 2008, 2009) were similar overall to those in cattle and sheep. Diet has been indicated to play an important role in rumen bacterial diversity (Kocherginskaya et al., 2001; Tajima et al., 2001a; Klieve et al., 2007), but there is little information available concerning the effects of diet on the composition of the methanogen community in the rumen.
Analysis of the genome of Methanobrevibacter ruminantium has identified a number of proteins and pathways that could be targeted in methane mitigation efforts (Leahy et al., 2010). However, interventions directly targeting methanogens using vaccines or small-molecule inhibitors have to be effective against the full diversity of rumen methanogens present in different species of farmed ruminants and on different diets. Otherwise, populations of other species of methanogens may just increase to fill the vacated niche space. Effective intervention will require detailed knowledge of a wider range of rumen methanogens than is currently being investigated (Buddle et al., 2011). In this study, we compared the diversity of methanogens in rumen samples from cattle, sheep and red deer fed with different diets, and identified the dominant methanogens present.
Materials and methods
Use of animals
The use of animals was approved by the AgResearch Grasslands Animal Ethics Committee and complied with the AgResearch Code of Ethical Conduct for the Use of Animals in Research, Testing and Teaching, as prescribed in the Animal Welfare Act of 1999 and its amendments.
Sample collection
Samples of whole rumen contents consisting of fluid and solids (approximately 200 g) were collected via rumen fistulae from four Romney wether sheep (Ovis aries), five nonlactating Friesian-Jersey cross dairy cows (Bos taurus) and four castrated red deer stags (Cervus elaphus), all maintained in Palmerston North, New Zealand. These animals were grazed on pasture consisting of perennial rye grass (Lolium perenne) and white clover (Trifolium repens) in summer and winter, and fed lucerne (Medicago sativa) silage (ChaffHage; The Great Hage Company, Reporoa, New Zealand) in winter. Pasture-grazed animals were on that diet for at least 1 month. Silage-fed animals were adapted to their feed for 15 days before sample collection and fed twice daily, at 08:00 and 16:00 hours, at 1.2 times their estimated energy requirements for maintenance (Swainson et al., 2008). Samples from silage-fed animals were collected at different time intervals after feeding (2, 4, 6 and 8 h), but, unless noted otherwise, only the 2-h samples were analyzed. Other samples were collected only once. Rumen samples were also collected at slaughter from four Romney wether sheep kept in Palmerston North and fed a concentrate-based diet [containing 30% w/w maize grain, 15% w/w barley grain, 15% w/w lucerne (M. sativa) meal, 15% w/w palm kernel extract, 10% w/w molasses, plus rumen-protected fat, vitamin/mineral premixes and fish oil]. Rumen samples were also collected at slaughter from five Suffolk–Romney cross ewe hoggets fed perennial rye grass/white clover pasture during autumn and five Suffolk–Romney cross ewe hoggets fed willow (Salix spp.) fodder during autumn near Masterton, New Zealand (Ramírez-Restrepo et al., 2010). All animals had unlimited access to water at all times. Samples were taken from different parts of the rumen, mixed and then frozen immediately at −80 °C and subsequently lyophilized. The samples were then homogenized (1–2 min) in a 100 W household coffee grinder (Russell Hobbs, Mordialloc, Vic., Australia) and stored at −80 °C until DNA was extracted.
Total DNA extraction and PCR
Total DNA was extracted from 100 mg of ground freeze-dried rumen sample using the QIAamp DNA stool mini kit (Qiagen, Hilden, Germany) according to the manufacturer's protocol. The extracted DNA was used as a template for PCR to amplify the 16S rRNA genes of total archaea, total bacteria and the RCC group of archaea. The primers used in this study are listed in Table 1. Forward primers used to amplify 16S rRNA genes for denaturing gradient gel electrophoresis (DGGE) analysis included a GC-clamp at the 5′-terminus (Table 1). All the PCR were performed in a Px2 thermal cycler (ThermoElectron, Milford, MA) and the resultant PCR products were analyzed using agarose gel (1.5% w/v) electrophoresis before DGGE or cloning.
Primers used in this study to target 16S rRNA genes of total archaea, total bacteria and archaea of the RCC group
| Target | Primers | Sequence (5′–3′) | References |
| Archaea | 109f | ACKGCTCAGTAACACGT | Großkopf et al., (1998) |
| 915af | AGGAATTGGCGGGGGAGCAC | Watanabe et al., (2004) | |
| 915r | GTGCTCCCCCGCCAATTCCT | Watanabe et al., (2004) | |
| 1386r | GCGGTGTGTGCAAGGAGC | Skillman et al., (2004) | |
| Bacteria | 27f | GAGTTTGATCMTGGCTCAG | Modified from Lane (1991) |
| 338f | ACTCCTACGGGAGGCAGCAG | Lane et al., (1991) | |
| 518r | ATTACCGCGGCTGCTGG | Muyzer et al., (1993) | |
| 519f | CAGCMGCCGCGGTAANWC | Lane (1991) | |
| 907r | CCGTCAATTCMTTTRAGTTT | Lane (1991) | |
| 1492r | GGYTACCTTGTTACGACTT | Modified from Lane (1991) | |
| RCC | 762f | GACGAAGCCCTGGGTC | This study |
| 1099r | GAGGGTCTCGTTCGTTAT | This study |
Where the primer name is prefaced by ‘GC-’ in the text, a GC-clamp was added to the 5′-terminus of the primer. The GC-clamp sequence was 5′-CGCCCGCCGCGCGCGGCGGGCGGGGCGGGGGCACGGGGGG-3′.
The archaea-specific primers GC-915af and 1386r were used to amplify a 491-bp product covering the V6-V8 region of the 16S rRNA gene for DGGE. The PCR (50 μL) contained 5 μL of 10 × reaction buffer without MgCl2 (Roche, Auckland, New Zealand), 1.5 mM MgCl2, 1 μM of each primer, 200 μM of each dNTP, 2.5 U of Taq DNA polymerase (Roche), 25 ng of template DNA and DNA-free water. DNA-free water was prepared by filtering distilled water through a 0.2-μm pore-size sterile filter, autoclaving the water and then irradiating 2-mL aliquot in 2-mL polypropylene tubes with UV light (254 nm, 6 W) at a distance of 100 mm for 4 h. The amplification was performed using the following cycling parameters: an initial denaturation for 2 min at 95 °C; 25 cycles each of denaturation for 15 s at 95 °C, annealing for 30 s at 59 °C and primer extension for 1 min at 72 °C; and a final extension of 1 h at 72 °C to overcome double-banding problems sometimes observed within DGGE (Janse et al., 2004).
Archaeal 16S rRNA gene clone libraries were constructed from DNA fragments amplified using two primer pairs, 109f plus 915r and 915af plus 1386r, from DNA extracted from the sample obtained from sheep no. 4 fed winter pasture. The reaction mixture and the cycling parameters were the same as those used for the amplification of archaeal 16S rRNA genes for DGGE, except that the final extension time used for both these primer pairs was 7 min and the annealing temperature with the primer pair 109f plus 915r was 57 °C.
Part of the bacterial 16S rRNA gene (V2-V3 region) was amplified with the bacteria-specific primer pair GC-338f plus 518r (Muyzer et al., 1993). The reaction mixture was the same as that used to amplify archaeal 16S rRNA genes above, and the amplification was performed using the following touchdown PCR protocol: an initial denaturing for 3 min at 95 °C; 10 cycles each of denaturing for 30 s at 95 °C, annealing for 30 s initially at 62 °C and decreasing by 0.5 °C per cycle and primer extension for 30 s at 72 °C; 26 cycles each of denaturing for 30 s at 95 °C, annealing for 30 s at 57 °C and primer extension for 30 s at 72 °C; and a final extension for 30 min at 72 °C.
An alignment of 81 16S rRNA gene sequences assigned to RCC (Janssen & Kirs, 2008) was analyzed for conserved regions. Two primers, 762f and 1099r (Table 1), were designed to amplify a region of the 16S rRNA gene of this group. In total, 88% of the sequences contained primer target regions with perfect matches to the primers, and 98% of the sequences contained primer target sites with no or only one mismatch. A clone library (24 sequences) was constructed using this primer pair to confirm that only 16S rRNA genes from RCC were amplified. The template DNA was extracted from a rumen sample from cow no. 2 fed silage. The reaction mixture for the PCR was the same as that used for the amplification of total archaeal 16S rRNA genes. Amplification was performed with the following parameters: an initial denaturing for 2 min at 94 °C; 30 cycles each of denaturing for 30 s at 94 °C, annealing for 60 s at 56 °C and primer extension for 1 min at 72 °C; and a final extension for 7 min at 72 °C. For the PCR to amplify fragments for DGGE analysis, the primer pair GC-762f and 1099r was used, and the final extension time was increased to 1 h.
DGGE
PCR products were purified using a Wizard SV gel and PCR clean-up system (Promega, Alexandria, NSW, Australia) and quantified using a NanoDrop ND-1000 UV-Vis Spectrophotometer (NanoDrop Technologies, Wilmington, DE). Subsequently, the purified PCR products were treated with mung bean nuclease to remove interfering single-stranded DNA products, as described by Kocherginskaya (2001). The reaction mixture, containing 15 μL of purified PCR products, 3 μL of 10 × mung bean nuclease buffer (pH 5.0), 1.7 U of mung bean nuclease (Promega) in 1 μL of water and 30 μL water, was incubated at 37 °C for 10 min. The reaction was stopped by adding 10 μL of DGGE loading dye (0.05% w/v bromophenol blue, 0.05% w/v xylene cyanol, 70% w/v glycerol, in water, pH 8.0) and immediate chilling on ice. The reference standard for DGGE was created by combining equal quantities of PCR products generated using the primers GC-915af and 1386r from DNA extracted from pure cultures of methanogen obtained from the Deutsche Sammlung von Mikroorganismen und Zellkulturen (Braunschweig, Germany) or from the AgResearch culture collection. These cultures, with their culture collection accession numbers (DSM) or the GenBank accession numbers of their 16S rRNA gene sequences and the band labels a–h in Fig. 1a, were Methanobrevibacter gottschalkii strain HO (DSM 11977, band a), Methanobrevibacter thaueri strain CW (DSM 11995, band b), Methanobrevibacter smithii strain PS (DSM 861, band c), Methanospirillum hungatei strain JF1 (DSM 864, band d), Methanosarcina barkeri strain CM1 (GenBank AJ002476, band e), Methanobacterium formicicum strain BRM9 (GenBank X99138, band f), M. ruminantium strain 31A (GenBank HM624055, band g) and M. ruminantium strain M1 (DSM 1093, band h). The same reference standard mixture was used in all DGGE gels. DGGE was performed using a CBS scientific DGGE/TTGE gel system (C.B.S. Scientific Company, Del Mar, CA). Polyacrylamide gels (6% w/v) were prepared and electrophoresed with 1 × TAE buffer, which consisted of 40 mM tris(hydroxymethyl)aminomethane, 65 mM acetic acid and 1 mM EDTA, adjusted to pH 8.0 with NaOH. The gels for separating PCR products contained a gradient of denaturant that increased in the direction of electrophoresis, with a 30–55% v/v gradient for total archaeal products, a 40–60% v/v gradient for total bacterial products and a 15%–70% v/v for products amplified from RCC. The 100% denaturant solution contained 40% v/v formamide and 7.0 M urea. Purified and mung bean nuclease-treated PCR products (300 ng) were loaded into each well. Electrophoresis was performed at 150 V (constant voltage) and 60 °C (constant temperature) for 6 h. The gels were stained with 3.0 μL of SYBR Gold (10 000 × concentrate in DMSO; Invitrogen, Carlsbad, CA) in 600 mL of water for 20 min and destained in 600 mL of water for 30 min. The gels were viewed using UV transillumination and photographed using a Gel Logic 200 imaging system (Eastman Kodak, New York, NY).
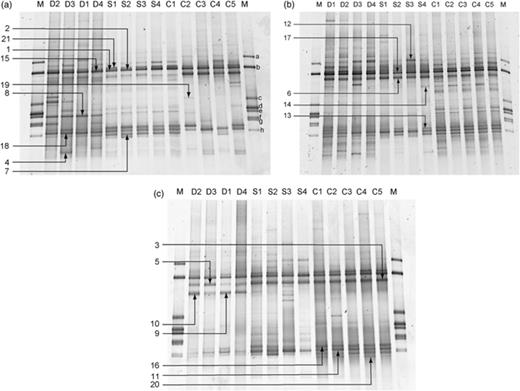
DGGE fingerprints of ruminal archaea in red deer (D1–D4), cattle (C1–C5) and sheep (S1–S4) fed (a) summer pasture, (b) winter pasture and (c) silage. The labelled arrows indicate the bands that were excised and sequenced. The marker (M) consisted of amplicons of 16S rRNA genes from pure culture of methanogens, and are labelled a–h (see Materials and methods for details). The sample from sheep no. 4 fed winter pasture was used to generate clone libraries of 16S rRNA gene sequences using different primer combinations (see text).
To extract DNA from DGGE bands, selected bands were cut from the gel using a clean, sharp scalpel and transferred to a 1.5-mL microcentrifuge tube. DNA was eluted from polyacrylamide gel slices according to the method described by Etokebe & Spurkland (2000). Gel slices were each washed by incubation in 50 μL of water for 15 min at room temperature. The water was then removed and discarded. DNA was recovered by the addition of 50 μL of UV-treated water to each tube, followed by incubation overnight at 4 °C in 1.5-mL tubes. The tubes were vortexed for 5 s, centrifuged for 1 min at 10 000 g and the supernatants were transferred to clean tubes. The DNA fragments in the supernatants were cloned as described below. Positive clones were reamplified with the primers GC-915af and 1386r, and DGGE was performed to confirm the position of migration. At least three clones from each band were sequenced.
Cloning and sequencing
Libraries of 16S rRNA genes of total archaea, RCC and bacteria, and from pure cultures of methanogens were prepared from PCR products produced as described above. PCR products were cloned by ligation into a plasmid vector (pCR 2.1; Invitrogen) and transformation into competent Escherichia coli TOP-10 cells, using a TOPO-TA cloning system (Invitrogen). Clones were randomly chosen and sequenced using the primers M13f (5′-CCCAGTCACGACGTTGTAAAACG-3′) or M13r (5′-AGCGGATAACAATTTCACACAGG-3′) at the Allan Wilson Centre Genome Sequencing Service (Massey University, Palmerston North, New Zealand) or Macrogen Inc. (Seoul, Korea).
Analysis of electrophoresis patterns
DGGE fingerprints were analyzed using the bionumerics software package (Applied Maths, Sint-Martens-Latem, Belgium). Each profile, consisting of a digitized image from the gel and representing one lane containing one separated PCR product, was normalized relative to the bands in the lane containing the reference standard. Similarities between the fingerprints were quantified using the Pearson correlation coefficient between each pair of profiles, and these values were represented graphically using the unweighted pair group method of arithmetic averages method. The Pearson correlation coefficient takes into consideration the presence and relative intensity of each band. The contribution of each band in a profile to that profile was calculated by Gaussian fit, in the bionumerics package, and expressed as a relative one-dimensional surface, which is essentially the intensity of the band as a percentage of the sum of intensities of all bands in the profile. To assess the significance of groupings, the distances between samples within a group were compared with the distances between samples from different groups in a t-test. Simpson's and Shannon's diversity indices were calculated from the relative one-dimensional surface metrics for all bands within a lane as a measure of proportional abundance (Sait et al., 2003).
Quantitative real-time PCR
The abundances of 16S rRNA genes from archaea, bacteria and members of RCC in rumen samples were quantified using a Rotor-Gene 6000 real-time rotary analyzer (Corbett Life Science, Concorde, NSW, Australia) and amplicon detection by SYBR Green I fluorescence (LightCycler FastStart DNA Master SYBR Green I Kit; Roche). Reactions were set up in a Gene-Disc 100 (Corbett Life Science) and sealed with a permanent adhesive film (Corbett Life Science). Each reaction contained, in a total volume of 20 μL, 10 μL SYBR green mix (Roche), 10 pmol of each primer, 4 μg bovine serum albumin (Invitrogen) and 5 μL of DNA. DNA amplification was performed on three different 10-fold dilutions of the template, each in duplicate, to yield six replicates for each sample. Archaeal 16S rRNA genes were amplified using the primers 915af and 1386r at an annealing temperature of 59 °C. Bacterial 16S rRNA genes were amplified using the primers 519f plus 907r (Stubner, 2004) at an annealing temperature of 52 °C. RCC 16S rRNA genes were amplified using the primers 762f and 1099r at an annealing temperature of 56 °C. Amplification commenced with a hot start of 95 °C for 10 min, followed by 50 cycles of 95 °C for 10 s, the appropriate annealing temperature for 5 s and extension at 72 °C for 10 s. After each run, melting curves between 72 and 98 °C were evaluated for each PCR to confirm the absence of unspecific signals. Quantitative PCR efficiency was checked using the software linregpcr (Ruijter et al., 2009). The copy numbers of 16S rRNA genes of targeted groups were calculated based on the dilutions made and the DNA yield per gram of dry rumen contents.
External standards for archaea were prepared mixing equal quantities of plasmids containing 16S rRNA gene fragments amplified using the primers 915af plus 1386r from pure cultures of M. ruminantium strain M1 (DSM 1093), Methanomicrobium mobile strain BP (DSM 1539) and Methanobacterium bryantii strain M.o.H (DSM 863). These isolates were obtained from the Deutsche Sammlung von Mikroorganismen. External standards for RCC were prepared by mixing equal quantities of three plasmids containing 16S rRNA gene fragments amplified by the RCC-specific primers (762f and 1099r) from rumen contents from cow no. 2 fed silage [NZCRCC007 (GenBank accession number HM624062), NZCRCC011 (HM624066) and NZCRCC014 (HM624069)]. A plasmid containing a 16S rRNA gene fragment (GenBank accession number HQ625384) amplified with the bacteria-specific primers 27f and 1492r from rumen contents of sheep no. 4 fed winter pasture was used as the external standard for the quantification of bacterial 16S rRNA genes. The plasmid copy numbers in the standards were calculated based on the plasmid concentration determined by the Quant-iT kit (Invitrogen). Appropriate external standards ranging from 1.0 × 10³ to 1.0 × 10⁷ copies per reaction were prepared and used with every quantitative PCR run to enumerate the archaea, RCC and bacteria in the extracted DNA from the rumen samples.
Differences in 16S rRNA gene abundances were analyzed by anova of log-transformed data, using genstat 12th edition (VSN International, Hemel Hempstead, UK).
Phylogenetic analyses
All analyses were implemented in mega 4.0 (Tamura et al., 2007). Nucleotide sequences were globally aligned with clustalw using the IUB DNA matrix and a transition weight of 0.5. Phylogenetic trees were constructed using the neighbor-joining tree inference method (Saitou & Nei, 1987) with the Jukes–Cantor substitution model (Jukes & Cantor, 1969) assuming uniform rates among sites and using the complete deletion of gaps option. Bootstrap analyses were performed based on 1000 resamplings. The 16S rRNA gene sequences from Methanocaldococcus jannaschii JAL-1 (GenBank accession number M59126), Methanococcus vannielii SB (M36507) and Methanothermococcus thermolithotrophicus SN-1 (M59128) were used as outgroups.
Nucleotide sequence accession numbers
Nucleotide sequences from this study have been deposited in GenBank. Those from the DGGE bands have been deposited in the GenBank database under accession numbers GU329839–GU329883. The 95 and 103 sequences of the cloned PCR-amplified archaeal 16S rRNA genes amplified from sheep no. 4 using two different primer sets, 915af plus 1386r and 109f plus 915r, have been deposited in GenBank under accession numbers HM211304–HM211398 and GU329736–GU329838, respectively. The sequences of the 24 16S rRNA genes PCR-amplified from members of RCC from cow no. 2 using primers 762f plus 1099r have been deposited in the GenBank database under accession numbers HM624056–HM624079.
Results
General archaeal community structure
Based on data from the literature (Table 2), we identified 16 primer-binding sites used by previous researchers to amplify partial 16S rRNA genes from archaea. Because we planned to use these primers to amplify fragments for DGGE analysis, we selected only regions that required no degeneracies in the matching oligonucleotides used as primers, because degeneracies can result in multiple bands being generated from a single target sequence (Kowalchuk et al., 1997). The match of these regions to 16S rRNA genes of archaea was examined (Table 2). We chose to use primers 915af and 1386r (Table 1), which target sites 8 and 12, respectively (Table 2), because each primer matched ≥86% of archaeal 16S rRNA gene sequences, and because they had previously been validated and used successfully by Nicholson et al., (2007). No known clade of rumen archaea identified by Janssen & Kirs (2008) was excluded using these primers.
Primer-binding sites considered for targeting the archaeal 16S rRNA gene for DGGE analysis
| Sites | Position | Target sequence (5′–3′) | Number of sequences tested | Match (%) | References |
| 1 | 6–22 | ATTCCGGTTGATCCTGC | 339 | 49.9 | Arahal et al., (1996) |
| 2 | 8–25 | TCCGGTTGATCCTGCCGG | 726 | 59.6 | Kolganova et al., (2002) |
| 3 | 112–127 | GCTCAGTAACACGTGG | 1326 | 54.6 | Großkopf et al., (1998) |
| 4 | 334–348 | TCCAGGCCCTACGGG | 1326 | 37.5 | Reysenbach & Pace (1995) |
| 5 | 344–363 | ACGGGGTGCAGCAGGCGCGA | 1326 | 9.7 | Casamayor et al., (2002) |
| 6 | 781–797 | AACCGGATTAGATACCC | 1326 | 79.1 | Ihara et al., (1997) |
| 7 | 913–934 | AAAGGAATTGGCGGGGGAGCAC | 1326 | 86.5 | García-Martínez & Rodríguez-Valera (2000) |
| 8 | 915–934 | AGGAATTGGCGGGGGAGCAC | 1326 | 86.7 | Casamayor et al., (2002) |
| 9 | 1093–1111 | AGTCAGGCAACGAGCGAGA | 1326 | 49.7 | Weisburg et al., (1991) |
| 10 | 1100–1114 | CAACGAGCGAGACCC | 1326 | 53.8 | Reysenbach & Pace (1995) |
| 11 | 1100–1115 | CAACGAGCGAGACCCA | 1326 | 16.9 | Embley et al., (1992) |
| 12 | 1385–1402 | GCTCCTTGCACACACCGC | 1325 | 90.4 | Skillman et al., (2004) |
| 13 | 1386–1401 | CTCCTTGCACACACCG | 1325 | 90.8 | Wright & Pimm (2003) |
| 14 | 1482–1512 | AAGTCGTAACAAGGTAGCCGT | 562 | 71.2 | Wood et al., (1998) |
| 15 | 1491–1510 | AGTCGTAACAAGGTAACC | 562 | 13.3 | Achenbach & Woese (1995) |
| 16 | 1492–1510 | AAGTCGTAACAAGGTAACC | 562 | 13.3 | Weisburg et al., (1991) |
Numbering according to the 16S rRNA gene of Escherichia coli (Brosius et al., 1978).
Number of sequences with sequence information that could be compared.
We generated DGGE fingerprints of partial 16S rRNA gene fragments from the mixed archaeal communities in samples of rumen contents from the same five cattle, four sheep and four red deer fed summer pasture (Fig. 1a), winter pasture (Fig. 1b) and silage (Fig. 1c). Overall, there were few major differences between the DGGE profiles produced from these animals, despite differences in the host species and diets. To confirm these general findings, additional analyses were performed on rumen contents from different flocks of sheep fed on different diets (Figs 2 and 3). The DGGE fingerprints of the ruminal archaeal communities from these four different flocks of sheep from two different locations fed four different diets (winter pasture, autumn pasture, willow and a concentrate-based diet) were remarkably similar to each other, and to the other samples from sheep, cattle and red deer (Fig. 1). In addition, and to avoid making intergel comparisons, DGGE was performed to compare directly the methanogen community fingerprints when the same animals were fed different diets (data analysis shown in Fig. 4). The patterns of bands were similar in all cases, with only some minor variations.
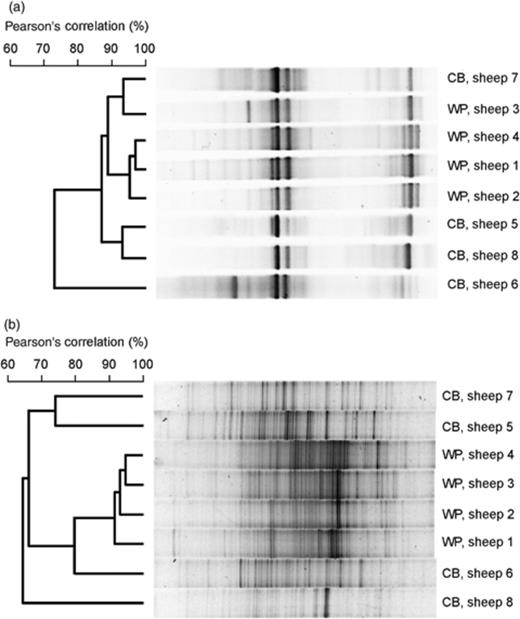
DGGE fingerprints of (a) ruminal archaea and (b) ruminal bacteria in two different flocks of sheep fed winter pasture (WP) or a concentrate-based diet (CB). The similarities of the fingerprints are indicated in the dendrograms to the left of each panel. Individual lanes are not in the same order as they were on the original gels, but those in each panel are from one gel. The gel origin is on the left.
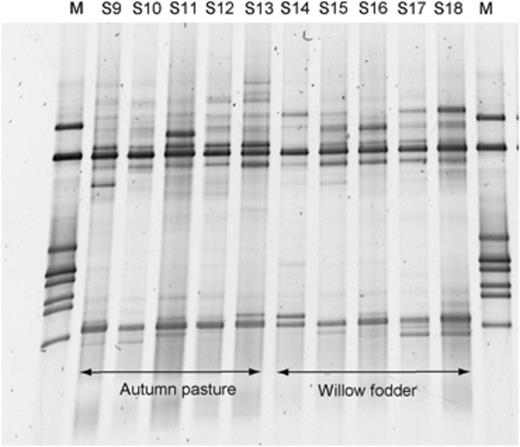
DGGE fingerprints of ruminal archaea in two different flocks of sheep fed autumn pasture (perennial rye grass/white clover mix) or willow fodder (Salix spp.). The markers (M) are the same as those in Fig. 1.
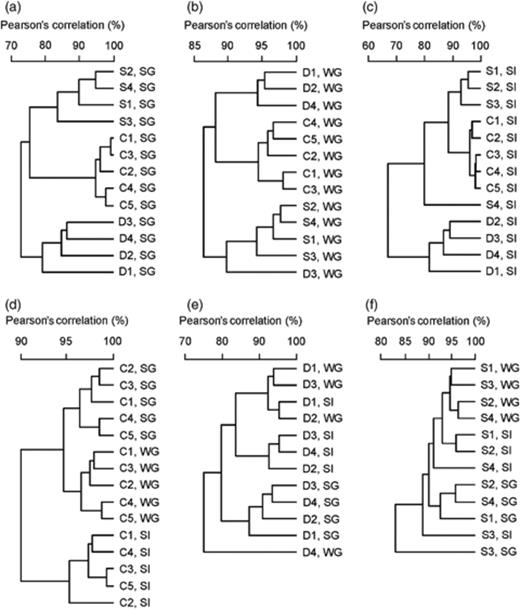
Similarities of DGGE profiles of ruminal archaea in the same group of cattle (C1–C5), red deer (D1–D4) and sheep (S1–S4) fed summer pasture (SG), winter pasture (WG) and silage (SI). Each panel represents the similarities of band patterns of lanes on a separate DGGE gel. (a) Cattle, red deer and sheep fed summer pasture. (b) Cattle, red deer and sheep fed winter pasture. (c) Cattle, red deer and sheep fed silage. (d) Cattle fed summer pasture, winter pasture and silage. (e) Red deer fed summer pasture, winter pasture and silage. (f) Sheep fed summer pasture, winter pasture and silage.
Variations due to host species and diet
In general, DGGE fingerprints from cattle (six to nine bands) and red deer (six to 11 bands) contained more bands than those from sheep (four to nine bands). However, patterns from red deer rumen samples showed a wide variation in the number of bands present. In addition, samples from animals fed pasture (summer or winter) yielded comparatively more bands overall (six to 12 bands) than samples from animals fed silage (four to eight bands). Only bands that constituted ≥5% of the total profile were considered here.
Cluster analysis (Fig. 4) was performed to examine the potential effects of diet (summer pasture, winter pasture and silage) on archaeal community structure in the same cattle (n=5), sheep (n=4) and red deer (n=4). The three different ruminant species had different archaeal communities on all three diets tested: summer pasture (Fig. 4a; P=1.5 × 10⁻¹⁹), winter pasture (Fig. 4b; P=9.8 × 10⁻¹⁰) and silage (Fig. 4c; P=2.8 × 10⁻¹²). The banding patterns from the cattle directly reflected the diet, with all samples grouping by diet rather than individual animal (Fig. 4d; P=3.5 × 10⁻²³). Samples from cattle fed summer pasture and winter pasture were more similar to each other than they were to samples from silage-fed cattle. There was no clear separation between the archaeal communities in red deer fed silage and winter pasture, but samples from red deer fed summer pasture grouped coherently and with less variability. Overall, there was support for diet-based differences in archaeal community structure in red deer (Fig. 4e; P=0.004). Samples from sheep were intermediate in variability and showed no cohesive clustering by diet (Fig. 4f; P=0.32). These differences seemed to be attributable to obvious differences in the presence of bands (Fig. 1).
To assess the degree of short-term temporal variability, samples were collected 2, 4, 6 and 8 h after feeding silage to cattle, sheep and red deer. The methanogen communities in these samples were analyzed by DGGE using samples from one cow, one sheep and one red deer. The DGGE profiles at the different sampling times were all >95% similar to each other (Fig. 5). Interestingly, the sample 2 h after feeding was the most different, and the other time points grouped in the same way for all three animals. This shows that variations in sampling time probably had very little impact on the community structures observed in our experiments.
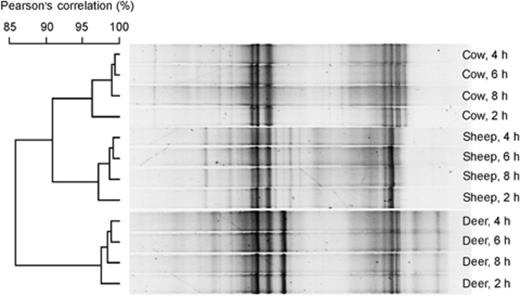
DGGE profiles showing the stability of archaeal communities in a cow, a red deer and a sheep, 2, 4, 6 and 8 h after feeding silage. The similarities of the band patterns are indicated by the dendrogram to the left of the gel image. Individual lanes are not in the same order as they were on the original gel, but all are from the same gel. The gel origin is on the left.
Comparison with bacterial communities
To compare the degree of variation in the rumen archaeal community with that in the bacterial community, the DGGE patterns of partial 16S rRNA genes from bacteria were generated from rumen samples collected from two different groups of sheep. One group was fed winter pasture and the second was fed a concentrate-based diet. The banding patterns in the DGGE profiles generated from bacterial 16S rRNA genes were considerably more complex than those obtained from the methanogen 16S rRNA genes in the same samples (Fig. 2). Both the bacterial (P=3.4 × 10⁻⁴) and the archaeal (P=0.04) communities were more different between individuals on the concentrate-based diet than on the winter pasture diet.
We assessed whether there was less variability between the methanogen communities of individual sheep than between the bacterial communities of the same individuals. The similarity of the methanogen and bacterial communities in all pairwise comparisons of eight sheep (four fed winter pasture and four fed concentrate-based diet, 28 pairwise comparisons) was determined. The bacterial communities of any pair of individuals were, on average, 18.9% less similar than were the methanogen communities of that same pair of sheep (P=8.3 × 10⁻⁷, paired t-test, n=28). The difference increased to 24.7% when the comparisons were limited to pairs of animals on different diets (P=1.1 × 10⁻⁸, paired t-test, n=16).
Identity of dominant archaea
To identify the dominant archaea present in the rumen, dominant bands that constituted >8% of any profile and that appeared to be common to most of the animals were excised from DGGE gels and sequenced. In addition, some of the bands that were not common to all the animals were also excised to identify some of the archaea that represented the minor variations in community structure. A total of 86 sequences were obtained from clones prepared from the 21 bands selected (indicated by numbered arrows in Fig. 1). A phylogenetic dendrogram was constructed to display the apparent relatedness of the sequences to each other and to reference sequences (Fig. 6). Sequences from any one band displayed small differences, indicating that different variants were present. These may have arisen during the PCR, from different genes in the same genome, or from different strains. However, the variations were small, and the sequences from any one band always fell into the same clade (Fig. 6).
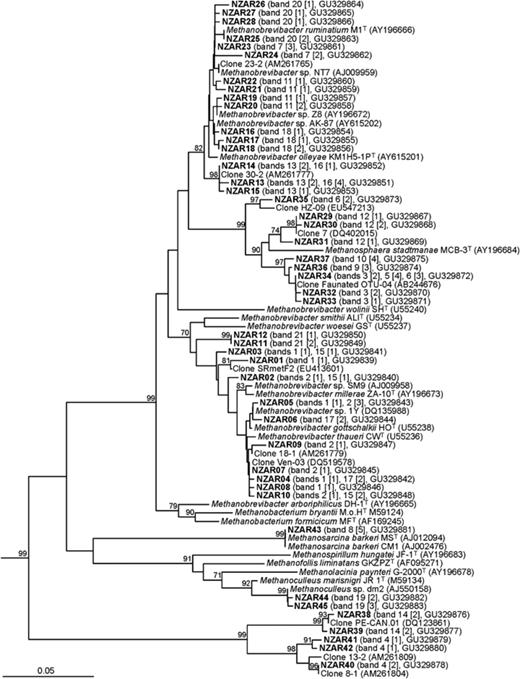
Inferred phylogenetic relationships between partial 16S rRNA genes derived from excised DGGE bands (bold) and reference 16S rRNA gene sequences. In the parentheses are the band number and the number of clones (in brackets) from which the sequences were derived, and the GenBank accession numbers. The band numbers correspond to those in Fig. 1. The superscript T designates a type strain. The tree was constructed from an alignment of 425 nucleotide positions. Bootstrap values (>70%) are shown at selected nodes, and are percentages based on 1000 resamplings. The scale bar indicates 0.05 nucleotide substitutions per nucleotide position. The 16S rRNA genes of Methanocaldococcus jannaschii (GenBank accession number M59126), Methanococcus vannielii (M36507) and Methanothermococcus thermolithotrophicus (M59128) were used as outgroup sequences, and are not shown in the figure.
Overall, the sequences grouped into six different clades of archaea: relatives of M. ruminantium, relatives of M. gottschalkii, Methanosphaera spp., Methanosarcina spp., Methanoculleus spp. and RCC. Of these, bands identified as originating from the M. ruminantium clade, the M. gottschalkii clade and from Methanosphaera spp. were common to all three animal species. The sequences affiliated with the M. ruminantium clade, represented by up to four bands, were very similar to the 16S rRNA gene sequence from M. ruminantium and Methanobrevibacter olleyae. The sequences that fell into the M. gottschalkii clade were related to M. gottschalkii, M. thaueri and Methanobrevibacter millerae. The sequences affiliated with Methanosphaera spp. formed two clear subclusters supported by high bootstrap values, together with another lineage represented by only one sequence, suggesting that there was more than one species of Methanosphaera in these rumen samples. The RCC sequences grouped separately from the other five clades.
Diversity of RCC
We generated DGGE profiles using a primer set that amplified partial 16S rRNA genes of members of the RCC group, and compared the RCC community structure in sheep, cattle and red deer fed summer pasture (Fig. 7). These were the same samples as those used to generate the total archaeal profiles shown in Fig. 1a. The new analysis revealed a larger number of bands (mean=22.8, SD=3.5) than those found using universal archaeal primers (mean=11.2, SD=2.6), indicative of a more even diversity (P=7.1 × 10⁻⁸, paired t-test). Similarly, Simpson's and Shannon's diversity indices were greater for the profiles generated using RCC-targeted primers than using archaea-targeted primers. The mean Simpson's diversity indices were 16.9 (SD=3.1) and 9.1 (SD=2.2) for RCC and archaea, respectively (P=1.1 × 10⁻⁶, paired t-test), and the mean Shannon's diversity indices were 2.94 (SD=0.17) and 2.26 (SD=0.27) for RCC and archaea, respectively (P=1.6 × 10⁻⁶, paired t-test).
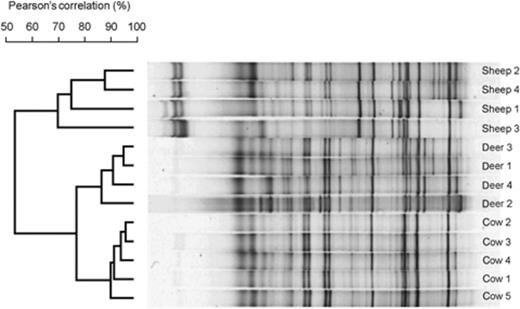
DGGE fingerprints of RCC in sheep, red deer and cattle fed summer pasture. The similarities of the band patterns are indicated by the dendrogram to the left of the gel image. Individual lanes are not in the same order as they were on the original gel, but all are from the same gel. The gel origin is on the left.
The variation between the RCC communities of individual animals was greater among the samples from sheep than among the red deer or cattle (Fig. 6). There was a clear grouping by ruminant species (P=6.1 × 10⁻¹³). More bands (P=0.008–0.024 for the different pairwise comparisons by ruminant species) were detected in the samples from the red deer (mean=26.8, SD=2.6) than in those from the cows (mean=21.8, SD=2.3) and sheep (mean=20.3, SD=1.7).
Validation of DGGE data
To compare the species composition of the archaeal community, as determined by DGGE, with another method, we selected one of the sheep (no. 4 in Fig. 1b) fed winter pasture. Libraries of PCR-amplified 16S rRNA genes were prepared using two primer pairs, and randomly selected PCR products were sequenced and the sequences were placed phylogenetically by tree construction. The two primer sets, although amplifying different regions of the 16S rRNA gene, resulted in very similar library compositions (Table 3; P=0.11 in the χ2-test for differences). Three of the four major archaeal groups were the same as those that were also detected using DGGE, viz., the M. gottschalkii clade, the M. ruminantium clade and Methanosphaera spp. Both libraries contained sequences from the RCC group, making up 22% and 28% of the libraries. In addition, small numbers of sequences affiliated with other lineages were found (Table 3). The amount of sequence variation, measured as uncorrected sequence distances, was greatest (≥5.3%) among the sequences affiliated with RCC and lower (≤3.1%) among sequences affiliated with the other major groups (Table 3).
Abundance of different clades of archaea in the libraries of PCR-amplified 16S rRNA genes from rumen contents of sheep no. 4 fed winter pasture
The differences between sequences were calculated from percentage identities between pairs of aligned sequences.
Two sequences only basally affiliated with RCC, and one sequence from a Methanobrevibacter sp. outside the Methanobrevibacter gottschalkii and Methanobrevibacter ruminantium clades.
One sequence only basally affiliated with RCC, and one sequence from a Methanosarcina sp.
NA, not applicable.
The abundance of 16S rRNA genes from the total bacteria, total archaea and from members of the RCC clade of archaea in samples taken from different sheep on a range of diets was measured using quantitative real-time PCR. Bacterial 16S rRNA gene numbers ranged from 1.0 × 10¹¹ to 1.2 × 10¹² (mean=4.5 × 10¹¹, SD=3.8 × 10¹¹) copies per gram of dry rumen contents. Archaeal 16S rRNA genes were not as abundant, from 3.5 × 10⁹ to 6.2 × 10¹⁰ (mean=1.4 × 10¹⁰, SD=1.3 × 10¹⁰) copies per gram of dry rumen contents, and RCC 16S rRNA genes were less abundant again, from 1.3 × 10⁹ to 7.2 × 10⁹ (mean=2.6 × 10⁹, SD=1.2 × 10⁹) copies per gram of dry rumen contents. There was no detectable correlation between the number of bacterial and archaeal 16S rRNA genes in the samples (r=0.06), but RCC numbers were moderately correlated with the total archaeal numbers (r=0.64). On average, archaeal 16S rRNA genes were present at only 5.1% of the abundance of bacterial 16S rRNA genes, and the data suggest that RCC made up an average of 26.5% of the archaeal pool. anova of log-transformed data indicated that there were differences in archaeal (P=0.002) and bacterial (P<0.001) abundances between the different groups of sheep. Abundances of RCC groups did not appear to be significantly different (P=0.84) among the different groups of sheep.
Quantitative real-time PCR indicated that 16S rRNA genes from RCC made up 35.5% of the archaeal pool in sheep no. 4 fed winter pasture, in agreement with clone library estimates of 22–28% (Table 3).
Discussion
General archaeal community structure
DGGE fingerprints of methanogens from different species of ruminants (sheep, cattle and red deer) fed different diets (autumn pasture, winter pasture, summer pasture, silage, a concentrate-based diet and willow) were all similar. Time after feeding also had very little impact on the community composition. The overall similarity of most of the profiles suggests that similar dominant archaeal populations were present in these animals, despite being from different individuals and different ruminant species or being fed different diets or kept at different places. Similar findings were reported by Ouwerkerk et al., (2008), who observed no major differences among DGGE patterns when they examined the methanogen communities of cattle and sheep fed a variety of forages (hay from different grass types, Leucaena spp.-grass mix, lucerne pellets and fresh grass). Ouwerkerk et al., (2008) did observe greater variation between methanogen communities in individuals fed a barley-based diet, and these patterns were different from those fed forages. The higher grain content (75% w/w) in these diets compared with ours (45% w/w) may have been the reason for this. High grain contents can result in lower ruminal pH values, which may adversely affect some methanogen species (Lana et al., 1998).
Dominant archaea
Based on the 16S rRNA gene sequences of common dominant bands in our DGGE gels, we suggest that three groups of known methanogens dominate New Zealand ruminants: species affiliated with the M. gottschalkii clade; species affiliated with the M. ruminantium clade; and Methanosphaera spp. The overall dominance of Methanobrevibacter spp. is in agreement with previous clone library-based and TTGE/DGGE-based studies performed on different species of ruminants fed with different diets all over the world (Janssen & Kirs, 2008; Pei et al., 2008; Cheng et al., 2009; Williams et al., 2009; Zhou et al., 2009).
Our finding of Methanosphaera spp. as a dominant group in New Zealand ruminants is consistent with the studies reported by Nicholson (2007) and Skillman (2006) on a more limited range of ruminants and diets. Phylogenetic analysis of sequences from our study showed two major clusters of Methanosphaera spp. Methanosphaera spp. have not yet been isolated from the rumen, but their presence in the rumen has been implicated in several studies (Wright et al., 2004, 2006, 2007; Pei et al., 2008; Hook et al., 2009). Whitford et al., (2001) reported the presence of Methanosphaera spp. in ruminants for the first time, and suggested that there may be more than one species of Methanosphaera. Comparative analysis of the sequences from our study also supports this statement. Methanosphaera stadtmanae is the only known member of the order Methanobacteriales that can generate methane only by the reduction of methanol with H2. Rumen Methanosphaera spp. may require the methanol released during the fermentation of pectins as its primary carbon source for growth (Fricke et al., 2006). Fresh forages rich in pectin may be the reason for this high occurrence of Methanosphaera spp. in New Zealand ruminants. However, all the phylotypes of Methanosphaera spp. may not display the same phenotype, and isolation of rumen Methanosphaera spp. will be required to provide more information of their gene complement and physiology.
Although members of the genus Methanomicrobium have been reported as one of the dominant groups of methanogens in rumen (Janssen & Kirs, 2008; Chaudhary & Sirohi, 2009), this has not been confirmed for New Zealand ruminants. No dominant bands representing this group were found in any of the samples we analyzed. The genus Methanomicrobium belongs to the order Methanomicrobiales and two species of methanogens belonging to this order have been isolated from rumen: M. mobile (Paynter & Hungate, 1968) and Methanoculleus spp. (Joblin, 2005). We did find a band that originated from a Methanoculleus spp. in one sample, confirming their presence in at least some New Zealand ruminants.
RCC archaea
According to Janssen & Kirs (2008), the RCC group contributed 15.8% of total archaea in their global data set. RCC is a group of uncultured archaea found to be abundant in some libraries of archaeal 16S rRNA genes (Tajima et al., 2001b; Wright et al., 2006, 2007; Nicholson et al., 2007; Williams et al., 2009). They may not be universally present, as some studies have reported finding no evidence for the presence of members of this group (Skillman et al., 2006; Wright et al., 2008; Hook et al., 2009; Zhou et al., 2009). Our DGGE fingerprints of total archaeal communities did not reveal any common dominant bands of that group in all the rumen samples. However, we found two bands (bands 4 and 14) corresponding to that group: one in red deer fed with summer pasture and one in sheep fed with winter pasture. These two bands were from widely different places in the gel, and represented different sequence types. It is probable that there are other bands corresponding to this group present in various places in the gels, but that these were less intensely stained because of the low abundance of any one sequence type.
Libraries of PCR-amplified 16S rRNA genes prepared from a sample from one of the sheep (no. 4, fed with winter pasture) used in our study revealed that 22–28% of the sequences were from members of RCC. This was confirmed by the quantitative PCR analysis of 16S rRNA gene abundances in the same sample, which suggested that RCC made up 35.5% of archaeal 16S rRNA genes in that sample and an average of 26.5% of archaeal 16S rRNA gene sequences in sheep on a range of diets. The moderate correlation of RCC and total archaeal numbers indicates that they form a relatively constant part of the total archaeal community. Sequences falling into RCC displayed more sequence-to-sequence variation than did sequences falling into other archaeal groups in our sample. DGGE analysis of RCC 16S rRNA genes confirmed this, with a greater number of bands detected than when analyzing the total archaeal community. Because RCC is a subgroup of archaea; this indicates that there is a much greater diversity of archaea than is detectable using DGGE targeting total archaea, with each sequence type being too rare to be detected in PCR products dominated by the few very abundant archaeal groups. The analysis of a large number of sequences from multiple libraries (Janssen & Kirs, 2008) indicates that the RCC group displays considerable variation in sequence types that fall into a number of distinct lineages and may, therefore, represent a number of distinct species and genera. The abundance of any one sequence type is low; hence, members of this group are not readily observed by DGGE using domain-level primers.
We confirmed the presence of many different bands attributable to RCC by performing DGGE using primers targeting this group. RCC community patterns were different in sheep, cows and red deer fed the same diet. Members of RCC may be methane-producing microorganisms (Nicholson et al., 2007), but because their physiology is not known, it is not possible to speculate on the reason for these host-based differences. We have not examined diet-specific differences in RCC community composition.
Effect of host and diet on archaeal community
Even though the general archaeal community composition was very similar in all samples, we did find that the archaeal communities of the different ruminant species tested (cattle, sheep and red deer) were distinctive, regardless of the diet, indicating host-specific community structures. We also found that, within ruminant species, archaeal communities in cattle were different when different diets were fed, but that this was not as strong with red deer, and not detectable in sheep. While the major clades of archaea detected were similar in all samples, the differences were in minor parts of the communities, and subgroups within major clades. The amount of variation in the archaeal communities was less than in the bacterial communities of the same animals, and there were fewer detectable bands on DGGE gels of archaeal 16S rRNA genes than of bacterial 16S rRNA genes.
When red deer were fed with summer pasture, a Methanosarcina spp. was found as one of the dominant bands in all of the red deer. In addition, the samples from silage-fed red deer contained a Methanosphaera spp. of a different sequence type that resulted in a DGGE band distinct from those formed from other Methanosphaera spp. These two distinct bands were largely absent when these same red deer were fed winter pasture. It has been found that red deer exhibit strong seasonal cycles of rumen digestive function, with increased rumen retention time in summer (Freudenberger et al., 1994). Methanosarcina spp. grow relatively slowly and have higher Km values for H2 than other methanogens (Zinder, 1993) and they would be washed out of the rumen unless the flow through the rumen is slowed. The unusual digestive physiology of red deer may also partly be the reason for the high variation in their banding patterns compared with cattle and sheep. To our knowledge, there have been no published studies on the rumen methanogens of red deer. (Sundset 2008, 2009) have reported studies on the diversity of rumen methanogens in Norwegian and Svalbard reindeer. They found that the methanogens present in the reindeer were similar to the methanogens found in domesticated ruminants (cattle and sheep). Our study shows that the same is true of domesticated red deer.
Several studies have found host-species differences on the bacterial community of the rumen (Sundset et al., 2007; Shi et al., 2008). Effects of diet on changes on the diversity of bacterial species in the rumen have also been reported (Kocherginskaya et al., 2001; Tajima et al., 2001a). Different microorganisms act on the ingested feed during feed fermentation, and the species composition can be expected to be strongly influenced by the properties of the feed. Therefore, it is expected that there should be differences in the bacterial communities in rumens when animals are fed different diets. We found the bacterial community to be more complex than the methanogen community. We also found that the amount of variation between bacterial communities of animals fed different diets, and between animals on the same diet, was significantly greater than variations between the archaeal communities. Most rumen methanogens grow with the H2 produced during the fermentation of the ingested feed. The rumen environment (T, pH, CO2, H2 and salts) is relatively constant over time. This is probably the reason why the diversity of methanogens in the rumen of different ruminant species fed with different diets is relatively similar. The effect of diet was strongest in cattle, less so in red deer and not detectable in sheep. It is interesting to speculate that the observation of the effects of diet on cattle methanogen community relative to sheep and red deer is due to the fact that cattle rumens are much larger than those in either sheep or red deer. Cattle rumens may represent a more stable environment leading to less variability in methanogen community structure between individuals. Variation between individual sheep and red deer may be greater, masking the subtle diet effects.
All rumens sampled in this study contained remarkably similar archaeal communities, suggesting a common core of ruminal methanogen species. This is significant for efforts to develop methane mitigation strategies, as it limits the number of methanogen groups that need to be targeted to control the majority of methane producers. It is unclear, however, whether the minor components of the methanogen community are specialists occupying narrow niches with limited capacity to contribute to the total methane production or whether they will increase in abundance if the dominant groups are eliminated.
Acknowledgements
We thank Matthew Deighton, Debjit Dey, Graham Naylor, David Pacheco, Geoff Purchas, Carlos Ramírez-Restrepo, Natasha Swainson and Catherine Tootill for providing rumen samples or aiding with their collection. J.J. was supported by a Commonwealth Postgraduate Scholarship funded by NZAID. This work was funded under contract to the Pastoral Greenhouse Gas Research Consortium.
References
Author notes
Present address: Marek Kirs, Cawthron Institute, Nelson, New Zealand.
