


Abstract
Real-time PCR and PCR-denaturing gradient gel electrophoresis (DGGE) approaches that specifically target the Variovorax 16S rRNA gene were developed to estimate the number and diversity of Variovorax in environmental ecosystems. PCR primers suitable for both methods were selected as such that the enclosed sequence showed maximum polymorphism. PCR specificity was maximized by combining PCR with a targeted endonuclease treatment of template DNA to eliminate 16S rRNA genes of the closely related Acidovorax. DGGE allowed the grouping of PCR amplicons according to the phylogenetic grouping within the genus Variovorax. The toolbox was used to assess the Variovorax community dynamics in agricultural soil microcosms (SMs) exposed to the phenylurea herbicide linuron. Exposure to linuron resulted in an increased abundance within the Variovorax community of a subgroup previously linked to linuron degradation through cultivation-dependent isolation. SMs that were treated only once with linuron reverted to the initial community composition 70 days after linuron exposure. In contrast, SMs irrigated with linuron on a long-term base showed a significant increase in Variovorax number after 70 days. Our data support the hypothesis that the genus Variovorax is involved in linuron degradation in linuron-treated agricultural soils.
Introduction
Members of the genus Variovorax have been isolated repeatedly as degraders of xenobiotic organic compounds, both as single strains (Greene et al., 2000; Sørensen et al., 2005; Wang & Gu, 2006; Miwa et al., 2008) or as members of microbial consortia (Smith et al., 2005; Young et al., 2006; Breugelmans et al., 2007; Hussain et al., 2009). Compounds degraded by Variovorax include plant protection products such as isoproturon (Hussain et al., 2009), linuron (Sørensen et al., 2005) and atrazine (Smith et al., 2005), polycyclic aromatic hydrocarbons (Eriksson et al., 2003; Young et al., 2006), chlorinated hydrocarbons such as trichloroethylene and chlorobenzene (Humphries et al., 2005) and fuel oxygenates such as methyl tertiary butyl ether (Zaitsev et al., 2007). Xenobiotic-degrading Variovorax strains have been isolated from a diverse range of ecosystems such as bulk soil (El-Fantroussi, 2000; Dejonghe et al., 2003; Breugelmans et al., 2007; Hussain et al., 2009), rhizosphere soil (Abou-Shanab et al., 2007), activated sludge (Zaitsev et al., 2007), deep ocean sediment (Wang & Gu, 2006), groundwater (Humphries et al., 2005) and aquifers (Greene et al., 2000). Other Variovorax strains show resistance to heavy metals (Abou-Shanab et al., 2007; Miwa et al., 2008). Recent culture-independent studies confirm the presence of Variovorax in a wide variety of polluted (Eriksson et al., 2003; Humphries et al., 2005) and nonpolluted (Segawa et al., 2005; Kim et al., 2006; Palumbo et al., 2007; Hutalle-Schmelzer & Grossart, 2009) environments, suggesting that Variovorax adapts easily to different environmental constraints and plays an important role in the biodegradation of organic pollutants in contaminated environments.
The availability of tools to monitor the abundance and diversity of Variovorax is crucial for a better understanding of its role in polluted ecosystems. Molecular tools like fingerprinting methods such as denaturing gradient gel electrophoresis (DGGE) and molecular quantification methods like real-time PCR based on evolutionary genetic markers as the 16S rRNA gene allow to rapidly monitor changes in the diversity and abundance of a target species in a given environment in a cultivation-independent way. However, to date, there are no such tools available that specifically target Variovorax.
In this study, we optimized and validated a PCR-based molecular toolbox for monitoring the quantity and diversity of Variovorax in environmental samples. The molecular tool box consists of a Variovorax-specific real-time PCR and PCR-DGGE protocol, based on 16S rRNA gene sequence recognition. Previously, it was shown that enrichment of bacteria capable of using the phenylurea herbicide linuron as the sole source of carbon and energy from linuron-treated agricultural soils almost exclusively results in the isolation of strains belonging to the genus Variovorax, suggesting that Variovorax plays a crucial role in in situ degradation of linuron (Breugelmans et al., 2007). The optimized tool box was used for the analysis of the size and diversity dynamics of Variovorax in an experimental design that makes use of soil microcosms (SMs) to examine this hypothesis.
Materials and methods
DNA extraction
DNA extraction from pure cultures was performed as described previously (Uyttebroek et al., 2006). DNA extraction from soil samples was performed using the E.Z.N.A.® Soil DNA kit (Omega Bio-Tek) as described by the manufacturer.
Design of a primer set for specific PCR amplification of the Variovorax 16S rRNA gene
16S rRNA gene sequences of Variovorax and related genera were retrieved from the Ribosomal Database Project RDPII database (Release 10) (Cole et al., 2009) and multiple alignment of the sequences was performed using the mega 4 software (Tamura et al., 2007). Primrose 2.17 (Ashelford et al., 2002) was used to scan 110 Variovorax 16S rRNA gene sequences and 64 000 nontarget 16S rRNA gene sequences to identify Variovorax-specific primers for PCR purposes. basic local alignment search tool (blast) (Altschul et al., 1990) and RDPII were used to confirm the selected primer specificity. The selected primers were chosen such that they allowed the amplification of an 88-bp-long PCR product suitable for real-time PCR application, with maximum nucleotide polymorphism between the primer sequences for DGGE applications. The primers for real-time PCR application were designated VarF (5′-CAATCGTGGGGGATAACGC-3′) and VarR (5′-GGCCGCTCCATTCGCGCA-3′). For PCR-DGGE purposes, VarF was modified using a GC clamp as described by Sheffield (1989) and designated VarF-GC. Primers were ordered at ThermoFisher Scientific (Belgium).
PCR
PCR was performed using an Eppendorf mastercycler (Eppendorf, Germany). PCR reaction mixtures contained 10 nmol of each dNTP (Invitrogen NV, Belgium), 25 pmol forward and reverse primer, 1.25 U Taq DNA polymerase (Qiagen, Belgium), PCR buffer 1 × (Qiagen) and 1 μL of template DNA in a final volume of 50 μL. In case soil DNA was used as a template, 0.1% bovine serum albumin (Amersham Biosciences, Belgium) was added to the PCR reaction mixture.
The specificity of the designed primer set VarF/VarR was tested by performing PCR on pure culture DNA of nine different Variovorax strains, i.e., strains WDL1 (Dejonghe et al., 2003), PBD-H1, PBS-H4, PBL-H6, PBD-E5, PBL-E5, PBD-E37 (Breugelmans et al., 2007), SRS16 (Sørensen et al., 2005) and Variovorax paradoxus DSM66 (obtained from the BCCM/LMG Bacteria collection) and the closely related organisms Comamonas testosteroni WDL7, Delftia acidovorans WDL34 (Dejonghe et al., 2003), Hydrogenophaga PBL-H3, Hyphomicrobium sp. PBN-H4, PBN-E9, Hyphomicrobium sulfonivorans WDL6, Afipia sp. PBD-E87, Cupriavidus sp. PBS-E1 (Breugelmans et al., 2007), Aquaspirillum sinuosum and Acidovorax avenae subsp. avenae T (obtained from the BCCM/LMG Bacteria collection). Tenfold dilution series starting from 1010 copies μL−1 of the partial 16S rRNA gene of Variovorax sp. WDL1 and A. avenae subsp. avenae, amplified with the universal 16S rRNA gene primers 27F and 1492R (performed as described previously by Polz & Cavanaugh, 1998), were used to test the sensitivity and specificity of the PCR under different amplification conditions.
Optimal PCR reaction conditions with both primer pairs VarF/VarR and VarF-GC/VarR were an initial denaturation for 5 min at 94 °C, 30 cycles consisting of a denaturation step at 94 °C for 1 min, an annealing step at 60 °C for 1 min and an extension step at 72 °C for 1 min, and a final extension step at 72 °C for 10 min. PCR, for DGGE purposes, consisted of a PCR reaction with the primer pair VarF-GC/VarR performed as described above. In case PCR signals were weak, a double PCR approach was used in which a second PCR was performed using 1 μL of the first PCR reaction as a template and the primer pair VarF-GC/VarR under the same PCR conditions as described above. Visualization of PCR amplicons was performed by means of agarose gel electrophoresis (1.5% agarose gel, 0.02% ethidiumbromide, 90 V for 1 h 15 min).
Restriction enzyme digestion
The restriction enzyme HindIII (New England Biolabs, UK) was used for digestion of the PCR template DNA in order to digest the 16S rRNA gene of the nontarget organism Acidovorax spp. in the DNA sequence located between the VarF and the VarR primer annealing sites. Restriction was performed in a total reaction volume of 20 μL, containing 17 μL of soil DNA or amplification product, 2 μL NEBuffer2 (New England Biolabs) and 1 μL (20 U μL−1) HindIII. The reaction mixture was incubated for 1 h at 37 °C, after which the restriction enzyme was inactivated by incubating the mixture for 20 min at 65 °C. Restriction of the PCR product was visualized on a 6% Nusieve® 3 : 1 agarose gel (Tebu-bio, France) run at 120 V for 4 h.
Real-time PCR
Real-time PCR was performed using a Rotor Gene Real-Time Centrifugal DNA Amplification Apparatus (Corbett Research, Australia). The reaction mixture contained 10 μL of Absolute QPCR SYBR® Green mix (ThermoFisher Scientific, UK), 0.6 μL VarF (10 μM), 0.4 μL VarR (10 μM), 69 μL of water and 3 μL of template DNA. Optimal reaction conditions were 15 min at 95 °C, followed by 40 cycles of 5 s at 95 °C, 20 s at 63.5 °C and 5 s at 72 °C and a final extension step of 10 min at 72 °C. Optimal forward and reverse primer concentrations were determined by performing PCR using different ratios of primer VarF and primer VarR concentrations ranging between 100 and 400 nM. The sensitivity and specificity of the reaction was examined by performing PCR on a 10-fold dilution series of a 1010 copies μL−1 solution of target DNA, known numbers of 16S rRNA gene copies of Acidovorax or Variovorax or a mixture of known amounts of Acidovorax and Variovorax 16S rRNA gene copies and sequencing of amplicons obtained from a DNA extract of soil L described below. The specificity was optimized by treating template DNA with the restriction enzyme HindIII before the real-time PCR step as described above. The quantification limit with a maximum allowed SD of 10% was determined as the average value obtained with a triplicate measured blank increased with the 10-fold SD (Massart et al., 1990). The required dilution of soil DNA extracts to prevent the inhibition of the reaction by soil substances was determined by performing PCR on a 10-fold dilution series (100–10−3) of a soil L DNA extract containing a known amount of target DNA. It was found that a 10-fold dilution of the soil DNA extracts was sufficient to eliminate inhibitory effects. Real-time PCR targeting bacterial 16S rRNA genes was performed as described previously (Haest et al., 2010).
DGGE analysis
DGGE of PCR products obtained with the primer pair VarF-GC/VarR was performed as described previously (Uyttebroek et al., 2006) using a 10% acrylamide gel with a denaturation gradient of 45–75%. A bacterial 16S rRNA gene DGGE marker containing 16S rRNA gene fragments with different GC contents from various bacteria (not belonging to the Variovorax genus) amplified with the bacterial primers 63F and 518R (El Fantroussi et al., 1999) was used.
Cloning and sequencing of PCR amplification products
Cloning of 16S rRNA gene amplification products was performed using the PCR2.1 TOPO cloning kit (Invitrogen NV) as described by the manufacturer. Shotgun sequencing was performed using the BigDye™ Terminator Cycle Sequencing Kit (Applied Biosystems) as described by the manufacturer. The sequencing reaction was performed on a thermocycler UNOII (Biometra, Germany). The migration of the cloned amplicons on DGGE was compared with the DGGE community profile. For each DGGE band, two clones were sequenced.
Pesticides used
Linuron [3-(3,4-dichlorophenyl)-1-methoxy-1-methyl urea] (99.5%) was purchased from Sigma Aldrich, Belgium. [Phenyl-U-14C] Linuron (16.93 mCi mmol−1, radio-chemical purity >95%) was obtained from Izotop, Hungary.
Set-up of SMs
SMs were set up in glass columns as described previously (Sniegowski et al., 2009), except that the glass columns were filled with soil only. The soil used and designated as soil L in this study originated from the A horizon of a potato field in Halen (Belgium) with a history of linuron treatment. Previously, it was shown that this soil contained a linuron-mineralizing microbial community (Breugelmans et al., 2007). The soil sample was preserved at 4 °C before use.
Different SMs were subjected to different treatments, with three replicates for every treatment; i.e., (1) a discontinuous irrigation with sterile tap water, (2) a single addition of 1 mL of 50 mg L−1 linuron in sterile tap water at the start of the incubation period, followed by a discontinuous irrigation with sterile tap water and (3) a discontinuous irrigation with sterile tap water containing linuron (50 mg L−1). Irrigation of the soil columns was carried out with a micropipette and took place every Monday (1 mL), Wednesday (1 mL) and Friday (1.5 mL) during the incubation period. The SMs that received a single addition of linuron received a dose corresponding to 250 g linuron ha−1, while discontinuously linuron-fed SMs had received, after 70 days of incubation, the equivalent of 8750 g linuron ha−1 (an average of 125 g ha−1 day−1). All SMs were incubated in the dark at 25 °C for 70 days. At different time points (days 0, 1, 5, 9, 14, 21 and 70 after the start of the experiment), soil samples were taken for DNA extraction, for dry weight measurement and to conduct mineralization assays. 14C-linuron mineralization experiments were performed and mineralization lag times were determined as described previously (Sniegowski et al., 2009). Soil samples (±500 mg) were weighed before and after overnight dehydration at 105 °C. Mineralization lag times and population sizes were subjected to anova on a significance level of 0.05 to assess the effects of linuron application.
Accession numbers
The sequences of cloned PCR amplicons were deposited in the GenBank under accession numbers HM582323 – HM582331.
Results and discussion
Development of a PCR protocol specifically targeting the Variovorax 16S rRNA gene
Both primers VarF and VarR (Table 1) showed 100% identity with 92.2% of the Variovorax 16S rRNA gene sequences available. Only one base positioned at the 5′-end of VarR differed for the remaining 7.8% of the available Variovorax 16S rRNA gene sequences. Within the genus Variovorax, the sequence located between primer sequences VarF and VarR showed up to a 7% difference and a GC content varying between 55% and 59%. In silico analysis of corresponding 16S rRNA gene sequences of nontarget organisms showed at least one nucleotide mismatch and often more than three mismatches with both primer sequences. Often, these mismatches were located at the 3′-end of the primers, especially of the VarF primer. Although for a number of nontarget strains the mismatches of the 16S rRNA gene sequences with the primer sequences were not located near the 3′-end (Table 1), no amplification was observed as was the case for Afipia sp. and Aquaspirillum. Exceptions were 16S rRNA gene sequences of members of the genus Acidovorax, a genus phylogenetically closely related to Variovorax. Thirty per cent of the Acidovorax 16S rRNA gene sequences available in databases showed only one mismatch (C instead of T at position 9) with the primer VarR and one or two mismatches with the primer VarF (G instead of A at position 2 and in some cases A or G instead of C at position 19). Even though one of the mismatches is positioned at the 3′-end of the primer VarF, the number and position of mismatches with Acidovorax 16S rRNA gene sequences within the primer sequences were not sufficient to prevent PCR amplification of the corresponding Acidovorax 16S rRNA gene fragment when a large amount of Acidovorax DNA is present in the sample, as shown in Supporting Information, Fig. S1. This might be due to the relatively high GC content of the primers (VarF 55% GC, VarR 72% GC). An annealing temperature of 67 °C was needed to ensure high specificity with the complete prevention of amplification of Acidovorax 16S rRNA genes. However, as a consequence, the limit for detecting Variovorax 16S rRNA genes became unacceptably high, i.e., only numbers of 106 gene copies per reaction or higher were detected (Fig. S2). This was in contrast to a detection limit of 104 gene copies per reaction when annealing temperatures of 55–63.5 °C were used (Fig. S2). Moreover, the detection limit was 104 times lower for Variovorax 16S rRNA genes than for Acidovorax 16S rRNA genes when an annealing temperature of 63.5 °C was used, while at an annealing temperature of 55 °C, the detection limit differed only 10-fold (Figs S1 and S2). Therefore, an alternative strategy was designed to prevent the amplification of Acidovorax 16S rRNA genes at a lower annealing temperature. In silico comparison of the 16S rRNA gene sequences between VarF and VarR in Variovorax and in Acidovorax showed the presence of a recognition site for the restriction enzyme HindIII in the Acidovorax 16S rRNA gene within the DNA sequence encompassed by VarF and VarR, but not in the Variovorax 16S rRNA gene. To avoid PCR amplification of Acidovorax 16S rRNA genes using the primers VarF and VarR at a lower annealing temperature, the template DNA was treated with HindIII before amplification. Because the 16S rRNA gene of Acidovorax was digested between the two primer annealing sites, no amplification occurs in a subsequent PCR. Different amounts of HindIII (2, 10, 20 U) to digest known numbers of Variovorax 16S rRNA gene fragments (1010 copies μL−1), Acidovorax 16S rRNA gene fragments (1010 copies μL−1) or a mixture of Variovorax (0.5 × 10⁹ copies μL−1) and Acidovorax (0.5 × 10⁹ copies μL−1) 16S rRNA gene fragments were tested to determine the amount of endonuclease to ensure the complete digestion of the Acidovorax 16S rRNA genes in a reaction volume of 40 μL. Complete digestion was only achieved when 20 U of HindIII was used. Moreover, to detect the possible inhibition of HindIII enzyme activity by soil contaminants in soil DNA extracts, 10−1 and 10−2 dilutions of soil DNA, supplemented with known amounts of Variovorax 16S rRNA gene fragments (107 copies μL−1), Acidovorax 16S rRNA gene fragments (108 copies μL−1) or a mixture of Variovorax (107 copies μL−1) and Acidovorax (108 copies μL−1), were subjected to Variovorax-specific PCR after digestion with 20 U of HindIII or without HindIII digestion. For both dilutions, no detection of Acidovorax 16S rRNA genes was observed after HindIII digestion, showing that no inhibition of the restriction enzyme occurred. However, we recommend for any other soil DNA extract to examine the possible inhibition of the HindIII enzyme by performing controls with Acidovorax DNA added. Evaluation of the effect of the HindIII treatment on Acidovorax 16S rRNA gene amplification at different annealing temperatures (55–63.5–67 °C) showed that it reduced the sensitivity for Acidovorax 16S rRNA genes 10-fold in all cases, as shown in Fig. S1. The residual amplification of Acidovorax 16S rRNA genes might be due to the presence of single-stranded 16S rRNA genes that will not be digested, but can still function as a template for PCR after reannealing. Previously, a suicide polymerase endonuclease restriction (SuPER) approach, which includes steps to eliminate single-stranded nontarget DNA, has been reported (Green & Minz, 2005). In this method, digestion is performed using a heat-resistant restriction enzyme after denaturation of the template DNA and during a PCR which first specifically amplifies the nontarget amplicon sequence. However, because of the limited length of the Variovorax 16S rRNA gene amplicon generated with the primer set VarF/VarR, a suitable heat-resistant restriction enzyme that satisfied all the requirements associated with such a SuPER approach for our purpose was not found. The final annealing temperature for the Variovorax-specific PCR with the primer set VarF/VarR was chosen such that the limit of detection of the Variovorax 16S rRNA gene was minimized with the maximal difference between the limits for detecting Variovorax 16S rRNA genes and Acidovorax 16S rRNA genes. These requirements were met using an annealing temperature of 60 °C, which provided a detection limit of 104Variovorax 16S rRNA gene copies per reaction, corresponding to 1.25 × 10⁶ copies DNA (g−1 wet wt soil), which is 104 times lower compared with the limit of detection of Acidovorax 16S rRNA genes. Combined with a HindIII digestion before PCR amplification, the protocol achieves a 105 times higher detection limit for Acidovorax 16S rRNA genes than for Variovorax 16S rRNA genes. Because of the large difference in PCR sensitivity for Variovorax and Acidovorax, the PCR protocol preceded by HindIII restriction digestion is considered Variovorax specific. Confirmation of the nature of the amplification product can always be achieved by HindIII digestion of the amplicon.
Homology of the nucleotide sequences of the designed Variovorax-specific primers with corresponding 16S rRNA gene regions of various Variovorax species and related proteobacterial strains
Dashes indicate nucleotides identical to the nucleotides of the Variovorax primers at the top. Dots indicate absent nucleotides.
Development of a real-time PCR-protocol specifically targeting Variovorax spp.
As for the conventional PCR, an optimal annealing temperature was determined for the real-time PCR quantification of Variovorax 16S rRNA genes. Different VarF and VarR primer concentrations were tested at different annealing temperatures. The use of an annealing temperature of 63.5 °C with VarF and VarR primer concentrations of 300 and 200 nM, respectively, showed the highest sensitivity and specificity. The detection limit was 3 × 10² copies of Variovorax template DNA per reaction, corresponding to ±105 copies of Variovorax 16S rRNA gene copies (g−1 wet wt soil). This quantification limit lies within the range of quantification limits reported for SYBR® Green real-time PCR protocols targeting the 16S rRNA gene of other organisms in soil DNA extracts. Detection as low as ±1.25 × 10⁴ copies (g−1 dry wt soil) for Rhizobium radiobacter (Suss et al., 2006) and 104–105 genome equivalents (g−1 soil) for Pseudomonas (Clark & Hirsch, 2008) has been reported. The use of a Taqman probe-based approach instead of a SYBR® Green-based approach does not result in a lower detection limit (Okano et al., 2004). The lower sensitivity for Acidovorax 16S rRNA genes was confirmed in the real-time PCR protocol. The PCR appeared to be 7 × 10³ times more specific for Variovorax 16S rRNA genes than for Acidovorax 16S rRNA genes. For real-time PCR detection of Acidovorax, a minimal number of 3 × 10⁵ copies of Acidovorax template 16S rRNA genes per reaction was required. This correlates with ±108 copies (g−1 wet wt soil). Even in case the ratio of Acidovorax to Variovorax 16S rRNA gene copies was 100, the presence of Acidovorax 16S rRNA genes did not interfere with the PCR amplification of Variovorax 16S rRNA genes. Moreover, by subjecting the template DNA to digestion with HindIII, the limit of detection of Acidovorax 16S rRNA genes by real-time PCR was increased to 3 × 10⁶ copies per reaction or 109 copies (g−1 wet wt soil). For data interpretation, it is important to emphasize the difference between the number of detected 16S rRNA genes and the number of cells present because it is possible that more than one 16S rRNA gene copy is present in each cell. Variovorax paradoxus S110 for example contains two 16S rRNA gene copies.
Development of a Variovorax-specific PCR-DGGE method
Although the primer pair VarF/VarR amplifies only an 88-bp-long fragment of the 16S rRNA gene, this primer pair was used to develop a Variovorax-specific PCR-DGGE protocol. The strong conservation of the Variovorax 16S rRNA gene left very little options for designing Variovorax-specific primer sets, of which the intermediate sequence shows a high degree of polymorphism. Although longer amplicons result in a higher resolution in DGGE, the best trade-off between primer specificity, intermediate sequence polymorphism and amplicon length was achieved using the primer pair VarF/VarR. Moreover, the use of the same primer pair in real-time PCR and PCR-DGGE ensures a reliable link between the observed changes in Variovorax community composition and changes in Variovorax community size. A GC clamp was attached to the primer VarF to analyse the diversity of Variovorax by means of DGGE. A 10% polyacrylamide gel with a 45–75% denaturing gradient was used because of the confined length of the amplification product (120 bp). The resolving power of the PCR-DGGE protocol was tested with DNA of representatives of different Variovorax phylotypes as a template. The Variovorax-specific PCR-DGGE was found to be able to clearly visualize the presence of different Variovorax phylotypes despite the short amplicon size as reported previously by Myers (1985). The DGGE profile obtained was congruent with the phylogenetic grouping (Fig. 1). Sequence comparison revealed critical differences in nucleotide sequence in the Variovorax 16S rRNA amplicons, which resulted in different DGGE profiles as shown in Fig. S3. The GC content of the amplicons showing distinct DGGE profiles varied between 56% and 59%. Amplicons showing a higher GC content were located towards the bottom of the gel (Fig. 1b). Phylotypes A and B had a GC content of 57% and 59%, respectively. Apparently, a 2–5% difference in nucleotide sequence in the 88-bp-long DNA fragment seems to be sufficient to bring about a significantly different electrophoretic mobility in the DGGE and to discriminate between different phylotypes. In addition to differences in nucleotide sequence, small deletions and the position of the nucleotide differences seem to contribute to separation. Soil L samples containing known numbers of 16S rRNA gene copies of Variovorax [numbers from 105 up to 108 copies (g−1 dry wt soil) of Variovorax 16S rRNA gene sequences], as determined by real-time PCR, were used to examine the detection limit of the PCR-DGGE approach. Only samples with a Variovorax population size corresponding to at least ±107 16S rRNA gene copies (g−1 dry wt soil) were amplified and could be analysed on DGGE. The higher detection limit for the Variovorax-specific PCR-DGGE compared with that for the conventional and real-time PCR is probably due to the presence of the GC clamp on primer VarF, which can result in decreased annealing efficiency (Leys et al., 2005). However, the detection limit of the PCR-DGGE protocol could be reduced to at least 105 copies (g−1 dry wt soil) by performing a second PCR using the product of the first PCR reaction as a template. In this way, samples with a Variovorax population size smaller than ±107 16S rRNA gene copies (g−1 dry wt soil) were also visualized by DGGE and less dominant phylotypes could be recovered (Fig. 2). We did not test lower Variovorax 16S rRNA gene copy numbers, but previously nested PCR approaches were found to reduce the PCR-DGGE detection till around 102 copies (g−1 soil) of target 16S rRNA genes (Leys et al., 2005). Because of the poor detection limit of the single PCR-DGGE protocol, we recommend the use of the double PCR-DGGE protocol to analyse the Variovorax community composition in environmental samples. The lack of coamplification of Acidovorax 16S rRNA genes was confirmed by the treatment of the amplicons with HindIII (data not shown).
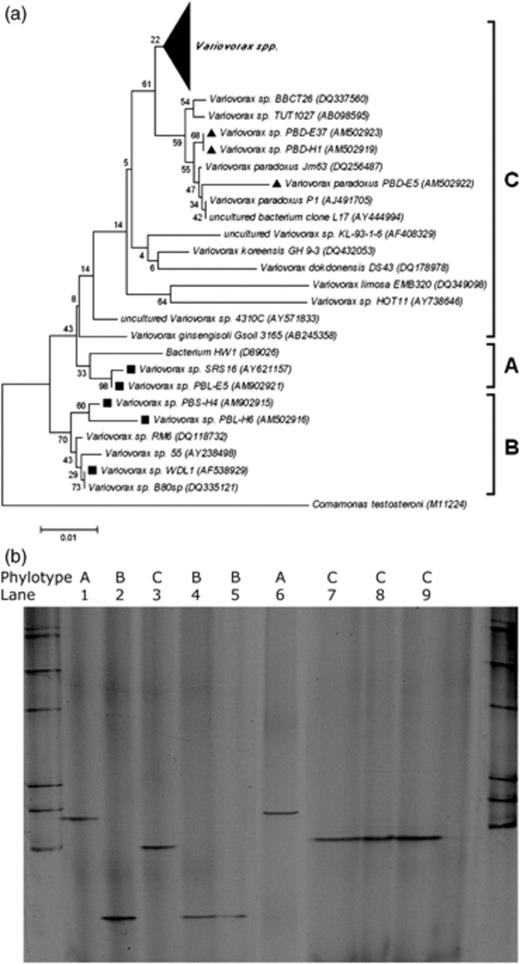
Phylotype-specific detection of Variovorax by PCR-DGGE. (a) Neighbour-joining phylogenetic tree based on partial 16S rRNA gene sequences. GenBank accession numbers are indicated between parentheses. The statistics based on bootstrapping with 1000 replications are indicated at the nodes of each branch (Breugelmans et al., 2007). The different Variovorax phylotypes A, B and C are indicated. Linuron-degrading isolates are indicated with a black square, while 3,4-dichloroaniline-degrading isolates are indicated with a black triangle. The large black triangle covers 67 randomly selected 16S rRNA gene sequences of various Variovorax spp. Comamonas testosteroni type strain M11224 was used as an outgroup. (b) DGGE of PCR amplicons obtained with the primer set VarF-GC/VarR from pure Variovorax strains representing the different phylotypes. Above each lane, the corresponding Variovorax phylotype (A, B or C) is indicated. Lanes: 1, strain SRS16; 2, strain WDL1; 3, type strain DSM66; 4, strain PBSH4; 5, strain PBLH6; 6, strain PBLE5; 7, strain PBDH1; 8, strain PBDE5; 9, strain PBDE37. A bacterial DGGE marker is present in the two outer lanes.
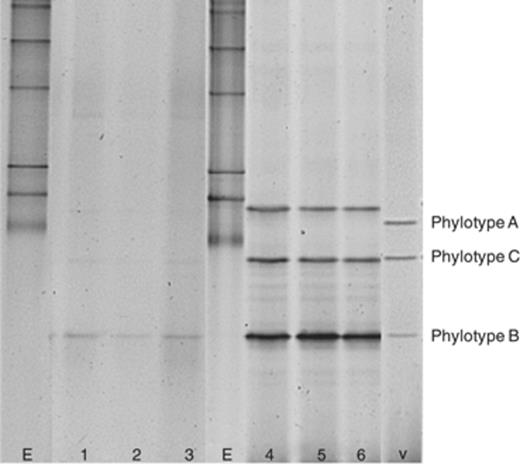
PCR-DGGE detection of Variovorax in agricultural soil using a single and a double PCR approach. Lanes marked by ‘E’ show the bacterial 16S rRNA gene DGGE marker; lanes marked by ‘v’ show the Variovorax 16S rRNA gene DGGE marker. Three replicate DNA extracts from the same soil were amplified with the primer set VarF-GC/VarR. Lanes 1, 2 and 3 show the profiles obtained using a single PCR, while lanes 4, 5 and 6 show the DGGE profiles of PCR products obtained from a double PCR performed on amplicons obtained from the first PCR.
The effect of linuron application on the Variovorax community in an agricultural soil
In order to study the effect of linuron application on a soil Variovorax community, soil L was incubated for 70 days (1) without linuron supply, (2) with a single linuron supply at the start of the incubation period or (3) with a discontinuous linuron supply during the entire incubation period. The dynamics in linuron mineralization capacity, Variovorax community size and Variovorax community diversity throughout the incubation period were analysed. The lag time required for linuron mineralization correlates inversely with the linuron mineralization capacity (Sniegowski et al., 2009). At the start of the incubation period, all SMs showed a high variation in lag time in the linuron mineralization assays. This variation decreased as a response to the application of linuron (Fig. 3). Both single and discontinuous treatment with linuron caused a significant decrease in the lag time observed in linuron mineralization kinetics recorded with samples taken from the SMs during incubation. However, the effect of a single linuron treatment on the lag time was smaller and developed more slowly than the effect caused by a discontinuous linuron supply. The lag time recorded in the mineralization assays performed with samples from the discontinuously linuron-fed SMs decreased significantly from 31.5±2.63 days at the start of the experiment to 0.93±1.13 days after 70 days of incubation. Samples taken from SMs that were treated only once with linuron showed a minimal lag time 14 days after the treatment (4.26±0.48 days), which increased 56 days later again to 10.26±3.63 days. At this point, no significant difference was observed between lag times recorded with samples taken from the water-fed SMs and the single linuron-treated SMs (P<0.05). Although samples taken from the water-fed SMs also showed a decrease in lag time, this decrease was much smaller than that for both linuron-fed set-ups. We hypothesize that the decrease in linuron mineralization lag time observed in SMs fed with water without linuron is due to the change in the moisture content, which stimulated the microbial community including the linuron-degrading community. The water content of the soil increased from 7.3% to 18.3% between day 0 and day 9, after which it did not change significantly. The rewetting period coincides with the time frame in which a decrease in lag time is observed for the samples irrigated with water. Previously, it was shown that rewetting soil L after a drought period of 5 weeks stimulated the linuron-degrading bacterial community considerably (Sniegowski, 2010). The size of the bacterial community in the SMs remained approximately constant during the incubation period [7.92 × 10⁹±4.26 × 10⁹ bacteria (g−1 dry wt soil)]. However, after 9 days of incubation, all SMs show a significant increase (±16 times) in the number of Variovorax 16S rRNA gene copies from 8.20 × 10⁵±1.90 × 10⁵ to 1.68 × 10⁷±4.47 × 10⁶ copies (g−1 dry wt soil) (P<0.05) (Fig. 4). During further incubation, the number of Variovorax 16S rRNA gene copies remained approximately constant in the water-fed SMs and in the SMs that received a single linuron treatment. However, after 70 days of incubation, a significant difference in the number of Variovorax was observed between the discontinuously linuron-fed SMs and the other SMs (P<0.05), with an increase up to a total number of 1.18 × 10⁷±7.37 × 10⁷ of 16S rRNA Variovorax gene copies in discontinuously linuron-fed SMs (Fig. 4). Moreover, the Variovorax 16S rRNA gene fraction in the bacterial community increased by about 152 times during the incubation period in the discontinuously linuron-fed SMs, i.e., from 0.01±0.003% to 1.63±1.04%.
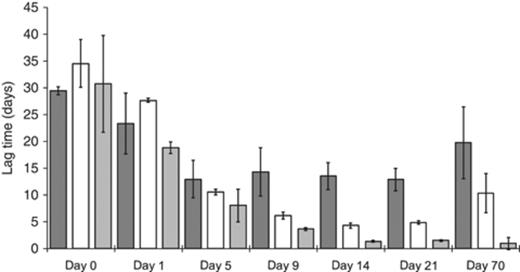
Evolution of 14C-linuron mineralization lag times recorded with SM samples. The dark grey bars represent the water-fed SMs while the white (single treatment) and the soft grey (discontinuous treatment) bars show the lag times recorded for the linuron-fed SMs. The numbers on the X-axis represent the day of sampling. Lag time values are the average values recorded for triplicates, with the SD marked on the bars. anova was used to trace significant differences between treatments and time points (P<0.05).
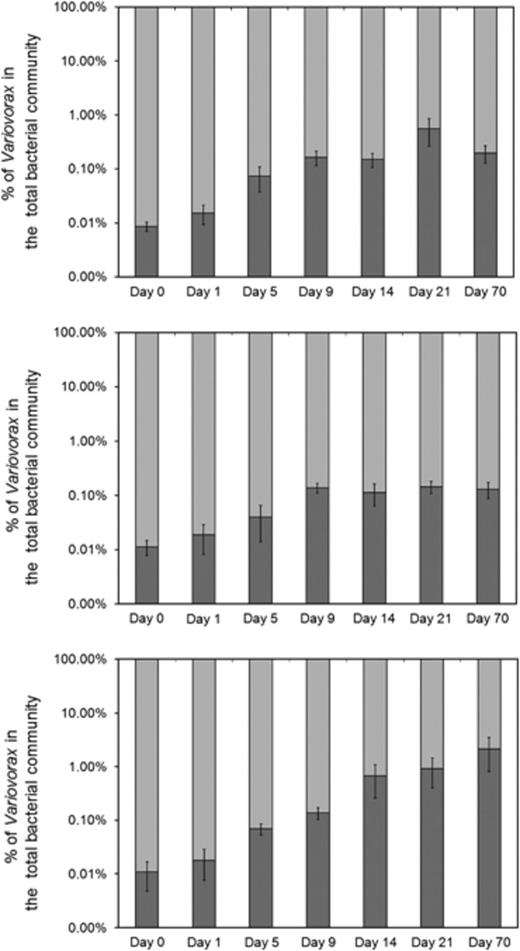
Dynamics of the Variovorax community in linuron-treated SMs. Community sizes were determined by real-time PCR in SMs containing agricultural soil without linuron (top), with a single linuron treatment (middle) or with a discontinuous linuron treatment (bottom). Duplicate measurements were performed on three replicates for each SM treatment. The numbers on the X-axis (log scale) show the day of incubation at which the samples were taken. The numbers on the Y-axis show the percentage of Variovorax (dark grey) in the total bacterial community (soft grey), based on the number of Variovorax and bacterial 16S rRNA gene copies as determined by real-time PCR. The SD is presented on the bars. anova was used to trace significant differences between treatments and time points (P<0.05).
DGGE analysis of the Variovorax community showed the appearance of four dominant bands, indicating that the Variovorax community initially consisted of four major groups (Fig. 5). Comparison with the Variovorax 16S rRNA gene DGGE marker shows that two (i.e. bands 3 and 4) of the four bands migrated at positions corresponding to those of Variovorax phylotypes B and C, while a less dominant band (i.e. band 2) migrated at a position corresponding to that of Variovorax phylotype A. Previously, phylotypes A and B have been linked to linuron-degrading Variovorax strains (Breugelmans et al., 2007). This pattern remains unchanged until day 5 of the incubation. Amplicons corresponding to bands 1, 2 and 3 were cloned and sequenced. Sequence comparison revealed critical differences in nucleotide sequence in the Variovorax 16S rRNA amplicons, which result in different electrophoretic mobility in the DGGE as shown in Fig. S3. blast analysis of the sequences identified them as Variovorax 16S rRNA genes (E-value <10−18), confirming the specificity of the detection method. Moreover, amplicons associated with band 2 corresponding to phylotype A and band 3 corresponding to phylotype B indeed had 100% sequence identity with the 16S rRNA genes of known representatives of those phylotypes, i.e., Variovorax sp. SRS16 (phylotype A) and Variovorax sp. WDL1 (phylotype B), respectively. The amplicons associated with band 1 showed 100% sequence identity with the 16S rRNA gene sequence of Variovorax ginsengisoli strain Gsoil 3165 and of an uncultured Variovorax sp. 4310C (Saul et al., 2005). They apparently form a distinct cluster in the phylotype C cluster (Fig. 1a). Probably, this group of sequences can rather be considered as a separate phylotype instead of belonging to phylotype C. Unfortunately, we were unable to clone the amplicon associated with band 4. Interestingly, from day 9 onwards, the DGGE band migrating at the position corresponding to phylotype A became clearly more prominent in SMs that received linuron. The impact of a discontinuous vs. a single treatment with linuron on the diversity of the Variovorax community was clearly visible after 14 days of incubation. DGGE bands associated with phylotype A became more and more prominent in the SMs that received a discontinuous supply of linuron. This trend developed further over the next weeks and after 21 days of incubation, bands associated with phylotype A became the most dominant group in the discontinuous linuron-fed SMs. On the other hand, at the end of the incubation period, the Variovorax community in the single linuron-fed SMs reverted to its initial composition. Several amplification products recovered from day 70, corresponding to bands 5, 6 and 7, were again cloned and sequenced. Sequences are shown in Fig. S1. As found for bands 2 and 3, the sequence associated with bands 6 and 7 showed 100% sequence identity with the 16S rRNA gene sequence of Variovorax sp. SRS16 belonging to phylotype A and of Variovorax sp. WDL1 belonging to phylotype B, respectively. As found for band 1, the amplicons associated with band 5 showed 100% sequence identity with the 16S rRNA gene sequence of V. ginsengisoli strain Gsoil 3165 and of an uncultured Variovorax sp. 4310C (Saul et al., 2005).
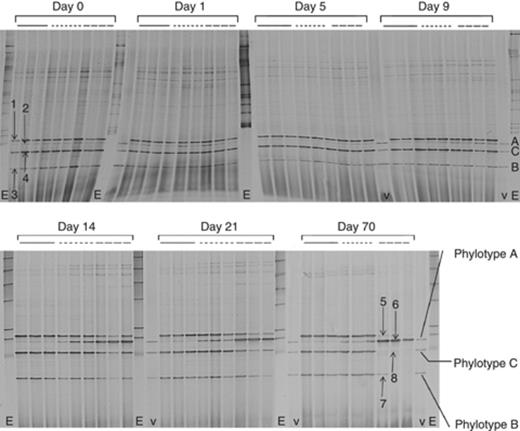
Dynamics of the Variovorax community in linuron-treated SMs as revealed by Variovorax-specific double PCR-DGGE. The solid line shows profiles obtained from the water-fed SMs, the small dotted line from the single linuron-treated SMs and the dashed line from the discontinuously linuron-treated SMs. The lanes marked by ‘v’ show the Variovorax 16S rRNA gene DGGE marker (phylotypes A, B and C are indicated); the lanes marked by ‘E’ show the bacterial 16S rRNA gene DGGE marker. The accession numbers corresponding to the different DGGE bands are: 1, HM582330; 2, HM582323 and HM582324; 3, HM582327; 5, HM582331; 6, HM582325 and HM582326; 7, HM582328 and HM582329. DGGE bands 4 and 8 could not be cloned.
It was shown previously that a decrease or an increase in lag time is due to an increase or a decrease in linuron-degrading biomass, respectively (Sniegowski et al., 2009). The increase in linuron mineralization capacity appears to correlate well with the increase in Variovorax community size and the shift in Variovorax community composition in the long-term linuron-fed SMs. In the SMs that received linuron only at the start of the experiment, analysis of the Variovorax community size did not reveal any effect. However, as observed in the long-term linuron-fed systems, DGGE analysis clearly showed the increase in time of a specific subgroup of Variovorax as a response to linuron supply. The observed response in Variovorax community size and community composition to the exposure to linuron supports the hypothesis that the Variovorax is effectively involved in in situ linuron degradation in linuron-treated agricultural soils.
Moreover, the subgroup mentioned corresponds to phylotype A within the Variovorax phylogeny, a phylotype that up to now exclusively consists of Variovorax strains isolated for the capability of degrading linuron. On the other hand, linuron-degrading Variovorax strains isolated previously from the soil used are not associated with phylotype A, but rather with phylotype B (Breugelmans et al., 2007). Other Variovorax strains isolated from this soil for their capacity to degrade 3,4-dichloroaniline, the main intermediate in linuron degradation, are associated with phylotype C (Breugelmans et al., 2007). As such, our results also show that isolation through enrichment might present a distorted image of the in situ linuron-degrading populations.
Acknowledgements
This research was supported by IWT-Vlaanderen Strategic Basic Research project 73352 and IWT-Vlaanderen Agricultural Research project LBO 040272.
References
Supporting Information
Please note: Wiley-Blackwell is not responsible for the content or functionality of any supporting materials supplied by the authors. Any queries (other than missing material) should be directed to the corresponding author for the article.
