


Abstract
The phylogenetic composition of bacterial communities in the rhizosphere of three potato cultivars grown at two distant field sites was analysed. Ribosomal gene fragments amplified from total community DNA were hybridized to PhyloChips. A total of 2432 operational taxonomic units (OTUs) were detected by the PhyloChips, of which 65% were found in the rhizosphere of all cultivars at both field sites. From all detected OTUs, 9% revealed a cultivar-dependent abundance at the one or the other field site and 4% at both sites. Differential abundance on the three cultivars was mainly observed for OTUs belonging to the Pseudomonadales, Actinomycetales and Enterobacteriales. More than 40% of OTUs belonging to Bradyrhizobiales, Sphingomonadales, Burkholderiales, Rhodocyclales, Xanthomonadales and Actinomycetales differed significantly in their abundance between the sites. A sequence analysis of six 16S rRNA gene clone libraries corresponded well with the taxonomic community structure evidenced by the PhyloChip hybridization. Most ribotypes matched OTUs detected by the PhyloChip. Those OTUs that responded to the potato cultivar at both field sites might be of interest in view of cultivar-specific effects on bacterial biocontrol strains and pathogens.
Introduction
Microbial communities colonizing the rhizosphere of crop plants are of central importance not only for plant nutrition, health and quality but also for carbon sequestration and nutrient cycling in terrestrial ecosystems. Biotic and abiotic factors are assumed to shape the structural and functional diversity of microbial communities in the rhizosphere (Berg & Smalla, 2009). Site properties including soil type, climatic conditions and type of agricultural management were shown to strongly influence the relative composition of rhizosphere microbial communities, but the plant species and cultivar can also have an effect (Lemanceau et al., 1995; Marschner et al., 2001; Smalla et al., 2001; Berg et al., 2002, 2006; Briones et al., 2002; Heuer et al., 2002; Kowalchuk et al., 2002; Costa et al., 2006; 2007; Bremer et al., 2007; Weinert et al., 2009, 2010). The effects of the plant genotype on root-associated microbial communities have not yet been explored for plant protection, because the knowledge of specific rhizosphere populations and their interactions with plants is still very limited.
The great advantage of molecular fingerprints such as automated ribosomal intergenic spacer analysis, denaturing gradient gel electrophoresis (DGGE), single-strand conformation polymorphism or terminal restriction analysis (T-RFLP) is that a rapid comparative analysis of multiple samples can be performed that is essential for testing treatment effects and elucidating the temporal dynamics of bacterial communities in response to environmental gradients or experimental factors (Muyzer & Smalla, 1998; Fisher & Triplett, 1999; Forney et al., 2004; Kowalchuk et al., 2006; Smalla et al., 2007). While these methods are ideal tools to follow succession or the effects of soil types or plants on the microbial community composition, taxonomic information on the major players and how they respond to these factors are difficult to obtain. To increase the throughput of the detection of bacteria in complex samples such as soil, high-density 16S rRNA gene probe arrays have been developed. The so-called PhyloChip developed by Brodie (2007) allows the comprehensive detection and comparison of bacteria in soil and rhizosphere samples (Cruz-Martínez et al., 2009; DeAngelis et al., 2009). The PhyloChip used offers the potential to detect 8741 known operational taxonomic units (OTUs) simultaneously.
In a recent study, Weinert (2009) showed the effects of the potato cultivar on the bacterial community composition in the rhizosphere using DGGE fingerprints. Here, we used PhyloChips and 16S rRNA gene clone libraries to explore the taxonomic affiliation of bacteria colonizing the rhizosphere of three different potato cultivars grown at two sites with different soil characteristics. The approach chosen allowed an in-depth characterization of the bacterial taxa that were typical of the potato rhizosphere or that responded to the potato cultivar in their relative abundance at both field sites.
Materials and methods
Field design and sampling
In 2006, three commercial potato (Solanum tuberosum L.) cultivars, ‘Baltica’, ‘Désirée’ and ‘Sibu’, were grown in a randomized field trial at two sites in Southern Germany: Roggenstein and Oberviehhausen. Each cultivar was grown in four replicated plots. Samples taken at the flowering stage (EC60 according to Hack et al., 1993) were analysed. Each replicate composite sample consisted of the roots of five plants taken from one plot. The potato plants were removed carefully and shaken to detach loosely adhering soil. The roots were cut into pieces, combined and immediately brought to the laboratory. Further details on the soil properties and experimental design have been given by Weinert (2009).
Sample processing and extraction of total community DNA
Microbial cells were detached from 10 g of roots with adhering soil using a Stomacher laboratory blender (Seward, West Sussex, UK) for a 60-s mechanical extraction at high speed with 30 mL sterile water. This step was repeated three times, and microbial cells from collected extracts were harvested by centrifugation at 10 000 g for 15 min at 4 °C. Total community DNA was extracted from the pellet using the FastPrep FP120 bead beating system for cell lysis and the FastDNA SPIN Kit for soil (Q-Biogene, Carlsbad). The DNA was further purified using the Geneclean Spin Kit (Q-Biogene) according to the manufacturer's instructions.
Cloning and sequencing of 16S rRNA gene fragments
The 16S rRNA gene fragments were amplified from four replicates per cultivar and site using the primer pair F27 (5′-AGAGTTTGATCMTGGCTCAG-3′) and R1494 (5′-CTACGGYTACCTTGTTACGAC-3′) as described previously (Heuer et al., 2009). A total of 60 μL of PCR products were obtained for each cultivar by combining 15 μL per replicate and site. The PCR products were purified using the Geneclean Spin Kit (Q-Biogene), ligated into pGEM-T vectors and cloned in Escherichia coli JM109 as described by the manufacturer (Promega, Madison). The inserts were amplified using the primer pair SP6/T7 and sequenced by IIT Biotech (Bielefeld, Germany). Analysis of sequences with at least 400 reliable nucleotides was performed using both the seqmatch analysis tool of the Ribosomal Database Project II, release 9.61 (http://rdp.cme.msu.edu/), and blastn searches of GenBank. Multiple alignments of DNA sequences were performed with clustalx2 (2.0) and the DNA distance was calculated using the software package phylip (3.68). The nucleotide sequences were deposited in the GenBank database under accession numbers FJ845053–FJ845364.
PCR amplification of 16S rRNA genes for PhyloChip hybridization
Total community DNA of three replicates randomly selected from the four replicates per cultivar and site were amplified using an eight-temperature gradient PCR in an iCycler (Bio-Rad, Hercules) and 16S rRNA gene primers 27f (5′-AGAGTTTGATCCTGGCTCAG-3′) and 1492r (5′-GGTTACCTTGTTACGACTT-3′). Previously performed DGGE analysis already revealed little variability among the replicates per treatment (Weinert et al., 2009). Approximately 5 ng of total community DNA was used at each temperature in 25 μL reactions. The final concentrations were 1 × Ex Taq Buffer with 2 mM MgCl2, 300 nM each primer, 200 μM each dNTP (TaKaRa), 25 μg bovine serum albumin (Roche Applied Science, Indianapolis) and 0.625 U Ex Taq (TaKaRa, through Fisher Scientific, Pittsburgh). Eight replicate PCR amplifications were performed at a range of annealing temperatures from 48 to 58 °C with an initial denaturation at 95 °C for 3 min, followed by 25 cycles of 95 °C (30 s), annealing (30 s) and 72 °C for 2 min, and then a final extension for 10 min at 72 °C. PCR products from each annealing temperature of a sample were combined and an amount of 500 ng was applied to each PhyloChip (G2) following the previously described procedures (DeSantis et al., 2007), except that for biotinylation the GenChip Labeling Reagent (Affymetrix, Santa Clara) and terminal deoxynucleotidyl transferase (Promega) were used.
Statistical analysis
An OTU-level report was produced mainly as Brodie (2007) described for background subtraction, detection and quantification, except that normalization was carried out according to the average total array intensity (Ivanov et al., 2009).
A principal component analysis (PCA) was performed on log2-transformed normalized signal intensities, which were filtered to include only those OTUs with maximally 10% within-group SD/mean and minimally 2% total SD/mean. manova with five principal components explaining 95% of the total variance was performed to test for cultivar effects according to Glimm (1997). To identify OTUs responding to cultivar and/or site, a two-way anova of log-transformed normalized signal intensities for each OTU in conjunction with Tukey's test (unadjusted P<0.05) was applied using the software package r (2.8.0). An OTU was regarded as absent in a sample when <90% of the probes assigned to this OTU showed a positive hybridization signal. The signal intensities of these OTUs were shifted to 1 to avoid errors in log transformation. The effects of cultivar and/or site on higher taxonomic levels such as phylum, class, order and family were tested basically according to Glimm (1997). The fluorescent signal intensity of each OTU was log10 transformed, centred (to reach a 0 mean), standardized (to reach a SD of 1) and assigned to different taxonomic groups. These adjusted data were the basis for PCA using the ‘FactoMineR’ function of the r package. The matrix of sample coordinates on the first five components was tested using Wilks' Λ. In this case, the test is equivalent to the F-test with degrees of freedom 5 and 8 for site and 10 and 16 for cultivar.
Results
PhyloChip-based bacterial community analysis
PhyloChips comprising 350 000 oligonucleotides were used to gain insights into the structural diversity of bacteria in the rhizosphere of flowering potato plants of three different cultivars grown at two field sites. Amplified 16S rRNA gene fragments from total community DNA of three independent replicates per cultivar were hybridized with PhyloChips. A total of 2432 OTUs were detected in at least one of the 18 rhizosphere samples. The number of OTUs found per cultivar and site ranged from 1444 to 2015 (Table 1). In total, 43 phyla were detected, of which 13 phyla comprised 10 or more OTUs. The highest number of OTUs belonged to the Proteobacteria (46%), followed by Firmicutes (18%), Actinobacteria (11%), Bacteroidetes (7%) and Acidobacteria (3%). Among the proteobacterial OTUs, the highest numbers were affiliated to Gammaproteobacteria, followed by Alpha-, Beta-, Delta- and Epsilonproteobacteria (Table 1). There was a high degree of overlap in OTUs found in the different rhizosphere samples. More than 83% of the OTUs were detected in the rhizosphere of all potato cultivars, 65% were found in the rhizosphere of all cultivars at both field sites and 36% were common to all 18 samples. The relative proportion of the 10 most detected phyla was similar for all three cultivars at both sites (Table 1). Nevertheless, on lower taxonomic ranks, the field site had a pronounced effect on the taxonomic composition. Site-specific OTUs were mainly affiliated to the Actinobacteria, Burkholderiales, Clostridiales and Rhizobiales (Table 2). A considerably higher number of site-specific OTUs were detected in the rhizosphere of potato cultivars grown at the Roggenstein site compared with the Oberviehhausen site, indicating a higher detectable bacterial diversity.
Number of OTUs detected by PhyloChip hybridization in rhizosphere samples from three potato cultivars grown at two field sites
| Field site Oberviehhausen | Field site Roggenstein | |||||||||
| Phylum | Class | Order | Family | ‘Baltica’ | ‘Désirée’ | ‘Sibu’ | ‘Baltica’ | ‘Désirée’ | ‘Sibu’ | Total |
| Proteobacteria | Alphaproteobacteria | Bradyrhizobiales | 40 ± 3 | 43 ± 7 | 45 ± 4 | 55 ± 5 | 51 ± 6 | 48 ± 9 | 62 | |
| Rhodobacterales | 18 ± 3 | 22 ± 10 | 24 ± 4 | 38 ± 10 | 27 ± 15 | 25 ± 12 | 50 | |||
| Rhizobiales | 44 ± 8 | 47 ± 14 | 52 ± 5 | 65 ± 4 | 62 ± 6 | 57 ± 9 | 76 | |||
| Sphingomonadales | 36 ± 4 | 38 ± 13 | 43 ± 4 | 54 ± 3 | 51 ± 6 | 48 ± 7 | 66 | |||
| Others | 57 ± 6 | 60 ± 22 | 66 ± 6 | 82 ± 6 | 74 ± 8 | 71 ± 14 | 97 | |||
| Betaproteobacteria | Burkholderiales | Comamonadaceae | 50 ± 5 | 52 ± 11 | 54 ± 4 | 63 ± 3 | 62 ± 5 | 57 ± 7 | 71 | |
| Burkholderiales | Burkholderiaceae | 9 ± 2 | 10 ± 3 | 11 ± 4 | 17 ± 1 | 15 ± 3 | 13 ± 4 | 19 | ||
| Others | 26 ± 1 | 25 ± 2 | 27 ± 2 | 33 ± 1 | 32 ± 5 | 30 ± 4 | 37 | |||
| Rhodocyclales | Rhodocyclaceae | 11 ± 3 | 13 ± 5 | 15 ± 3 | 21 ± 3 | 17 ± 4 | 16 ± 7 | 24 | ||
| Others | 24 ± 5 | 26 ± 9 | 30 ± 3 | 42 ± 6 | 36 ± 7 | 31 ± 6 | 52 | |||
| Gammaproteobacteria | Enterobacteriales | 49 ± 16 | 66 ± 8 | 66 ± 6 | 72 ± 5 | 71 ± 6 | 53 ± 24 | 87 | ||
| Pseudomonadales | Pseudomonadaceae | 34 ± 4 | 36 ± 4 | 37 ± 2 | 39 ± 2 | 39 ± 4 | 33 ± 4 | 45 | ||
| Moraxellaceae | 5 ± 1 | 6 ± 1 | 7 ± 1 | 7 ± 1 | 7 ± 1 | 7 ± 1 | 8 | |||
| Xanthomonadales | Xanthomonadaceae | 11 ± 1 | 13 ± 5 | 14 ± 2 | 23 ± 3 | 19 ± 5 | 17 ± 7 | 29 | ||
| Others | 120 ± 29 | 139 ± 49 | 154 ± 20 | 180 ± 17 | 168 ± 32 | 138 ± 48 | 230 | |||
| Others | 120 ± 14 | 125 ± 25 | 133 ± 11 | 148 ± 3 | 136 ± 14 | 132 ± 25 | 171 | |||
| Actinobacteria | Actinobacteria | Actinomycetales | Microbacteriaceae | 14 ± 1 | 15 ± 3 | 15 ± 1 | 18 ± 2 | 18 ± 5 | 16 ± 3 | 25 |
| Micromonosporaceae | 16 ± 1 | 15 ± 2 | 16 ± 1 | 18 ± 2 | 17 ± 1 | 17 ± 1 | 19 | |||
| Streptomycetaceae | 15 ± 0 | 15 ± 0 | 15 ± 1 | 17 ± 1 | 15 ± 1 | 16 ± 1 | 18 | |||
| Micrococcaceae | 18 ± 1 | 18 ± 2 | 19 ± 0 | 20 ± 1 | 19 ± 1 | 20 ± 1 | 21 | |||
| Pseudonocardiaceae | 5 ± 1 | 4 ± 1 | 6 ± 1 | 8 ± 1 | 9 ± 0 | 8 ± 3 | 10 | |||
| Others | 88 ± 10 | 88 ± 24 | 101 ± 7 | 114 ± 6 | 103 ± 7 | 97 ± 24 | 128 | |||
| Others | 25 ± 2 | 27 ± 7 | 31 ± 6 | 35 ± 3 | 29 ± 4 | 31 ± 9 | 46 | |||
| BD2-10group | 1 ± 0 | 1 ± 1 | 1 ± 1 | 2 ± 0 | 1 ± 1 | 2 ± 1 | 2 | |||
| Firmicutes | Bacilli | Bacillales | 91 ± 19 | 89 ± 33 | 104 ± 4 | 117 ± 6 | 105 ± 13 | 96 ± 24 | 147 | |
| Lactobacillales | 26 ± 4 | 33 ± 13 | 34 ± 4 | 41 ± 4 | 35 ± 9 | 31 ± 12 | 55 | |||
| Clostridia | 113 ± 30 | 112 ± 50 | 131 ± 9 | 162 ± 14 | 151 ± 23 | 132 ± 33 | 196 | |||
| Others | 22 ± 2 | 26 ± 8 | 27 ± 6 | 35 ± 3 | 30 ± 7 | 28 ± 9 | 42 | |||
| Acidobacteria | Acidobacteria | Acidobacteriales | Acidobacteriaceae | 30 ± 1 | 29 ± 6 | 32 ± 1 | 34 ± 1 | 31 ± 4 | 31 ± 5 | 37 |
| Others | 27 ± 2 | 25 ± 8 | 29 ± 4 | 31 ± 1 | 25 ± 6 | 28 ± 7 | 38 | |||
| Bacteroidetes | Bacteroidetes | Bacteroidales | 18 ± 5 | 24 ± 8 | 24 ± 4 | 25 ± 4 | 28 ± 8 | 21 ± 6 | 43 | |
| Flavobacteria | Flavobacteriales | 31 ± 3 | 33 ± 6 | 35 ± 6 | 42 ± 4 | 40 ± 6 | 32 ± 8 | 58 | ||
| Sphingobacteria | Sphingobacteriales | 40 ± 6 | 40 ± 15 | 46 ± 7 | 52 ± 7 | 49 ± 7 | 43 ± 13 | 70 | ||
| Others | 4 ± 1 | 3 ± 1 | 3 ± 0 | 5 ± 1 | 4 ± 0 | 4 ± 1 | 5 | |||
| Spirochaetes | Spirochaetes | Spirochaetales | 22 ± 7 | 25 ± 13 | 27 ± 9 | 34 ± 1 | 26 ± 6 | 25 ± 14 | 37 | |
| Others | 183 ± 29 | 195 ± 74 | 216 ± 35 | 263 ± 19 | 237 ± 29 | 211 ± 54 | 311 | |||
| Sum | 1444 ± 222 | 1541 ± 461 | 1689 ± 170 | 2015 ± 138 | 1843 ± 252 | 1664 ± 410 | 2432 | |||
Taxa and numbers of OTUs preferentially detected at one of the two field sites
OTUs detected in more than five out of the nine samples at one site and less than four out of the nine samples at the other site.
Taxa and numbers of OTUs preferentially detected at one of the two field sites
OTUs detected in more than five out of the nine samples at one site and less than four out of the nine samples at the other site.
A PCA of the PhyloChip patterns showed differences between bacterial rhizosphere communities of the three potato cultivars (Fig. 1). At the Roggenstein site, the bacterial communities from the cultivars were more clearly separated, while for Oberviehhausen, mainly ‘Baltica’ was distinct from the other cultivars. In a global anova, manova with the first five principal components revealed a significant cultivar effect (P=0.014). Differences between the field sites (P<0.001) were mainly associated with principal components 1 and 3, explaining 61% and 11% of the total variance, respectively.
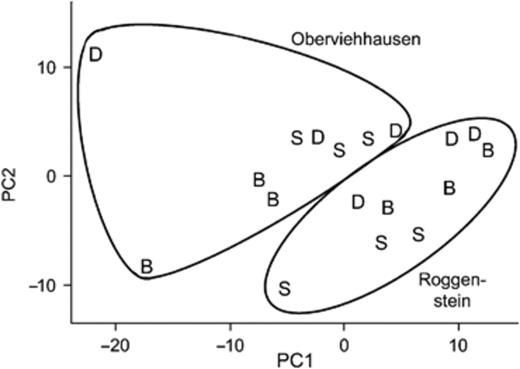
PCA of the PhyloChip data from the potato rhizosphere samples of the cultivars ‘Baltica’ (B), ‘Désirée’ (D) and ‘Sibu’ (S) grown at the field sites in Roggenstein and Oberviehhausen. The first and second principal components represented 61% and 20% of the total variance.
Normalized hybridization signal intensities were analysed using multiple two-way anova to identify OTUs discriminative between cultivars and/or sites (Table 3). In total, 9% of the detected OTUs responded to the cultivar and 28% differed between sites. A subset of 4% of the detected OTUs revealed a cultivar-dependent abundance at both sites. Those were 9 OTUs from Proteobacteria, three from Bacteroidetes, four from Firmicutes, two from Chloroflexi and one from Streptomycetaceae (Table 3).
Taxa and OTUs responding to site, cultivar or both as identified by two-way anova (P<0.05)
Bold indicates the significant effect of the cultivar.
ID of OTU according to the G2_chip taxonomy at http://greengenes.lbl.gov
Taxa and OTUs responding to site, cultivar or both as identified by two-way anova (P<0.05)
Bold indicates the significant effect of the cultivar.
ID of OTU according to the G2_chip taxonomy at http://greengenes.lbl.gov
A relatively high proportion of the OTUs belonging to the Enterobacteriales (17%), Pseudomonadales (40%), Micromonosporaceae (52%), Streptomycetaceae (83%) and Bacillales (12%) responded to the cultivar. In particular, signal intensities for 10 out of 19 detected OTUs belonging to the Micromonosporaceae were significantly higher for the cultivar ‘Sibu’ than for ‘Désirée’. Signal intensities of 13 OTUs out of 18 affiliated to the Streptomycetaceae were significantly higher for ‘Sibu’ than for ‘Désirée’, and four of the OTUs were more abundant for ‘Sibu’ than for ‘Baltica’. OTUs belonging to the Bacillaceae for 14 out of 91 detected OTUs showed significantly higher signal intensities for ‘Désirée’ than for ‘Baltica’. The abundance of 19 and 15 OTUs belonging to the Pseudomonadales was significantly higher in the rhizosphere of ‘Désirée’ in comparison with ‘Baltica’ and ‘Sibu’, respectively. Also, the signal intensities of seven out of 53 detected OTUs belonging to the Enterobacteriales were significantly higher for ‘Désirée’ than for ‘Baltica’ and ‘Sibu’. At higher taxonomic ranks (phylum, class, order, family), a significant effect of the cultivar was only observed for the family Streptomycetaceae (Table 3).
Clone library-based bacterial community analysis
Bacterial 16S rRNA genes were amplified from total rhizosphere DNA of the cultivars ‘Baltica’, ‘Désirée’ and ‘Sibu’, cloned and sequenced to taxonomically classify the abundant ribotypes based on phylogenetic sequence analysis. A total of 151 rRNA gene sequences for the Roggenstein site and 160 sequences for the Oberviehhausen site were obtained. dotur analysis revealed that the rarefaction curves were still steeply growing at a distance of 5%, but at a level of 30%, the curves reached a plateau, indicating that dominant phyla and classes were already detected. The majority of cloned 16S rRNA gene sequences in the six libraries had the highest sequence identity to sequences of uncultured bacteria. Overall, a total of 12 phyla and 17 classes were identified. The highest number of cloned 16S rRNA gene sequences at both field sites belonged to the Proteobacteria (181/312). These were mainly assigned to the Alphaproteobacteria, followed by the Betaproteobacteria and Gammaproteobacteria (Fig. 2). Interestingly, there were more ribotypes affiliated to the phylum Acidobacteria than to the Gammaproteobacteria. Furthermore, sequences affiliated to the phyla Bacteroidetes, Firmicutes, TM7 and Actinobacteria contributed to the libraries. Planctomycetes, Chloroflexi and Cyanobacteria were rarely represented and were only found in the rhizosphere of potato plants grown in Oberviehhausen. Rhizobiaceae, Sphingomonadaceae, Xanthomonadaceae, Acidobacteriaceae and TM7 were detected for all three cultivars from both sites (Fig. 2). Bradyrhizobiaceae were detected in all three libraries from the Roggenstein site, but in none of the libraries from the cultivars grown in Oberviehhausen. Planctomycetaceae were only found in the Oberviehhausen libraries (Fig. 2).
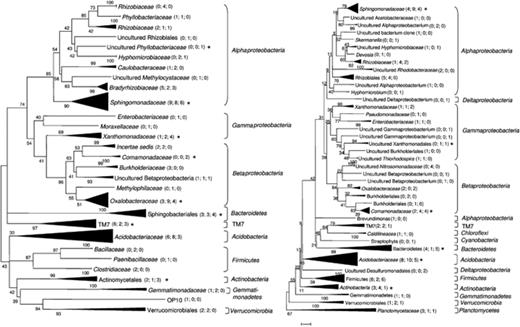
Neighbour-joining trees of 16S rRNA genes amplified and cloned from rhizosphere samples of three potato cultivars grown at the field sites in Roggenstein (left) and Oberviehhausen (right). The numbers in parentheses refer to the number of sequences originating from the cultivars ‘Baltica’, ‘Désirée’ or ‘Sibu’, respectively. Asterisks indicate sequences that corresponded to OTUs detected by PhyloChip hybridization.
Discussion
To date, several studies have investigated how different factors such as the site, the plant species and the cultivar shape the composition of bacterial communities in the rhizosphere of potato plants (Lottmann et al., 2000; Smalla et al., 2001; Heuer et al., 2002; Milling et al., 2004; Rasche et al., 2006; Becker et al., 2008; Van Overbeek & Van Elsas, 2008; Weinert et al., 2009). In most of these studies, cultivation-independent 16S rRNA gene fingerprints such as DGGE or T-RFLP were used to compare the effect of different environmental factors on the bacterial community composition. The composition of bacterial communities in the rhizosphere of potato plants was shown to be dynamic and influenced by the plant growth development stage, the year and the site. Although several bands from the DGGE patterns of potato rhizosphere communities were characterized by cloning and sequencing (Lottmann et al., 2000; Heuer et al., 2002), the taxonomic composition of potato rhizobacteria and how their abundance was affected by the plant genotype or the site remained largely unknown. In this study, the potential of PhyloChip hybridizations was exploited to gain insights into the type of bacteria residing in the vicinity of potato roots and to identify those that responded to the cultivar and the site. As three independent field replicates per cultivar and site were analysed, rigorous statistical testing could be carried out. The high-density 16S rRNA gene PhyloChip used not only has a resolution of almost 104 taxa but it also spans a range of detection of more than five orders of magnitude (Brodie et al., 2006). However, in contrast to DGGE 16S rRNA gene fingerprints that are assumed to reflect the relative abundance of the dominant bacterial populations, fluorescent signals cannot be taken as a measure of relative abundance. Instead, the strength of the PhyloChip approach is that the fluorescence signals of each OTU detected can be compared among the different treatments. The 2432 OTUs of the 8743 resolvable taxa on the PhyloChip that were detected in at least one of the samples were in the same range as the number of taxa detected previously by PhyloChip analysis in the rhizosphere of the graminoid Avena festuca grown in three replicate soil microcosms (DeAngelis et al., 2009). The data of the present study suggest that a wide range of OTUs differed in their relative abundance in the rhizosphere when the same cultivars were grown in two different soils. Compared with DGGE fingerprints that were generated from the same samples (Weinert et al., 2009), an improved resolution was achieved and taxonomic information on the bacterial populations in the rhizosphere of potatoes grown at two different sites and how their relative abundance was influenced by the cultivar could be provided. Thus, the PhyloChip analysis could help to overcome the bias of molecular analysis methods, described by Bent & Forney (2008) as the ‘tragedy of the uncommon’, to some extent. However, in less common ribotypes in the rhizosphere of potato plants (because 1 μL of the 100 μL total community DNA from 0.5 g rhizosphere pellet or a one to 10 dilution is used in the PCR), it is estimated that bacterial populations that are below 103 cells g−1 of soil will be detected neither by DGGE nor by PhyloChip hybridization or cloning and sequencing of 16S rRNA gene fragments amplified with bacteria-specific primers. The analysis of 16S rRNA gene fragments amplified from DNA extracted from rhizosphere bacteria uncovered an enormous diversity with more than 43 phyla. However, these numbers might be biased by the numbers of OTUs per phylum, class, order or family that can be detected theoretically. Furthermore, only ribotypes with high sequence similarity to 16S rRNA gene sequences that were present in the database at the time when this PhyloChip was developed will be detected. Therefore, we complemented the PhyloChip study with the cloning and sequencing of 16S rRNA gene fragments that were amplified from total community DNA. The latter approach offers the advantage of a resolution at the species level and allows the detection of novel ribotypes. Although the PCR conditions for the amplification of 16S rRNA gene fragments for PhyloChip hybridization differed slightly from those used for the amplification of 16S rRNA gene fragments for cloning and sequencing, all major phyla were detected by both approaches. However, while the PhyloChip approach enabled us to detect a total of 43 phyla, only 12 were detected in the 16S rRNA gene clone libraries. Interestingly, Acidobacteria were the second most frequently observed phylum in the clone libraries, but only 75 OTUs of the 2432 OTUs detected on the PhyloChip were affiliated to the phylum Acidobacteria. The 75 OTUs represented 77% of all acidobacterial OTUs on the PhyloChip. Furthermore, it is supposed that the full range of Acidobacteria diversity is not yet represented at the PhyloChip that was designed based on the sequences that were in the database in 2005 (Brodie et al., 2006). OTUs belonging to the Gammaproteobacteria were the most frequently detected proteobacterial OTUs on the PhyloChip, while only 8% of the cloned 16S rRNA gene sequences were affiliated to the Gammaproteobacteria. OTUs belonging to the Gammaproteobacteria might be less frequently represented in the clone libraries due to their lower relative abundance, while their presence was still detected by the PhyloChip. Epsilonproteobacteria were not at all present among the cloned 16S rRNA genes, but still their presence was detected by means of the PhyloChip. None of the previously reported 16S rRNA gene sequences from potato rhizosphere was affiliated to Epsilonproteobacteria (Heuer et al., 2002; Rasche et al., 2006). Alphaproteobacteria represented the most abundant ribotypes in the rhizosphere of all three cultivars at both sites, as the highest proportion of 16S rRNA gene sequences in all of the six clone libraries was affiliated to this class. Alphaproteobacteria also comprised the most abundant ribotypes in the clone libraries generated from 16S rRNA genes amplified from total community DNA from grass, oilseed rape and potato (McCaig et al., 1999; Kaiser et al., 2001; Heuer et al., 2002). While sequences with high similarity to Bradyrhizobium were obtained from all three cultivars grown in Roggenstein, these sequences were not detected among the libraries generated from the same cultivars grown in Oberviehhausen. A much less complex 16S rRNA gene-based taxonomic microarray was used recently by Sanguin (2006) to study the rhizosphere effect of maize on bacterial communities. Also, Sanguin (2006) generated 16S rRNA gene libraries for rhizosphere and bulk soil to complement the microarray data, and the proportion of clones belonging to the Proteobacteria was even higher in their study compared with the study presented here (97% compared with 62% for the libraries from Roggenstein and 53% for Oberviehhausen).
The relative proportion of phyla or classes detected by means of PhyloChips or by cloning and sequencing was remarkably similar for all cultivars grown at the two sites with rather different soil characteristics (Weinert et al., 2009). Our findings support the observations by Vandenkoornhuyse (2007) and DeAngelis (2009) that bacterial phyla that are only rarely or not at all represented by isolates can consistently be detected in the rhizosphere. Although the majority of OTUs in the rhizosphere of all potato cultivars from both sites were affiliated to the Proteobacteria, the number of OTUs with high sequence similarity to the candidate division TM7 or the Acidobacteria was remarkably high. Phyla affiliated to the Acidobacteria, the Verrucomicrobia or TM7 were detected at both sites, from all cultivars (except Verrucomicrobia, which were not detected in the clone libraries for ‘Sibu’). Acidobacteria, TM7, Verrucomicrobia and Chloroflexi were reported recently in a pyrosequencing-based study from endophytic communities in potato roots (Manter et al., 2010). The potential role of these taxa in the rhizosphere is still unknown. The use of stable isotopes (13C) might help to better link photosynthates with bacterial responders and elucidate the role of ribotypes belonging to candidate divisions or taxa that are rarely represented in isolate collections (Wu et al., 2008; Rasche et al., 2009). Vandenkoornhuyse (2007) showed recently that Acidobacteria responded to root exudates.
The PhyloChip analysis confirmed the recently reported conclusion from DGGE analysis that the effect of the cultivar on soil bacterial community composition is much less pronounced than the effect of the site that comprises soil characteristics, cropping history, pesticide applications as well as climatic effects. However, in contrast to DGGE, the PhyloChip analysis enabled us to test at different taxonomic levels for statistically significant cultivar effects. A relatively high proportion of OTUs belonging to the family Enterobacteriaceae displayed a significant response to the cultivar. OTUs affiliated to the Enterobacteriaceae were more abundant in the rhizosphere of the cultivar ‘Désirée’. The finding that OTUs of the Enterobacteriaceae contributed to the differences among cultivars is highly interesting as many bacterial pathogens belong to this family (Stavrinides, 2009). In particular, members of the genera Dickeya and Pectobacterium (formerly Erwinia) are responsible for severe losses of tubers. It might be speculated that the importance of Enterobacteriaceae becomes even more pronounced at later plant growth stages. However, none of the OTUs belonging to the cultivar differentiating Enterobacteriaceae detected by PhyloChip analysis was detected in the clone libraries, most likely because the Enterobacteriaceae did not belong to the dominant ribotypes.
manova testing revealed that the orders Pseudomonadales and Actinomycetales responded to the cultivar. In particular, Streptomycetaceae, Micromonosporaceae and Pseudomonadaceae showed the strongest response. The in vitro antagonistic activities and biocontrol effects have been shown frequently for strains belonging to these families (Haas & Défago, 2005; Weller, 2007; Raaijmakers et al., 2008; Berg & Smalla, 2009; Weinert et al., 2010). The cultivar-dependent differences for OTUs affiliated to Streptomycetaceae, Micromonosporaceae, Pseudomonadaceae or Enterobacteriaceae have implications not only for biocontrol but also for phytopathology. Quantification of the respective taxa by quantitative real-time PCR is suggested for future studies.
Acknowledgements
This work was funded by grant 0313277B from the Bundesministerium für Bildung und Forschung. G.-C.D. was supported by grant SPP1315 of the DFG. Part of this work was performed under the auspices of the US Department of Energy by the University of California, Lawrence Berkeley National Laboratory under contract DE-AC02-05CH11231 and funded by the Rathmann Family Foundation and the California State Water Resources Control Board Proposition 50 Clean Beaches Initiative grant. The authors would like to thank J. Dennert and F.X. Maidl for the perfect management of the experimental plots in Roggenstein and Oberviehhausen. I.-M. Jungkurth is gratefully acknowledged for critically reading the manuscript.
References
Author notes
Authors' contribution N.W., Y.P. and G.-C.D. contributed equally to this work.
