


Abstract
Type III secretion systems (T3SSs) of Gram-negative bacteria mediate direct interactions with eukaryotic cells. Pseudomonas spp. harboring T3SS genes (T3SS+) were previously shown to be more abundant in the rhizosphere than in bulk soil. To discriminate the contribution of roots and associated arbuscular mycorrhizal fungi (AMF) on the enrichment of T3SS+ fluorescent pseudomonads in the rhizosphere of Medicago truncatula, their frequency was assessed among pseudomonads isolated from mycorrhizal and nonmycorrhizal roots and from bulk soil. T3SS genes were identified by PCR targeting a conserved hrcRST DNA fragment. Polymorphism of hrcRST in T3SS+ isolates was assessed by PCR-restriction fragment length polymorphism and sequencing. Genotypic diversity of all pseudomonads isolated, whether or not harboring T3SS, was described by BOX-PCR. T3SS+ pseudomonads were significantly more abundant in mycorrhizal than in nonmycorrhizal roots and in bulk soil, and all were shown to belong to the phylogenetic group of Pseudomonas fluorescens on the basis of 16S rRNA gene identity. Four hrcRST genotypes were described; two only included isolates from mycorrhizal roots. T3SS+ and T3SS− pseudomonads showed different genetic backgrounds as indicated by their different BOX-PCR types. Taken together, these data suggest that T3SSs are implicated in interactions between fluorescent pseudomonads and AM in medic rhizosphere.
Introduction
Nonflagellar type III secretion systems (hereafter designated by type III secretion systems or T3SSs) were first discovered in Gram-negative bacterial pathogens and thus have long been associated with their virulence. They have been described as molecular syringes delivering virulence factors directly into the cytoplasm of eukaryotic host cells (Hueck, 1998). T3SSs have been more recently described in symbiotic bacteria such as rhizobia (Mazurier et al., 2006) and are now considered as also mediating mutualist and commensal interactions between bacteria and eukaryotes (Preston, 2007). It is now assumed that these protein delivery structures represent a general communication conduit between bacteria and their eukaryotic hosts: animals, plants, fungi, and protoctists (Coombes, 2009). T3SSs thus appear as central players in the adaptation of both parasites and mutualists to diverse hosts (Preston, 2007).
In pseudomonads, knowledge on T3SS mostly concerns animal pathogens belonging to the species Pseudomonas aeruginosa and phytopathogens belonging to the species Pseudomonas syringae (Sorg & Cornelis, 2009). In the context of acute infections due to P. aeruginosa, four T3SS effectors directly injected into human host cells are known to contribute to bacterial virulence (Engel & Balachandran, 2009). In plant-pathogenic bacteria, T3SSs are associated with (1) elicitation of the hypersensitive response (HR) in resistant host and nonhost plants and with (2) disease induction in susceptible host plants (Büttner & Bonas, 2006). In animal- and plant-pathogenic pseudomonads, the T3SS needle complex is a key determinant of pathogenicity, and T3SSs are therefore mostly regarded as virulence factors. However, Pseudomonas genus also includes nonpathogenic species that are ubiquitous and widespread in the environment (Bossis et al., 2000), especially in soils (Spiers et al., 2000). These saprophytic populations of soilborne pseudomonads were shown to carry cryptic T3SSs (Mazurier et al., 2004), indicating that the presence of T3SS is clearly not confined to pathogenic bacteria. Among saprophytic pseudomonads harboring T3SS, some strains appear to promote plant growth and/or health (Mulya et al., 1996; Preston et al., 2001; Mazurier et al., 2004; Rezzonico et al., 2004). In the plant growth-promoting (PGPR) Pseudomonas fluorescens SBW25, expression of T3SS genes was higher in the rhizosphere than in the bulk soil (Jackson et al., 2005), and T3SS was shown to be involved in the rhizosphere competence by the use of mutants affected in T3SS genes. T3SS was also reported to be implicated in the suppression, achieved by the PGPR strain P. fluorescens KD, of the disease caused by Pythium ultimum (Rezzonico et al., 2005). These studies point out a possible involvement of these secretion systems in the reciprocal interactions between fluorescent pseudomonads and eukaryotic organisms in the rhizosphere. This hypothesis is supported by our previous observations of a significantly higher frequency of fluorescent pseudomonads harboring T3SS in the rhizosphere compared with the bulk soil (Mazurier et al., 2004). A positive selection of T3SS+ pseudomonads was also reported in the mycosphere of ectomycorrhizal and saprophytic fungi (Warmink & van Elsas, 2008; Warmink et al., 2008). These observations are in favor of specific interactions in the rhizosphere promoting T3SS+ pseudomonads; however, these interactions need to be further analyzed. More specifically, the contribution of T3SS, in the complex multitrophic interactions between fluorescent pseudomonads and rhizospheric fungi, remains to be explored.
Most plant species (75%) establish arbuscular mycorrhizal associations with fungi belonging to Glomeromycota (Brundrett, 2009). In the mycorrhizosphere, corresponding to the soil zone surrounding and being influenced by mycorrhizas (Rambelli, 1973), interactions are known to occur between arbuscular mycorrhizal fungi (AMF) and fluorescent pseudomonads (de Boer et al., 2005; Bonfante & Anca, 2009). The possible involvement of T3SS in these interactions was assessed in the present study. More specifically, the promotion of T3SS+ pseudomonads in the mycorrhizosphere of Medicago truncatula was evaluated and the contribution to the promotion of AMF and the host-plant was differentiated. This was achieved by comparing the frequency and the diversity of T3SS+ fluorescent pseudomonads in isolates from (1) mycorrhizal roots (M. truncatula Jemalong J5 wild type, Myc+/Nod+), (2) nonmycorrhizal roots of a mutant impaired in its ability to establish arbuscular mycorrhiza (AM) symbiosis (Myc−/Nod−), and (3) bulk soil. Because the nonmycorrhizal plant genotype also differed from the mycorrhizal wild type by its inability to establish a nitrogen-fixing symbiosis (Nod− vs. Nod+), a mycorrhizal mutant impaired in its ability to nodulate (Myc+/Nod−) was included as a control to discriminate the possible influence of the fungal and bacterial symbioses on T3SS+ pseudomonad frequency.
Materials and methods
Plant growth conditions and bacterial strains
Medicago truncatula Gaertn. cv. Jemalong line J5 (Myc+/Nod+) and its symbiosis-defective mutants TRV48 (Myc+/Nod−) and TRV25 (Myc−/Nod−) (Sagan et al., 1995) were grown in a calcic silt-clay soil (Châteaurenard, France). The main soil characteristics were as follows: clay 26.6%, silt 49.6%, sand 26.8%, pH 7.9, CaCO3 27.9%, total organic matter 51.4 g kg−1, total N 2.79 g kg−1, C/N ratio 10.7, P2O5 0.801 g kg−1. TRV25 is mutated for the DMI3 (DMI= doesn't make infection) gene (Sagan et al., 1995; Catoira et al., 2000) and the mutation of TRV48 has been ascribed to gene Mtsym15 (Morandi et al., 2005). Soil and germinated seeds were prepared as described previously (Pivato et al., 2007). Briefly, soil was sieved at 4 mm; seeds were scarified and surface sterilized by gently shaking them in 98% sulfuric acid for 2 min, 95% ethanol for 5 min and 3.5% sodium hypochlorite solution for 10 min, and rinsed successively six times for 5 min in sterile demineralized water. Seeds were germinated on 0.7% agar (w/v) plates at 25 °C for 48 h. One germinated seed was transplanted per cylindrical polyvinylchloride container (diameter, 7 cm; height, 20 cm) filled with 380 g of soil. After transplantation in cylindrical containers, germinated seeds were covered by 10 g of sterilized Terragreen (OilDri-US special, Mettmann, Germany). Seven containers were prepared per plant genotype. Three additional containers were filled with soil and were kept uncultivated (bulk soil). All containers were placed randomly in a growth chamber with a 16 : 8 h light : dark photoperiod, a 23 : 18 °C light : dark thermoperiod, photosynthetically active radiation of 500 μmol m−2 s−1 at pot height and 50% relative humidity. Containers were weighed each day and water was added to maintain humidity at 55% soil water-holding capacity. They were moved randomly each day after watering.
Bacteria were isolated after 35 days of plant growth from the bulk soil, the rhizosphere, and the rhizoplane+root tissue of the three medic genotypes (J5, TRV48, TRV25). For bulk soil, three replicates corresponding to the three containers kept uncultivated were analyzed; 10 g of soil per replicate were suspended in 100 mL of sterile water and agitated at 200 r.p.m. for 15 min. For rhizosphere, and rhizoplane+root tissue compartments, seven replicates corresponding to the seven plants grown per plant genotype were analyzed. Each type of sample was processed as follows. Rhizosphere soil adhering to the roots was suspended in 100 mL of sterile water and agitated at 200 r.p.m. for 15 min, 100 mL of sterile water were added, and the suspension was agitated again for 15 min. The roots were removed from the suspension and kept for the preparation of the rhizoplane+ root tissue samples. The soil suspensions were mixed with a Waring Blender for 60 s. Root samples, including bacteria adhering to the root surface (rhizoplane) plus those present in the root tissues, were homogenized by blending for 2 min in 20 mL of sterile water with an Ultra-turrax homogenizer. Suspensions derived from the three different compartments were dilution plated on King's medium B (KMB) (King et al., 1954) supplemented with cycloheximide (100 mg L−1), chloramphenicol (13 mg L−1), and ampicillin (40 mg L−1) (Geels et al., 1985) and incubated for 48 h at 25 °C. For each suspension, three dilutions and three replicates per dilution were plated. Colonies displaying fluorescence under UV light (365 nm) were counted after 48 h. Results correspond to the means computed from the enumeration data obtained from each sample treated separately. To compare characteristics of bacterial isolates showing a similar level of occurrence, bacterial isolations from each compartment were always performed from samples diluted to the same level. Altogether, 350 bacterial fluorescent colonies were collected: 50 from the bulk soil (three replicates, 16–17 isolates per replicate) and 50 from the rhizosphere and from the rhizoplane+root tissue of each plant genotype (seven plant replicates, seven to eight isolates per plant genotype replicate from the two compartments sampled, resulting in 14–16 isolates per plant genotype replicate). These 350 isolates were subjected to single-colony isolation and cryopreserved at −80 °C in 25% glycerol. After isolation, all Pseudomonas strains were cultivated on KMB agar at 25 °C.
Evaluation of plant mycorrhization, nodulation, and growth
Assessment of root colonization by AMF was performed on 30 root pieces (each 1 cm long) per root system of each plant replicate. These pieces were cleared for 30 min at 60 °C in 10% KOH, stained with 1% methyl blue in lactic acid and finally mounted on slides (Pivato et al., 2007). The percentages of root fragments colonized by fungi (F%), the intensity of colonization of the root cortex (M%), and the arbuscular abundance in the mycorrhized root cortex (A%) of AMF were evaluated microscopically using the notation scale described by Trouvelot (1986) and freely available (http://www.dijon.inra.fr/Mychintec/Mycocalc-prg/download.html). The presence of root nodules was checked visually on each plant replicate. Plant growth was evaluated by measuring the dry mass of shoots (80 °C for 48 h) for each of the seven plant replicates per treatment.
PCR amplifications
For each of the 350 bacterial isolates obtained as described previously, PCR amplifications were performed on the total bacterial genomic DNA extracted and purified using the DNeasy TM Tissue Kit (Qiagen, Courtaboeuf, France) according to the manufacturers' instructions.
The presence of hrcRST genes coding structural components of T3SSs was detected by PCR using the method described previously by Mazurier (2004). PCR reactions were conducted in a programmable thermal cycler (PTC-200, MJ Research). Primers HRCR8092 5′-CCITT(C/T) ATCGT(C/T)AT(C/T)GA(C/T)(C/T)T-3′ and HRCT 8986 5′-CTGTCCCAGATIAICTGIGT-3′ (where I indicates inosine) were synthesized by Eurogentec (Angers, France). Aliquots (5 μL) of the PCR products were analyzed by electrophoresis in 0.9% agarose gels stained with ethidium bromide and photographed under UV illumination.
Genomic background of the isolates was assessed by a whole-cell rep-PCR fingerprinting method. This was achieved using the primer BOXA1R (5′-CTACGGCAAGGCGACGCTGACG-3′), which targets the BOX repetitive DNA sequences in bacterial genomes (Versalovic et al., 1994). BOX-PCR reactions were performed according to the protocol described by Rademaker (1997), except for the Taq Polymerase. Four units of Taq DNA polymerase (Qbiogene, Illkirsch, France) were used in each 25-μL BOX-PCR reaction. BOX-PCR fragments were separated overnight at 40 V in a 1.5% w/v Seakem LE agarose gel in TAE buffer. For each BOX-PCR fingerprint, the presence (1) or the absence (0) of 263 bands was scored visually and a binary data matrix was established. The matrix was imported as a text file for subsequent similarity and cluster analysis in the program ntsys-pc. A similarity matrix was calculated using the pair-wise Pearson product–moment correlation coefficient. Cluster analysis was performed by unweighted pair group method with arithmetic averages. Isolates presenting Pearson product–moment correlation coefficients ≥0.75 were assigned to a BOX-PCR genotype named with the same letter (a–y).
Amplification of 16S rRNA gene was performed commercially by Macrogen Inc. (Seoul, South Korea) using universal primers 27F (5′-AGAGTTTGATCMTGGCTCAG-3′), 518F (5′-CCAGCAGCCGCGGTAAT-3′), 800R (5′-TACCAGGGTATCTAATCC-3′), and 1492R (5′-TACGGYTACCTTGTTACGACTT-3′) in the frame of the ‘16S rRNA gene full sequencing’ service.
Restriction fragment length polymorphism (RFLP) of hrcRST PCR fragments
RFLP analysis of the c. 930-bp hrcRST PCR product amplified from the bacterial isolates was performed using the restriction enzymes AluI, RsaI, and TaqI. These three endonucleases were chosen for their ability to discriminate hrcRST genotypes described previously (Mazurier et al., 2004). Restriction patterns were determined by electrophoresis at 80 V in TAE buffer with 3.5% Metaphor agarose (Tebu, Le Perray-en-Yvelines, France).
DNA cloning, sequencing, and analysis
Before cloning, hrcRST PCR fragments were purified by electrophoresis in a 0.9% agarose gel in TAE, excised, and extracted from the gel using the DNA Gel Extraction Kit (Millipore, Saint-Quentin-en-Yvelines, France) according to the instructions of the manufacturer. The pGEM-T Easy vector System II (Promega, Charbonnières-les-Bains, France) was used for cloning as recommended. Nucleotide sequences of the cloned hrcRST PCR fragments and of the 16S rRNA gene PCR fragments were determined by Macrogen Inc. hrcRST sequences of 21 Pseudomonas strains, (1) P. aeruginosa PAO1 and UCBPP-P14, representative of P. aeruginosa pathogenicity islands (PAI) PAPI T3SS (Qiu et al., 2006), (2) P. syringae pv. tomato DC3000, Pseudomonas viridiflava LP23.1a and PNA3.3a, representative of P. viridiflava pathogenicity island T-PAI T3SS and of orthologous sequences (Araki et al., 2006), (3) Pseudomonas cichorii 83-1, P. viridiflava RMX3.1b, RMX23.1a, and ME3.1b, representative of P. viridiflava pathogenicity island S-PAI T3SS and of orthologous sequences (Araki et al., 2006), and (4) P. syringae pv. syringae B728a, P. syringae pv. phaseolicola 1448A, Pseudomonas gingeri CFBP2810T and P. fluorescens C7R12 representative of hrcRST cluster I described previously (Mazurier et al., 2004), P. fluorescens CFBP11364, F113, and CFBP11367 representative of cluster II (Mazurier et al., 2004), P. fluorescens CFBP11355, CFBP11348, SBW25, and CFBP11386, representative of cluster III (Mazurier et al., 2004), were included in the analysis as references. The hrcRST sequence of Pseudomonas mendocina ymp, recently sequenced, was included for comparison. Nucleotide sequence homology searches against major sequence databases were performed with program blast 2.2.18+ (http://www.ncbi.nlm.nih.gov/BLAST/). DNA and amino acid sequences were aligned, and phylogenetic trees were reconstructed by the neighbor-joining method (Saitou & Nei, 1987) as implemented in clustalw2 (Thompson et al., 1994). DNA distances were calculated with Kimura's two-parameter correction (Kimura, 1980). In all cases, positions with gaps in the multiple alignments were excluded from the analysis. The sequences have been deposited in EMBL and assigned accession numbers from FN666507 to FN666523 inclusive and from FN666543 to FN666559 inclusive.
Statistical analysis
Data on plant mycorrhization, root nodulation, plant growth, and enumeration of fluorescent pseudomonads were submitted to a one-way anova followed by pair-wise comparisons with Fisher's least significant difference test using the program statview. A P-value ≤0.05 was considered to be statistically significant.
A Kruskal–Wallis test (program jmp 7.0.1, SAS Institute, Cary, NC) was performed to compare, in the four experimental treatments, the proportion of T3SS+ isolates among the total pseudomonads from pooled rhizosphere and root-tissue compartments. Proportions expressed as percentages were submitted to arsine transformation before statistical analysis.
Chi-squared test was applied to assess differences in the occurrence frequencies of T3SS+ and T3SS− pseudomonads according to their origin (soil, plant genotype, and compartment) with sas (proc freq) software (SAS Institute). Yate's correction for continuity was applied to the chi-squared test when T3SS+ theoretical frequencies of occurrence were <5.
Results
Growth, development, mycorrhization, and nodulation of the plant genotypes
On the sampling date (35 days of plant growth), all plants reached the same development stage (shoot ramification of order 2; vegetative stage, VS3) (Mougel et al., 2006) and did not show any significant differences [Fisher's protected least significant difference (PLSD), P-values ranged from 0.083 to 0.697] in their growth with the shoot dry weight of J5, TRV48, and TRV25 being equal to 1.86, 1.81, and 1.63 g, respectively. The absence of mycorrhizal colonization in the Myc− mutant (TRV25) and of nodule in the Nod− mutants (TRV48 and TRV25) was confirmed. The mycorrhization level of both mycorrhizal genotypes J5 and TRV48 did not differ significantly (Table 1).
| Mycorrhization parameters | |||
| Plant genotypes | F% | M% | A% |
| J5 (Nod+Myc+) | 67 a | 34 x | 29 α |
| TRV48 (Nod−Myc+) | 64 a | 29 x | 26 α |
| TRV25 (Nod−Myc−) | 0 b | 0 y | 0 β |
| Mycorrhization parameters | |||
| Plant genotypes | F% | M% | A% |
| J5 (Nod+Myc+) | 67 a | 34 x | 29 α |
| TRV48 (Nod−Myc+) | 64 a | 29 x | 26 α |
| TRV25 (Nod−Myc−) | 0 b | 0 y | 0 β |
Mycorrhization parameters include: (1) the percentages of root fragments colonized by the fungi (F%), (2) the intensity of colonization of the root cortex (M%), and (3) the abundance of arbuscules in the root cortex (A%).
Mycorrhization parameters were submitted to angular transformation of percentage values before statistic analyses. Within a given column, mean values with the same letter were not significantly different (P≤0.05) according to the Fisher's least significant difference test.
| Mycorrhization parameters | |||
| Plant genotypes | F% | M% | A% |
| J5 (Nod+Myc+) | 67 a | 34 x | 29 α |
| TRV48 (Nod−Myc+) | 64 a | 29 x | 26 α |
| TRV25 (Nod−Myc−) | 0 b | 0 y | 0 β |
| Mycorrhization parameters | |||
| Plant genotypes | F% | M% | A% |
| J5 (Nod+Myc+) | 67 a | 34 x | 29 α |
| TRV48 (Nod−Myc+) | 64 a | 29 x | 26 α |
| TRV25 (Nod−Myc−) | 0 b | 0 y | 0 β |
Mycorrhization parameters include: (1) the percentages of root fragments colonized by the fungi (F%), (2) the intensity of colonization of the root cortex (M%), and (3) the abundance of arbuscules in the root cortex (A%).
Mycorrhization parameters were submitted to angular transformation of percentage values before statistic analyses. Within a given column, mean values with the same letter were not significantly different (P≤0.05) according to the Fisher's least significant difference test.
Comparison of fluorescent pseudomonads harboring hrcRST genes in mycorrhizal and nonmycorrhizal roots
Densities of the total fluorescent pseudomonad populations did not differ significantly (Fisher's PLSD, P-values ranged from 0.665 to 0.906) in the rhizosphere of the plant genotypes, 1.25 × 10⁶, 1.49 × 10⁶ and 1.6 × 10⁶ CFU g−1, respectively. In the rhizoplane+root tissue compartment, there were no significant differences between the nonmycorrhizal genotype TRV25 (1 × 10⁵ CFU g−1), and each of the two mycorrhizal genotypes, J5 (2.3 × 10⁵ CFU g−1, Fisher's PLSD, P=0.312) and TRV48 (5.14 × 10⁴ CFU g−1, Fisher's PLSD, P=0.098). Bacterial densities were significantly the lowest in bulk soil (3.78 × 10³ CFU g−1, Fisher's PLSD, all P-values <0.001), indicating an enrichment of soilborne fluorescent pseudomonads in the rhizosphere of all plant genotypes.
Altogether, 350 isolates of indigenous fluorescent pseudomonads were screened for the presence of three T3SS genes, hrcR, hrcS, and hrcT, using a PCR method previously developed for the detection of these genes in a wide range of Pseudomonas (Mazurier et al., 2004). hrcRST sequences were detected by PCR in 51 of the 350 fluorescent Pseudomonas spp. analyzed. The proportion of these T3SS+ isolates among total populations of fluorescent pseudomonads differed significantly in mycorrhized plants, nonmycorrhized plants, and bulk soil (Kruskal–Wallis test: χ2=7.909, d.f.=3, P=0.048). The distribution of the T3SS+ isolates according to the plant genotypes differed significantly based on their ability to establish mycorrhizal symbiosis (Table 2A). Forty-eight out of the 51 T3SS+ pseudomonads were detected in the mycorrhized genotypes J5 and TRV48, and only three in the nonmycorrhized genotype TRV25. None of the fluorescent pseudomonads isolated from bulk soil harbored hrcRST sequences. No significant difference was found between the distribution of hrcRST+ fluorescent pseudomonads in the mycorrhized plant genotypes, whether nodulated (J5) or not (TRV48) (Table 2B). For a given plant genotype, the occurrence frequency of T3SS+ pseudomonads did not differ significantly between the two compartments sampled: rhizosphere and rhizoplane+root tissue (17 and 11 in J5, 8 and 12 in TRV48, 2 and 1 in TRV25; χ2=2.25, d.f.=1, P=0.325).
Occurrence frequencies of fluorescent pseudomonads harboring hrcRST genes (T3SS+) or not (T3SS−)
Comparison of the occurrence frequencies of T3SS+ and T3SS− fluorescent pseudomonads in mycorrhized Medicago truncatula (J5, TRV48), non-mycorrhized M. truncatula (TRV25), and bulk soil (A). Pairwise comparisons of the corresponding occurrence frequencies (B).
Table 2A: (d.f.=3, N=350)=36.138, P<0.0001.
+, PCR product of expected size and hybridizing with the probe C7hrcRST as described previously (Mazurier et al., 2004).
−, no PCR visible product and no hybridization signal.
Yate's correction was applied.
NS, nonsignificant; S, significant.
Genotypic diversity of hrcRST+ fluorescent pseudomonads
Diversity of hrcRST sequences
Two of the 51 hrcRST-positive isolates yielded PCR products that were too weak to allow RFLP analysis. Analysis of the PCR fragments was performed on the remaining 49 isolates. Results are presented in Table 3. Among the hrcRST+ isolates, four distinct hrcRST-RFLP groups were delineated: group 1 (6 isolates), group 2 (6 isolates), group 3 (21 isolates), and group 4 (16 isolates). hrcRST+ isolates belonging to a given group originated from at least two distinct plants (Table 3). Groups 1 and 2 were closely related, as the isolates belonging to these groups shared two of the three restriction patterns.
Distribution of 49 (T3SS+) isolates of fluorescent Pseudomonas spp. in the hrcRST RFLP groups and BOX-PCR types according to their origin
Numbers designate the hrcRST-RFLP groups obtained with three restriction enzymes: 1 (AAA), 2(ADA), 3(BBB), and 4 (CCC); letters designate restriction patterns obtained with AluI, RsaI, and TaqI, respectively.
Numbers in parentheses designate the number of plants from which the isolates originate.
Uncl., unique BOX-PCR patterns that remained unclustered.
All the isolates from groups 1 and 2 originated from mycorrhized plants (J5 and TRV48). Sequencing of the c. 900-bp hrcRST gene fragment was performed on a third of the isolates (17/51) of the four hrcRST-RFLP groups. Sequence similarity searches in databases were performed on hrcRST sequences. For all sequences of the representative strains belonging to the groups 1, 2, 3, and 4, the highest scores were recorded with P. gingeri CFBP2810T (81%), P. gingeri CFBP2810T (80%), P. fluorescens CFBP11364 (95%), and P. fluorescens CFBP11367 (98%), respectively. Subsequent phylogenetic analysis strongly supported the classification based on hrcRST-RFLP and confirmed (1) the occurrence of four distinct genotypes and (2) the close relationship between isolates belonging to genotypes 1 and 2 (Fig. 1). Sequences of the hrcRST-PCR fragment were compared with the corresponding sequences of pseudomonad reference strains. The 38 hrcRST sequences from Pseudomonas (17 from isolates obtained in the present study and 21 from reference strains) were distributed into five clades (Fig. 1). Isolates from M. truncatula were included in two of these five clades, A and C, corresponding to the hrcRST similarity clusters II and I (Mazurier et al., 2004), respectively. Clade A encompassed isolates belonging to hrcRST genotypes 3 and 4; none of the isolates studied fell in clade B corresponding to hrcRST similarity cluster III (Mazurier et al., 2004). Clade C encompassed isolates belonging to hrcRST genotypes 1 and 2, together with pathogenic pseudomonads and the PGPR reference strain P. fluorescens C7R12 (syn. CFBP5759). Clade D corresponded to phytopathogenic pseudomonads representative of P. viridiflava pathogenicity island S-PAI T3SS and of orthologous sequences. Finally, the P. aeruginosa strains, more distant from others, were grouped in Clade E.
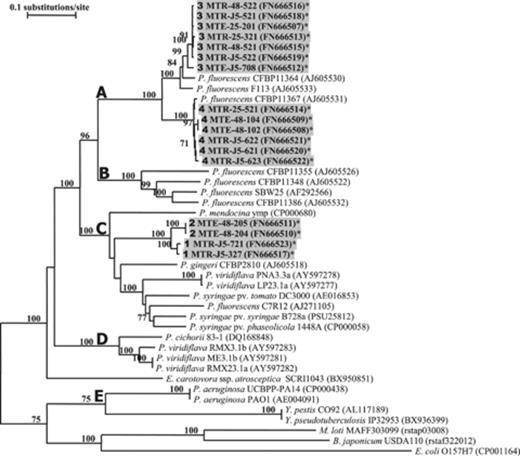
Neighbor-joining tree based on the alignment of 890-bp hrcRST sequences of Pseudomonas isolates obtained from Medicago truncatula roots (indicated in grey shading), and of reference strains available in genome databases. Accession numbers are indicated in parentheses. *Sequences obtained in this study. Bootstrap values from 1000 resamplings are indicated for each branch as percentages, and values <70% are not shown. For M. truncatula isolates, hrcRST-RFLP groups are indicated in bold in front of the strain name. Scale bar indicates the number of nucleotide substitutions per site.
Genotypic background of hrcRST+ isolates
The genetic diversity of the 350 fluorescent pseudomonads isolates was analyzed by BOX-PCR. At a cut-off of 75%, 25 BOX types, encompassing the majority (89.6%) of the isolates, were delineated (data not shown). Isolates that displayed unique BOX-PCR patterns remained unclassified (Uncl.). Among the 51 hrcRST+ isolates, 47 were distributed in five BOX types (a, b, j, l, and p), and four displayed unique BOX-PCR patterns (Table 3). There was a correlation between BOX types and hrcRST genotypes; all the isolates belonging to BOX types a, b, j, l, and p were hrcRST+, and within each of these BOX types, all isolates shared the same hrcRST genotype (Table 3). Distinct BOX types were found in isolates belonging to the hrcRST genotypes 3 and 4, suggesting a potential horizontal gene transfer. The 20 remaining BOX types included only hrcRST− isolates (data not shown).
Relationships between hrcRST and 16S rRNA gene polymorphism
16S rRNA gene sequences were obtained for the 17 isolates representative of the four hrcRST genotypes and of every BOX-PCR described for the T3SS+ isolates. The results of sequence similarity searches in databases revealed that the closest relatives of these 17 pseudomonads harboring hrcRST genes belong to the P. fluorescens species: representatives of genotypes 1 and 4 shared 99% identity with P. fluorescens Pf29A (DQ473439) and representatives of genotypes 2 and 3 shared 99% identity with P. fluorescens F113 (AJ278814). Phylogenetic analysis of the 16S rRNA gene sequences confirmed this close relationship because, in addition to Pf29A and F113, all T3SS+Medicago isolates clustered together with four other strains of P. fluorescens included as references (Fig. 2). hrcRST genes and 16S rRNA gene phylogenies stressed distinct relationships between indigenous fluorescent pseudomonads. Indeed, on the basis of hrcRST sequences, the closest relationships were observed between genotypes 1 and 2 and between genotypes 3 and 4 (Fig. 1), whereas 16S rRNA gene sequence analysis grouped together genotypes 1 and 4, and genotypes 2 and 3, respectively (Fig. 2).
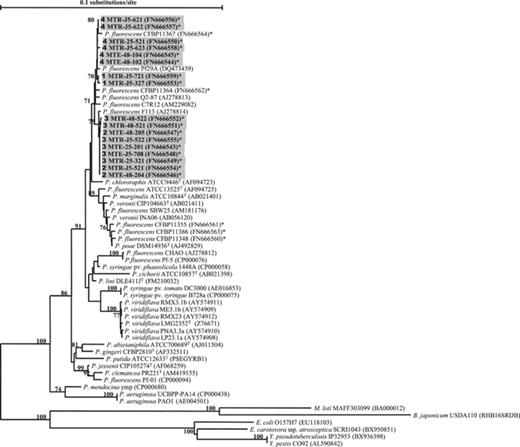
Neighbor-joining tree based on the alignment of 1390-bp 16S rRNA gene sequences of Pseudomonas isolates obtained from Medicago truncatula roots (indicated in grey shading), and of reference strains available in genome databases. Accession numbers are indicated in parentheses. *Sequences obtained in this study. Bootstrap values from 1000 resamplings are indicated for each branch as percentages, and values <70% are not shown. For M. truncatula isolates, hrcRST-RFLP groups are indicated in bold in front of the strains name. Scale bar indicates the number of nucleotide substitutions per site. T, type strain.
Discussion
Data from the present study demonstrate the enrichment of T3SS+ pseudomonads in the root compartments (rhizosphere, rhizoplane+root-tissue) compared with the bulk soil. Indeed, no T3SS+ pseudomonads were detected in the bulk soil whether all the T3SS+ pseudomonads isolated in the present study originated from the root compartments of M. truncatula. These findings are in agreement with data from a previous study using both a different soil and a different host-plant (Mazurier et al., 2004). Because T3SSs are known to mediate intimate cellular interactions between bacteria and eukaryotes, their increased representation in the rhizosphere suggests their involvement in the complex interactions of the fluorescent pseudomonads with the host-plant. However, the rhizosphere not only includes plant roots but also other eukaryotic organisms such as associated fungi, especially those establishing AM with the roots (Smith & Read, 2008). Therefore, the promotion of T3SS+ pseudomonads in the rhizosphere could be ascribed to their interactions with the roots themselves and/or with the AM of the mycorrhizal roots (Nazir et al., 2010).
An original approach was applied to discriminate the promotion of T3SS+ pseudomonads mediated by the roots when mycorrhized or not. This approach consisted of (1) the cultivation of genotypes of M. truncatula, naturally mycorrhizal or not, in a nonsterilized soil and (2) the frequency assessment of the T3SS+ pseudomonads associated with these plant genotypes and the corresponding bulk soil. This strategy allowed us to show that the increased density of T33S+ pseudomonad in the rhizosphere was mostly related to AMF association with the roots rather than to the roots themselves. The occurrence frequency of T3SS+ pseudomonads was significantly higher in mycorrhizal (28% in J5 and 20% in TRV48) than in nonmycorrhizal roots (3% in TRV25), the latter being not significantly different from that of the bulk soil (0). The distributions of T3SS+ pseudomonads were similar in both mycorrhizal genotypes, whether nodulated or not by indigenous rhizobia, confirming the decisive role of the mycorrhizal endosymbiosis in the enrichment of T3SS+ pseudomonads. The relation between this enrichment and the presence of AM was strengthened by minimizing possible biases, especially thanks to the choice of a fertile soil supporting a similar growth of mycorrhized and nonmycorrhized plant genotypes resulting in similar carrying capacities of the plant rhizospheres for fluorescent pseudomonads. The positive selection of pseudomonads harboring T3SS genes by AM in the rhizosphere reported here is consistent with previous observations made in the mycosphere of different fungi. T3SS+ pseudomonads were shown to be enriched in the mycosphere of the ectomycorrhizal fungus Laccaria proxima (Warmink & van Elsas, 2008) and appeared to be highly represented among isolates from the mycosphere of numerous ectomycorrhizal or saprophytic fungi (Warmink et al., 2008).
Medicago truncatula TRV25 (Myc−/Nod−), which did not promote T3SS+ pseudomonads in contrast to J5 (Myc+/Nod+) and TRV48 (Myc+/Nod−), is known to differ from these genotypes by the absence of AM hypha and arbuscules in planta but not by the epiphytic colonization of AMF. TRV25 is indeed mutated for the DMI3 gene (Catoira et al., 2000) that still allows an extensive hyphal branching and appressoria formation during the presymbiotic stage, but fully blocks the penetration of plant epidermis by the hypha (Sagan et al., 1995; Catoira et al., 2000; Morandi et al., 2005). The positive selection of T3SS+ pseudomonads in the rhizosphere of mycorrhized M. truncatula (J5 and TRV48) would therefore be related to the symbiotic and not to the presymbiotic root colonization by AMF. Further colonization of the root surface by extraradical hyphae, following internal root colonization by intraradical hyphae, may have led to an increased fungal biomass and activity, and have also contributed to the T3SS+Pseudomonas promotion. This would be in agreement with the observations made by Toljander (2006) on the attachment of fluorescent pseudomonads to extraradical hyphae after establishment of AM symbiotic association. Several other authors also reported association of pseudomonads with hyphae of AMF (Bianciotto et al., 1996; Roesti et al., 2005; Bharadwaj et al., 2008; Pivato et al., 2008).
From an evolutionary point of view, because the density of T3SS+ pseudomonads appears to be promoted by AM, one may expect that these bacteria would at least be nondeleterious or even beneficial to the fungal symbiosis. A similar hypothesis was previously proposed when identifying bacterial groups preferentially associated with AM, and was supported experimentally by demonstrating that these bacterial groups were indeed favorable to the mycorrhization (Offre et al., 2008; Pivato et al., 2009). T3SS+ pseudomonads selected by mycorrhizal roots might then be favorable to AM. Several studies have reported the ability of pseudomonads to act as mycorrhizal helper bacteria (MHB) (Frey-Klett et al., 2007; Nazir et al., 2010). Our hypothesis is supported by the fact that two P. fluorescens strains C7R12 and F113, harboring T3SS genes and included in the present study as references, were indeed previously shown to act as MHB(Barea et al., 1998; Pivato et al., 2009). Mechanisms underlying AM promotion by fluorescent pseudomonads potentially may be expressed during asymbiotic, presymbiotic, and symbiotic stages of mycorrhizal fungi life cycle. So far, information on the beneficial effect of MHB pseudomonads mostly concerns the former (Frey-Klett et al., 2007; Pivato et al., 2009; Nazir et al., 2010). As examples, the two MHB strains C7R12 and F113 were previously shown to promote the saprophytic growth and root colonization by AMF (Barea et al., 1998; Pivato et al., 2009). Enrichment of T3SS+ pseudomonads in the rhizosphere during the symbiotic stage of AMF life cycle suggests for the first time that T3SS might play a role in the MHB effect during that phase of the AMF life. However, one should keep in mind that the observations were made on a limited number of isolates, meaning that only the most abundant populations of fluorescent pseudomonads harboring hrcRST genes were taken in account. Additional data relying on the quantification of these genes by qPCR on the whole pseudomonad community, following a similar approach as that followed by Warmink & van Elsas (2008), would therefore strengthen and extend our observations and conclusions.
The diversity of T3SS+ and T3SS− pseudomonads was compared on the basis of their BOX types. The corresponding results indicated that their genetic background differ, suggesting that they have evolved separately.
Among T3SS+ pseudomonads, diversity of T3SSs was characterized on the basis of the polymorphism of hrcRST sequences. Data from our study support the relevance of the hrcRST sequence as a marker for T3SS phylogeny analysis among pseudomonads. Indeed, the sequence analysis of hrcRST fragments (1) allowed the discrimination of the strains, representative of the three T3SS-associated pathogenicity islands, PAPI, T-PAI, and S-PAI, in three distinct clades and (2) confirmed the phylogeny, previously obtained with 25 PAI genes, of the phytopathogenic strains P. viridiflava PNA3.3a, LP23.1a, RMX3.1b, RMX23.1a, ME3.1b, P. cichorii 83-1, and P. syringae DC3000 (Araki et al., 2006). Phylogeny analysis of hrcRST in pseudomonads isolated from mycorrhizal and nonmycorrhizal roots indicate that they were distributed in two well-differentiated clades (A and C), suggesting that the corresponding sequences have evolved separately. Clade A encompassed, together with other rhizospheric strains, the majority of the pseudomonads isolated from medic rhizosphere distributed in genotypes 3 and 4. In contrast, clade C included pseudomonads isolated in the present study (gentotypes 1 and 2), which were isolated only from mycorrhizal roots, together with phytopathogenic pseudomonads. These results indicate that, on the basis of their T3SS gene sequences, pseudomonads exclusively associated with mycorrhizal roots are more closely related to pathogenic pseudomonads than those associated with mycorrhizal and not mycorrhizal roots.
Incongruencies were found between the hrcRST and 16S rRNA gene phylogenies. Indeed, genotypes distributed in the two distinct hrcRST clades A and C were included in two groups taxonomically very close and related to Pseudomonas strains previously assigned to the species fluorescens. These incongruencies may not be surprising as horizontal gene transfer is considered to be a major force in T3SSs evolution (Gophna et al., 2003; Pallen et al., 2005). These results are compatible with an evolution scheme previously described among phytopathogenic pseudomonads. Araki (2006) found two paralogous T3SS-associated pathogenicity islands in P. viridiflava. One PAI was associated with increased virulence on tobacco and decreased virulence on Arabidopsis, while the other confers the opposite host-specific virulence phenotypes. Balancing selection appears to be maintaining each PAI within this species, perhaps because of the heterogeneous distribution of possible hosts (Araki et al., 2006).
In conclusion, data presented in this study confirm the enrichment of T3SS+ in the rhizosphere and indicate that this enrichment is related to the mycorrhizal association and not to the roots themselves. These observations suggest that T3SSs may mediate interactions between these bacteria and AMs.
The possible involvement of T3SS in the AM promotion by P. fluorescens C7R12 is currently under investigation. Further studies of T3SS+ pseudomonads are required to shed new light on host–microorganism interactions and thus bring additional comprehensive information on the mechanisms implied in complex interactions in the rhizosphere between pseudomonads and eukaryotes.
Acknowledgements
This work was funded by the Regional Council of Burgundy, RCB (Dijon, France). This work was supported by a doctoral grant to A.V. by ‘Conseil Régional de Bourgogne’ and INRA (EA, SPE). The authors thank Joy Bergelson (University of Chicago, USA) for kindly providing P. viridiflava and P. cichorii PAI and 16S rRNA gene sequences. The authors are grateful to Gerard Duc for providing medic seeds, to Dirk Redecker for rereading the manuscript and discussions, and to Matt Shirley for correcting the English text.
References
Author notes
Present address: Agnès Robin, CIRAD, INRA, IRD, SupAgro, UMR 1222 ‘Eco&Sol Ecologie Fonctionnelle et Biogéochimie des Sols’, 2 place Viala, 34060 Montpellier, France.
