


Abstract
Increased carbon translocation to the rhizosphere via ‘leakage’ induced by low amounts of plant parasitic nematodes can foster microorganisms. The effects of the root-knot nematode Meloidogyne incognita on microbial biomass (Cmic) and community structure (phospholipid fatty acids) in the rhizosphere of barley were studied. Inoculation densities of 2000, 4000, and 8000 nematodes were well below the threshold level for plant damage. A 13CO2 pulse-labelling was performed to assess the distribution of assimilated 13C in the rhizosphere. Infection with M. incognita increased the carbon concentration in shoots, and enhanced root biomass slightly. The presence of nematodes did not affect microbial biomass, but significantly changed the allocation of the recent photosynthate. Less plant carbon was sequestered by microorganisms with increasing nematode abundance. Microbial community structure was distinctly altered in the early stages of the plant–nematode interactions. Both, bacteria and fungi, showed a positive response with 2000, and a negative one with 4000 and 8000 M. incognita added. The results suggest that low-level root herbivory still imposes a considerable carbon demand, and that proliferation of microorganisms due to increased rhizodeposition may be short-termed. The carbon flow to rhizosphere microbial communities is likely dependent on the specific nematode–plant association and the developmental stage of the nematode in the host.
Introduction
Over the last decade, the mechanisms by which foliar herbivory indirectly affects soil biota and associated belowground processes have increasingly been recognized (Bardgett et al., 1998; Van der Putten et al., 2001; Wardle et al., 2004). These effects are thought to be either due to alterations in detrital inputs into the soil (e.g. quality and amount of plant litter) or due to nondetrital inputs through changes in plant carbon allocation (e.g. root growth and exudation) (Bardgett & Wardle, 2003). The latter was shown to promote rhizosphere microbial populations and to facilitate nutrient mineralization and plant growth (Holland, 1995; Hamilton & Frank, 2001). In addition, there is evidence that belowground herbivory comparably changes soil carbon and nutrient flows and is, therefore, likely to have a major impact on soil microbial community dynamics and subsequently nutrient cycling (Denton et al., 1999; Grayston et al., 2001; Tu et al., 2003).
Plant parasitic nematodes, often referred to as ‘hidden enemies’, are among the most widespread and important herbivores causing crop loss (Cohn et al., 2002). They affect host plants by breaking down cell structure, removing cell contents, disrupting physiological processes, and modifying genetic expression (Williamson & Gleason, 2003; Davis et al., 2004). These direct interactions of nematodes with their host modify microbial communities inside and outside roots. Pathogenic fungi as well as endophytic bacterial strains were found to preferentially colonize the rhizoplane and galled tissue of nematode infested roots, likely due to attraction of motile stages by root leachates (Zentmyer, 1961; Hallmann et al., 1998, 2001; El-Borai et al., 2003). Nematode attack can affect plant symbiotic relationships and depress colonization of roots and sporulation of mycorrhizal fungi (Francl, 1993; Kesba & Al-Sayed, 2006). On the other hand, in legume–rhizobial associations the number of nodules and amount of nitrogen fixed was enhanced in infested plants (Baldwin et al., 1979). Overall, this indicates a tight link between herbivore nematodes and soil microorganisms, and striking parallels can be drawn between the nematode–plant and microbial–plant interactions (Williamson & Gleason, 2003; Bird 2004).
While these immediate plant-related nematode–microbe interactions have received considerable attention, indirect effects on rhizosphere communities are poorly understood. Once parallels are drawn, nematode herbivory may be very similar to aboveground herbivory. It is well established that grazing by bacterial-feeding nematodes enhances mineralization processes in the soil and liberates nutrients fixed in microbial biomass for plant uptake (Freckman, 1988; Chen & Ferris, 1999). Recently, nematode-induced ‘leakage’ from roots was shown to increase carbon translocation to the soil microbial biomass (Yeates et al., 1998, 1999b; Yeates, 1999). Low amounts of root herbivory by nematodes can facilitate the allocation of photoassimilate carbon to roots, resulting in a higher exudation that stimulates microorganisms in the rhizosphere (Bardgett et al., 1999). This implies that the activity of root-feeding nematodes imposes a similar mechanism on microbial turnover as does microfaunal grazing. By this, belowground herbivory by nematodes contributes to the regulation of soil microbial communities and thus ecosystem dynamics.
The economically most important groups of nematodes are the sedentary endoparasites, which include the genera Heterodera and Globodera (cyst nematodes), and Meloidogyne (root-knot nematodes). The latter, so-called after the characteristic root galls they form on many hosts, infect thousands of plant species and cause severe losses in yields of many crops (Bird, 2004). In the present greenhouse experiment, the nematode Meloidogyne incognita, was used with barley (Hordeum vulgare cv. Europa) as the host plant. Nematodes were applied in different inoculation densities, with quantities assumed to be below the threshold for plant damage. A complete life cycle of M. incognita was investigated in order to distinguish between the short-term effects of wounding and the long-term impact of nematode–plant interactions. The response of the microbial community was assessed by phospholipid fatty acid (PLFA) pattern and the carbon sequestration by tracing the 13C signal of photoassimilates after 13C pulse-labelling. The aim was to assess if low amounts of root herbivory (1) cause differences in carbon availability for microorganisms, (2) affect soil microbial biomass and community structure, and (3) in turn result in beneficial effects on plant biomass production.
Materials and methods
Soil substrate
The soil substrate used for the experiment was a Chernozem [Corg 1.4%; PCAL 93 mg kg−1; Ntotal 0.06%; KCAL 137 mg kg−1; pH (CaCl2) 7.0]. The soil was sieved at a 2 mm mesh size, mixed, and frozen two times at −20 °C for 48 h to eliminate soil animals. Defaunation efficiency and possible recolonization by nematodes were assessed by extracting nematodes from the soil directly after freezing (n=3) and from control pots (n=5) at week 1, 2, 3, and 4 of the experiment using a modified Baermann method (see Ruess, 1995). After the freezing step, nematode numbers were below 0.04 individuals g−1 DW soil. At weeks 1 and 2 no specimens, and at weeks 3 and 4 between 0.04 and 0.08 individuals g−1 DW soil were detected. These nematodes belonged to the genera Aphelenchoides (fungal feeder), Filenchus (root hair/fungal feeder), and Teratocephalus (bacterial feeder).
Plant culture
Barley (Hordeum vulgare L. cv. Europa) seeds were surface-sterilized and germinated in moist filter paper soaked with 2.5 mM CaSO4. After 7 days, two seedlings each were transferred to pots (volume 1.3 L) filled with 1026 g soil (DW). Soil moisture was adjusted daily to 65% of the water holding capacity by gravimetric determination and addition of distilled water. Pots were kept in a greenhouse during July and August 2005 with a daytime mean temperature of 24 °C. A water-cooling system maintained soil temperature at an average of 15.3 °C during the experimental period. Five days after planting into pots, fertilization was performed by application of 25 mg K kg−1 as 0.5 M K2SO4, 25 mg P kg−1 as 0.05 M Ca(H2PO4)2, 25 mg Mg kg−1 as 0.5 M MgSO4, and 50 mg N as 0.5 M Ca(NO3)2.
Experimental design and 13CO2 pulse-labelling
The endoparasitic nematode Meloidogyne incognita (Kofoid & White, Chitwood) obtained from mass cultures on tomato plants was used for the experiment. Two weeks after sowing second-stage juveniles were added in 5 mL tap water to the soil surface of each pot close to the barley stems. Treatments were without (control) and with 2000, 4000, and 8000 nematodes per pot and harvest was performed 2, 3, and 4 weeks after nematode inoculation (ANI) with five replicates per treatment and harvest, respectively. Pots were arranged in a randomized block design with a block consisting of one treatment each and pots were moved by four in the same direction every day.
At 19 days ANI (33 days after sowing), 13CO2 pulse-labelling was carried out using a closed-top chamber (1.6 m × 0.8 m × 0.6 m, volume 768 L) comprised of clear polyvinyl chloride (PVC) and Perspex panes to allow sufficient light transmission. The soil surface of the pots was gas tight sealed with PVC lids and polysilexane paste (Optosil® Plus, Heraeus Kulzer, Dormagen, Germany) around the barley stems. Five replicates of each nematode treatment were labelled for 4 h (start at 7.00 a.m.). This set of 13C-marked pots was harvested 3 days after labelling, together with the unlabelled control set at week 3 ANI.
For pulse-labelling, the lid was fitted onto the chamber and the rabbet between both parts was flushed with water to obtain a gas-tight seal. One side pane of the chamber included an inlet and outlet port for air, and ventilators permanently distributed the air inflow. The CO2 from the air in the chamber was successively removed and replaced with 13CO2. To achieve this, the chamber air was pumped for 1 h through a glass bottle filled with 1 M NaOH and 1 M BaCl2 (1 : 1) to precipitate CO2 as BaCO3. Afterwards, 3 g Na213CO3 (99.1% labelled) was mixed with 20 mL 5 M HCl inside the chamber to gain 13CO2. The devices used were handled from outside, i.e. without removing the lid. At the end of the labelling period, pots were immediately removed from the chamber and treated further similar to unlabelled pots.
Plants: biomass, carbon and nitrogen, root length, root-knots
After harvest, plants were divided into shoots and roots. Roots were separated from the soil by washing over a 0.5 mm screen. The biomass of the shoot and the roots was assessed as dry weight (2 days at 60 °C). Dried plant material was ground (ball mill, Retsch Type MM2, Haan, Germany) and 2 mg (five replicates per treatment and harvest) were each weighed into tin capsules, and the total plant carbon and nitrogen was determined by an element analyser (NA 1500, Carlo Erba, Milan). For nitrogen, atmospheric nitrogen served as the primary standard, and acetanilide (C8H9NO, Merck, Darmstadt) was used for internal calibration.
Aliquots of fresh root samples were fixed in 4% formaldehyde solution. Root samples (five replicates per treatment and harvest) were cut into 5 cm long segments and were randomly placed on a tray with grid lines to determine root length according to the gridline intersect method after Giovannetti & Moose (1980). At the end of the experiment, the number of root-knots induced by M. incognita was assessed. Roots (five replicates per treatment) were stained with aniline-blue (Byrd et al., 1983) and examined under a stereo microscope for nematode infection. Afterwards roots were oven dried (2 days at 60 °C).
Soil: total carbon (Ct), total nitrogen (Nt), 13C/12C ratio
Rhizosphere soil was collected close to the root system of plants and adhering fine roots were removed by the use of forceps. Soil samples were frozen at −20 °C until analysis. Aliquots were dried and ground (ball mill, Retsch Type MM2, Haan, Germany). Ct and Nt at 2 and 4 weeks ANI (five replicates per treatment and harvest) were determined with a C/N analyser (Leco C/N 2000, Leco Corporation, St Joseph). Standard soil was used as a reference every 10th sample.
The labelled and unlabelled soil samples harvested 3 weeks ANI were analysed by a coupled system of an Isotope Ratio Mass Spectrometer (IRMS, DeltaXP Plus, Thermo Finnigan, Walthman) and an element analyser (EA, Euro EA 3000, Euro Vector, Milan, Italy). This allows the determination of the carbon and nitrogen concentrations as well as the 13C/12C ratio. About 14 mg of soil (five replicates per treatment) was weighed into tin capsules. Stable isotope abundance is expressed using the δ notation with δ13C [‰]=(Rsample–Rstandard)/Rstandard× 1000. Acetanilide (C8H9NO, Merck, Darmstadt) was used for internal calibration and Peedee belemnite marine limestone (PDB) as the standard.
Microbial biomass carbon
The amount of microbial biomass carbon (Cmic) was assessed using the fumigation–extraction method (CFE) according to Vance et al (1987). Four subsamples of 3 g WW each were analysed (five replicates per treatment and harvest). Two subsamples were fumigated with chloroform for 24 h to release the microbial biomass carbon. Afterwards, the fumigated and the corresponding two unfumigated subsamples were dispersed in 12 mL 0.025 M K2SO4, extracted for 30 min, and soil separated by centrifugation (4070 g, 30 min). The concentrations of extractable total carbon (TC), total inorganic carbon (TIC), and Nt in the supernatants were measured on a Dimatoc 100 TOC/TN-analyser (Dimatec, Essen, Germany). The microbial carbon content was estimated as the difference in the organic carbon content of the extracts of the unfumigated and the fumigated soil samples. To convert the amounts of microbial carbon released by chloroform fumigation and extraction to total microbial biomass carbon extractability for carbon of 0.45 was assumed (Jörgensen, 1995).
The extracts obtained from the harvest 3 weeks ANI (13C-labelled and unlabelled samples) were dried (60 °C, 10 h) with a rotation vacuum evaporator (Christ, Type RVC 2–25, Osterode, Germany). The 13C/12C ratios were determined with IRMS according to the procedure given above.
Phospholipid fatty acids (PLFAs)
PLFAs from 2 g of soil (WW, five replicates per treatment and harvest) were extracted using the procedure described by Frostegård et al (1993). Briefly, Bligh and Dyer (chloroform, methanol, citrate buffer (pH 4); 1:2:0.8) was used as an extraction solvent. Lipid fractionation was performed with silica acid columns (0.5 g silicic acid, 3 mL; Varian Medical Systems, Palo Alto, CA) and lipids were eluted with chloroform (NLFAs), acetone (glycolipids), and methanol (PLFAs). Methanolysis of PLFAs was conducted with 0.2 M methanolic KOH. As an internal standard methylnondecanoate (19:0) was used to perform quantitative analyses. The fatty acid methyl esters (FAMEs) were maintained at −20 °C until analysis with isooctane as a solvent.
FAMEs were identified by chromatographic retention time comparison with a standard mixture composed of 37 different FAMEs that ranged from C11 to C24 (Sigma-Aldrich, St Louis). Analysis was performed by GC using an Auto System XL (Perkin Elmer Corporation, Norwalk) equipped with an HP-5 capillary column (50 m × 0.2 mm i.d., film thickness 0.33 μm). The temperature programme started with 70 °C (hold time 2 min) and increased with 30 °C min−1 to 160 °C, and then with 3 °C min−1 to 280 °C and was held for 15 min. The injection temperature was 260 °C and helium was used as a carrier gas.
To verify correct identification of FAMEs (chain length and saturation) a range of soil samples were analysed by GC-MS using a 3400/Saturn4 Diontrap GC/MS system (Varian, Darmstadt, Germany), equipped with an HP-5 capillary column (50 m × 0.32 mm i.d., film thickness 0.17 μm) with helium 5.0 as a carrier gas at a constant pressure of 22.5 psi. The split/splitless injector was operated in the splitless mode for 2 min and maintained at 300 °C. The GC oven temperature programme started at temperature of 50 °C (hold time 2 min), increased with 5 °C min−1 to 300 °C, and was held for 8 min. The transfer line temperature was 300 °C. At a filament emission current of 80 μA, a mass range of 50–500 m/z was monitored twice a second in the Scan mode.
The following PLFAs were summed up to estimate bacterial biomass: i15:0, a15:0, i16:0, 16:1ω7, i17:0, cy17:0, 18:1ω7, cy19:0 (Frostegård et al., 1993; Zelles, 1999). The PLFAs i15:0, a15:0, i16:0, and i17:0 are predominantly found in Gram-positive, and cy17:0 and cy19:0 in Gram-negative bacteria. The PLFAs 18:1ω9 and 18:2ω6,9 were used as marker for fungal biomass (Frostegård & Bååth, 1996).
Statistical analysis
Homogeneity of variance in the datasets was tested with Levene's test before further statistical handling. Data were analysed using anova and the means were compared by Tukey's HSD test. For two-way anova, least square means were used in the effect test. Multivariate fitting was performed by manova with means as the response design, and significances are given according to Pillai's Trace test. Statistical analyses were performed using jmp 3.1 for Macintosh (SAS Institute Inc., Cary, NC). Discriminant function analysis (DFA) was carried out with statistica 6.0 for Windows (StatSoft Inc., Tusla). PLFAs were used as variables for discrimination and nematodes/time as groups. The canonical scores for the first and second root were correlated with the PLFAs and the Pearson correlation coefficients are given.
Results
Development of barley plants
The shoot and root biomass of barley plants increased throughout the course of the experiment. On average, shoot biomass made up 0.56, 1.35, and 2.42 g DW, and root biomass 0.21, 0.40, and 0.47 g DW, at 2, 3, and 4 weeks ANI, respectively (Table 1). The development of shoots was generally not affected by the presence of nematodes. Root biomass was enhanced in the treatments containing M. incognita at 3 weeks ANI, which was significant for control plants compared with treatments with 8000 nematodes added (anova, F3,14=3.43, P=0.0465). The length of the barley roots varied only slightly between treatments, with overall means of 0.64, 0.55, and 0.54 km g−1 DW at 2, 3, and 4 weeks ANI (Table 1). Root length showed a tendency to decrease with time (anova, F2,55=2.76, P=0.0723), most apparent in plants inoculated with nematodes.
Shoot and root biomass (g DW ± SD), and root length (km g−1 root DW ± SD) of barley plants without (control) or inoculated with 2000, 4000, and 8000 Meloidogyne incognita after 2, 3, and 4 weeks
| Week | Control | Nematodes | |||
| 2000 | 4000 | 8000 | |||
| Shoot biomass (g DW) | 2 | 0.57 ± 0.04 | 0.51 ± 0.14 | 0.61 ± 0.12 | 0.55 ± 0.17 |
| 3 | 1.26 ± 0.12 | 1.34 ± 0.11 | 1.35 ± 0.13 | 1.44 ± 0.09 | |
| 4 | 2.40 ± 0.25 | 2.36 ± 0.35 | 2.54 ± 0.27 | 2.36 ± 0.32 | |
| Root biomass (g DW) | 2 | 0.18 ± 0.09 | 0.22 ± 0.08 | 0.29 ± 0.16 | 0.15 ± 0.09 |
| 3 | 0.32 ± 0.05b | 0.40 ± 0.07ab | 0.39 ± 0.11ab | 0.48 ± 0.05a | |
| 4 | 0.46 ± 0.13 | 0.50 ± 0.09 | 0.47 ± 0.11 | 0.45 ± 0.08 | |
| Root length (km g−1 DW) | 2 | 0.48 ± 0.07 | 0.69 ± 0.23 | 0.67 ± 0.15 | 0.70 ± 0.28 |
| 3 | 0.58 ± 0.20 | 0.53 ± 0.19 | 0.62 ± 0.17 | 0.48 ± 0.07 | |
| 4 | 0.54 ± 0.08 | 0.55 ± 0.07 | 0.51 ± 0.12 | 0.55 ± 0.07 | |
Mean within rows with the same or no letters are not significantly different according to Tukey's HSD (P<0.05).
Infection of barley plants by M. incognita was visible by the development of root-knots. Application of 2000, 4000, and 8000 nematodes resulted in 70±51, 106±48, and 118±61 root-knots per pot, respectively, assessed at 4 weeks ANI. This corresponds to 149±122, 234±118, and 270±167 root-knots g−1 DW root in the treatments 2000, 4000, and 8000 nematodes, respectively. No root-knots were detected in control plants.
Carbon and nitrogen concentrations in plants and soil
Plant growth during the experimental period resulted in an increase in carbon concentration (carbon in %) in shoots and roots with time. Shoot carbon ranged between 36.2% and 38.9%, and was significantly affected by nematodes (Table 2). At 2 weeks ANI, barley plants inoculated with 2000 M. incognita had the highest, and with 8000 M. incognita the lowest, carbon concentration. One week later, all nematode treatments resulted in an increase in carbon in shoots compared with control plants. Root carbon varied between 30.5% and 34.7% and was generally not influenced by the presence of nematodes (Table 2). However, a similar trend as in shoots was observed at week 2 ANI. With time the nitrogen concentration (Nt in %) decreased in barley plants (data not presented). The overall means were 6.0%, 4.9%, and 3.6% in shoots, and 3.7%, 3.5%, and 3.1% in roots at 2, 3, and 4 weeks ANI, respectively. The C : N ratio ranged from 6.1% to 11.0%. No effects of nematodes were observed.
Carbon concentration (%± SD) in the shoot and roots of barley plants, total soil carbon (Ct in %± SD) and microbial carbon (Cmic in μg g−1 DW ± SD) of pots without (control) or inoculated with 2000, 4000, and 8000 Meloidogyne incognita after 2, 3, and 4 weeks
| Week | Control | Nematodes | |||
| 2000 | 4000 | 8000 | |||
| Shoot carbon (%) | 2 | 36.2 ± 0.3ab | 37.0 ± 1.0a | 36.2 ± 0.6ab | 35.2 ± 0.6b |
| 3 | 36.7 ± 0.1b | 38.1 ± 0.7a | 38.6 ± 0.4a | 38.0 ± 0.9a | |
| 4 | 38.6 ± 0.5 | 38.9 ± 0.5 | 38.8 ± 0.7 | 38.4 ± 0.8 | |
| Root carbon (%) | 2 | 32.0 ± 2.1 | 34.5 ± 3.0 | 33.3 ± 1.1 | 31.2 ± 2.0 |
| 3 | 31.7 ± 1.9 | 30.5 ± 4.1 | 32.6 ± 3.0 | 33.0 ± 4.7 | |
| 4 | 34.7 ± 1.2 | 33.6 ± 1.7 | 32.2 ± 3.0 | 33.0 ± 1.8 | |
| Soil Ct (%) | 2 | 1.80 ± 0.04a | 1.75 ± 0.02b | 1.79 ± 0.02ab | 1.78 ± 0.02ab |
| 3 | 1.72 ± 0.02 | 1.72 ± 0.05 | 1.73 ± 0.02 | 1.71 ± 0.05 | |
| 4 | 1.77 ± 0.01 | 1.78 ± 0.01 | 1.78 ± 0.02 | 1.79 ± 0.02 | |
| Cmic (μg g−1 DW) | 2 | 72.8 ± 14.1 | 67.2 ± 9.5 | 67.2 ± 6.8 | 63.1 ± 8.5 |
| 3 | 62.5 ± 8.5 | 61.0 ± 11.4 | 66.2 ± 4.2 | 74.3 ± 9.8 | |
| 4 | 68.0 ± 15.9 | 67.5 ± 11.2 | 79.4 ± 4.2 | 77.9 ± 9.3 | |
Mean within rows with the same or no letters are not significantly different according to Tukey's HSD (P<0.05).
In the rhizosphere soil, the Ct and Nt concentration, as well as the C : N ratio, remained relatively unchanged during the experimental period. Ct ranged between 1.71% and 1.80% and was higher in the control compared with the treatment with 2000 nematodes at 2 weeks ANI (Tukey's HSD, Table 2). Soil Nt had amounts of 0.13–0.15%, and C : N ratios varied between 11.9 and 14.1 (data not presented). No changes due to the application of M. incognita were observed for Nt and C : N in the rhizosphere soil.
Carbon allocation in the rhizosphere soil
The allocation of plant-derived carbon into rhizosphere soil and microorganisms was assessed by 13CO2 pulse-labelling at day 19 ANI, i.e. 33 days after the sowing of barley. At the start of the experiment the δ13C of the soil was −25‰. In comparison with this, barley plants were slightly depleted with a δ13C between −30‰ (shoots) and −27‰ (roots). Pulse-labelling of barley resulted in a strong enrichment in the heavier isotope with 13C/12C ratios of 1390‰ (shoots) and 1319‰ (roots) 3 days after labelling (i.e. 3 weeks ANI). At the same time, the 13C signal was also detected in the soil carbon pool (Fig. 1). With increasing nematode density, the δ13Ct in the rhizosphere soil of pots kept under an ambient atmosphere was slightly depleted, whereas under labelling conditions it was enriched to some extent (two-way anova, whole model F7,31=2.16; P=0.0673; labelling P=0.0435; nematodes P=0.6931; labelling × nematodes P=0.0373).
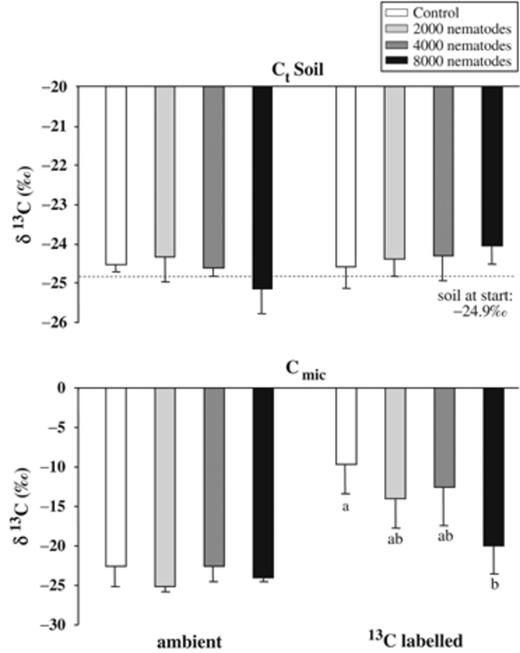
δ13C values (‰±SD) of soil carbon (Ct) and microbial biomass (Cmic) in pots with barley plants kept at ambient conditions or labelled with 13C. Pulse-labelling took place 19 days after inoculation of 0 (control), 2000, 4000, and 8000 Meloidogyne incognita and soil was harvested after a chase period of 3 days. Means with the same or no letters are not significantly different from Tukey's HSD (P<0.05).
Microbial biomass carbon (Cmic) ranged between 61.0 and 79.4 μg g−1 DW soil and was not affected by the inoculation of nematodes (Table 2). In contrast, the presence of M. incognita had a distinct impact on the 13C/12C ratio in microorganisms. After pulse-labelling, δ13Cmic was strongly enriched with decreasing nematode inoculation density (Tukey's HSD, Fig. 1). In labelled control pots, the δ13C signal was most apparent with enrichment in 13C of 12.8‰ compared with control pots kept under ambient air. In the presence of nematodes, less labelled carbon was incorporated into microbial biomass, particularly in the treatment with 8000 M. incognita, where δ13Cmic was −24.0‰ and −20‰ in ambient and labelled pots, respectively. Two-way anova (whole model: F7, 27=15.95, P<0.0001) revealed significant effects of labelling (P<0.0001), nematodes (P=0.0038), and the interaction between labelling x nematodes (P=0.0339).
Microbial community
The total amount of PLFAs in soil ranged between 11.1 and 18.5 nmol g−1 DW, with the lowest values at week 3 ANI (Fig. 2). Application of nematodes led to a decline in PLFAs in the treatments 4000 and 8000 compared with control and 2000 nematodes in week 2 ANI, (anova, F3, 16=12.44, P=0.0002). One week later, the pots inoculated with 2000 M. incognita had the highest amounts in PLFAs compared with all others (anova, F3, 15=9.10, P=0.0011). At 4 weeks ANI, no differences between treatments occurred. The pattern of bacterial PLFAs mirrored the pattern of total PLFAs (Fig. 2). Two weeks ANI, the control and treatment 2000 nematodes had the highest amount (anova, F3, 16=15.28, P<0.0001), whereas at 3 weeks ANI the pots with application of 2000 individuals showed the greatest value (anova, F3, 15=4.43, P=0.0203).
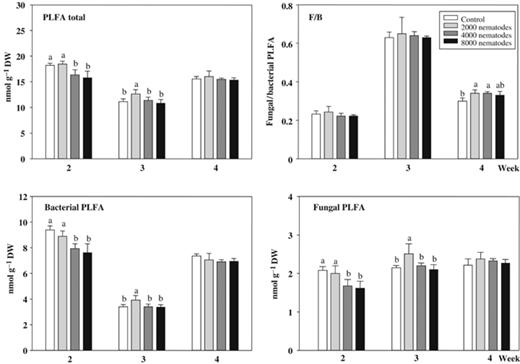
PLFAs (nmol g−1 DW soil±SD) in the rhizosphere soil of barley plants without (control) or inoculated with 2000, 4000, and 8000 Meloidogyne incognita after 2, 3, and 4 weeks. The total, bacterial and fungal PLFAs, and the fungal to bacterial ratio (F/B) are presented. Means within treatments of each week with the same or no letters are not significantly different according to Tukey's HSD (P<0.05).
The amount of fungal PLFAs, was generally low, with 1.6–2.5 nmol g−1 DW soil. In contrast to total and bacterial PLFAs no decrease was observed 3 weeks ANI (Fig. 2). Application of nematodes resulted in a pattern corresponding to total and bacterial PLFAs, i.e. the control and treatment 2000, with the highest values at 2 weeks, and 2000 at 3 weeks ANI (anova, 2 weeks: F3, 16=9.52, P=0.0008; 3 weeks: F3, 15=6.66, P=0.0045). On average, the ratio of fungal to bacterial PLFAs (F/B) ranged between 0.22, 0.64, and 0.33 at 2, 3, and 4 weeks ANI, respectively (Fig. 2). The effects of nematodes were detected 4 weeks ANI with an increase in F/B in pots with initial densities of 2000 and 4000 M. incognita compared with controls (anova, F3, 16=6.03, P=0.006).
In total, 19 different PLFAs were detected in the soil, with a chain length between 14 and 24 carbon atoms (Table 3). The PLFA pattern was strongly affected by sampling date (i.e. weeks ANI) and by nematode inoculation density. manova revealed differences in PLFA pattern due to time, nematodes, and interactions between time and nematodes (whole model: F126, 140=3.09, P<0.0001; time: F14, 18=269.36, P<0.0001; nematodes. F48, 54=5.41, P<0.0001; time × nematodes: F48, 54=2.93, P<0.0001). At week, 2 and 3 ANI, most PLFAs characteristic for bacteria (i.e. methyl-branched and cyclic forms) as well as for fungi (18:1ω9, 18:2ω6,9) responded to the presence of M. incognita (Table 3). The amount of bacterial and fungal PLFAs decreased in treatments with 4000 and 8000 nematodes at week 2 ANI compared with control and treatment 2000. One week later, pots inoculated with 2000 M. incognita had the highest values, but fewer PLFAs were affected in both bacterial and fungal markers. Further, the long-chain, saturated fatty acids 20:0 and 22:0 significantly increased in treatment 2000. Generally, no differences between the response of Gram-positive (i.e. iso, anteiso PLFAs) and Gram-negative (cyclo PLFAs) bacteria were observed at 2 and 3 weeks ANI. At the end of the experiment, the effects of nematodes diminished and were only apparent in 16:1ω7, i16:0, and i17:0, with the latter two PLFAs characteristic for Gram-positive bacteria.
Phospholipid fatty acids (nmol g−1 DW soil ± SD) in the rhizosphere soil of barley plants without (control) or inoculated with 2000, 4000, and 8000 Meloidogyne incognita after 2, 3, and 4 weeks
| Nematodes | Week | |||||||||||
| 2 | 3 | 4 | ||||||||||
| Control | 2000 | 4000 | 8000 | Control | 2000 | 4000 | 8000 | Control | 2000 | 4000 | 8000 | |
| 14:0 | 0.38ab | 0.42a | 0.35b | 0.34b | ND | ND | ND | ND | 0.28 | 0.30 | 0.30 | 0.28 |
| 15:0 | 0.26a | 0.25ab | 0.19b | 0.21ab | ND | ND | ND | ND | 0.16 | 0.20 | 0.16 | 0.20 |
| i15:0 | 2.31ab | 2.38a | 2.10ab | 2.04b | 0.35 | 0.45 | 0.37 | 0.34 | 1.77 | 1.92 | 1.85 | 1.77 |
| a15:0 | 1.43 | 0.85 | 0.57 | 0.46 | 0.21 | 0.35 | 0.13 | 0.24 | 1.09 | 0.27 | 0.36 | 0.56 |
| 16:0 | 3.79a | 3.83a | 3.39b | 3.25b | 2.16b | 2.53a | 2.23b | 2.15b | 3.21 | 3.56 | 3.37 | 3.29 |
| i16:0 | 0.93a | 0.93a | 0.87ab | 0.83b | 0.37ab | 0.42a | 0.38ab | 0.36b | 0.70b | 0.77a | 0.74ab | 0.71ab |
| 16:1ω5 | 0.75a | 0.75a | 0.69ab | 0.66b | 0.32b | 0.36a | 0.33ab | 0.31b | 0.59 | 0.67 | 0.63 | 0.61 |
| 16:1ω7 | 1.62a | 1.62a | 1.45b | 1.40b | 0.61 | 0.71 | 0.63 | 0.60 | 1.33b | 1.46a | 1.38ab | 1.35ab |
| 17:0 | 0.13ab | 0.14ab | 0.11b | 0.14a | 0.19 | 0.17 | 0.17 | 0.15 | 0.18 | 0.20 | 0.20 | 0.21 |
| i17:0 | 0.64a | 0.64a | 0.60ab | 0.58b | 0.41b | 0.44a | 0.41b | 0.42b | 0.49b | 0.55a | 0.52ab | 0.51ab |
| cy17:0 | 0.60ab | 0.63a | 0.57b | 0.57ab | 0.33b | 0.38a | 0.34b | 0.33b | 0.46 | 0.46 | 0.45 | 0.48 |
| 18:0 | 0.73 | 0.76 | 0.68 | 0.68 | 0.83b | 0.93a | 0.85b | 0.82b | 0.78 | 0.84 | 0.80 | 0.78 |
| 18:1ω7 | 1.73 | 1.70 | 1.68 | 1.60 | 1.37b | 1.53a | 1.41b | 1.35b | 1.44 | 1.58 | 1.52 | 1.46 |
| 18:1ω9 | 1.76a | 1.73a | 1.49b | 1.42b | 1.79b | 2.07a | 1.84b | 1.79b | 1.81 | 1.96 | 1.89 | 1.85 |
| 18:2ω6,9 | 0.32a | 0.27ab | 0.19b | 0.19b | 0.36 | 0.45 | 0.36 | 0.31 | 0.41 | 0.42 | 0.44 | 0.42 |
| cy19:0 | 0.13 | 0.14 | 0.13 | 0.14 | 0.11 | 0.12 | 0.11 | 0.10 | 0.10 | 0.09 | 0.11 | 0.10 |
| 20:0 | 0.18 | 0.20 | 0.19 | 0.19 | 0.31b | 0.33a | 0.31b | 0.29b | 0.27 | 0.26 | 0.27 | 0.26 |
| 22:0 | 0.26 | 0.26 | 0.27 | 0.27 | 0.36b | 0.39a | 0.36b | 0.35b | 0.30 | 0.32 | 0.31 | 0.31 |
| 24:0 | 0.27 | 0.28 | 0.29 | 0.29 | 0.27 | 0.29 | 0.27 | 0.20 | 0.22 | 0.24 | 0.23 | 0.23 |
Mean within rows of each week with the same or no letters are not significantly different according to Tukey's HSD (P<0.05).
A DFA of the PLFA patterns, with time x nematode density as groups in the model, distinctly separated the different weeks ANI from each other (Fig. 3). The first two axes were significant, with an Eigen value of 354 and 38 for roots 1 and root 2, respectively (P<0.0001). At week 2 ANI significant differences were indicated for all nematode treatments compared with the control (P<0.002). Moreover, the PLFA pattern of the control differed from treatment 2000 at week 3, and from 2000 and 4000 at week 4 ANI (P<0.02). Bacterial PLFAs were positively correlated with root one, whereas the two fungal and most saturated, straight-chain PLFAs showed a negative correlation (Table 4). This accounted largely for the separation along the first axis, i.e. between the times of incubation after application of nematodes. The fungal PLFAs and the saturated forms 17:0 and 24:0 contributed considerably to the discrimination along the second axis, which distinguished nematode treatments within a respective week.
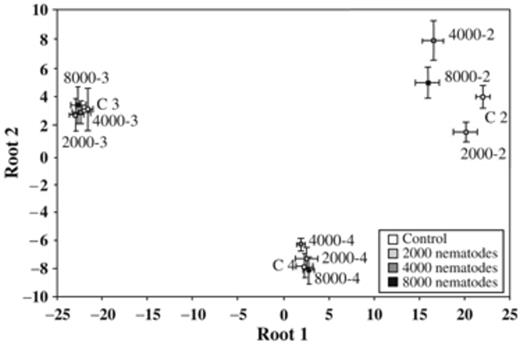
Discriminant functional analysis (DFA) of PLFAs obtained from the rhizosphere soil of barley plants without (control) or inoculated with 2000, 4000, and 8000 Meloidogyne incognita after 2, 3, and 4 weeks. In the model, PLFAs represent the variables (n=17) and time × nematode density (n=12) represents the groups. The scatter plot shows group centroids±SD for roots 1 and 2.
Correlations of PLFAs (variables in model, n=17) with the extracted axes by discriminant functional analysis (DFA) with time × nematode density (n=12) as groups
| Root 1 | Root 2 | |
| i15:0 | 0.9666*** | −0.2054 |
| a15:0 | 0.6343*** | −0.0274 |
| 16:0 | 0.9021*** | −0.2601* |
| i16:0 | 0.9748*** | −0.0965 |
| 16:1ω5 | 0.9581*** | −0.1711 |
| 16:1ω7 | 0.9468*** | −0.2504 |
| 17:0 | −0.4310** | −0.7277*** |
| i17:0 | 0.9303*** | 0.1054 |
| cy17:0 | 0.9183*** | 0.0753 |
| 18:0 | −0.7227*** | −0.2262 |
| 18:1ω7 | 0.7294*** | 0.2342 |
| 18:1ω9 | −0.4884*** | −0.4751*** |
| 18:2ω6,9 | −0.4351*** | −0.6374*** |
| cy19:0 | 0.4675*** | 0.3988** |
| 20:0 | −0.9165*** | −0.2258 |
| 22:0 | −0.9256*** | −0.0470 |
| 24:0 | 0.1111 | 0.4883*** |
The canonical scores for the first and second root are used for correlation and the Pearson correlation coefficients are given. Significant correlations are indicated by *, **, *** with P<0.05, 0.01, 0.001.
Discussion
Plant performance
The parasitism of plants by the nematode Meloidogyne spp. typically results in the formation of root-knots, due to cell hypertrophy and hyperplasia triggered by nematode feeding (Cohn et al., 2002; Davis et al., 2004). In the present study, the infection of barley plants with M. incognita was evident with up to 270 root-knots g−1 DW root developed 4 weeks ANI. Further belowground symptoms of diseased plants include excessive root branching, cessation of root elongation, and retardation of root growth. Aboveground damage may result in discoloration of foliage, twisted leaves, and distorted shoots (Manzanilla-López et al., 2004). However, the establishment of M. incognita on barley as the host did not cause any of these deleterious effects, nor were shoot or root growth negatively affected. This indicates that the utilized nematode inoculation rates were well below the threshold level for plant damage. Thus, the experiment performed evaluates the mechanisms of low-level root herbivory on plant–microbial interactions.
Regardless of the low infestation rates, M. incognita led to changes in plant performance. In pots inoculated with 8000 individuals, root biomass increased 3 weeks ANI. The presence of nematodes induced a higher carbon content in shoots 2 and 3 weeks ANI, and a comparable, but insignificant, trend in roots. Apparently, low-level root herbivory by M. incognita altered carbon partitioning and enhanced root development in the host plant to some extent. The belowground increase in plant carbon may be due to the direct carbon demand by nematodes. The feeding sites developed within root tissue act as a strong metabolic sink that funnels plant resources to the parasite (Williamson & Gleason, 2003; Hammes et al., 2005). On the other hand, it is well known that aboveground foliar herbivory affects plant carbon allocation as well as root biomass (Bardgett et al., 1998; Hamilton & Frank, 2001). Grazing can induce ‘compensatory growth’ measured in terms of productivity and leaf nutrient content. Similarly, root herbivores affect the quality and quantity of plant tissues above- and belowground (Brown & Gange, 1990; Van der Putten et al., 2001). Comparable physiological responses of the plant host to low infestation rates by endoparasitic nematodes are indicated by the present investigation.
Microbial biomass carbon in the rhizosphere
Plant roots secrete mucilage, organic acids, sugars, and amino acids into the environment, and often more carbon enters the soil by this route than present in roots at the end of a growing season (Whipps, 1990). This release of organic compounds is a key process influencing nutrient availability in the rhizosphere (Grayston et al., 1997). Recent studies report that low amounts of root herbivory by nematodes can increase the allocation of photoassimilate carbon to roots, leading to enhanced root exudation and microbial biomass in the rhizosphere (Yeates et al., 1998, 1999a; Denton et al., 1999). In the experiment performed, microbial biomass (Cmic) was not altered by the presence of nematodes during the 4-week observation period. The leakage of carbon and other nutrients from the root mass likely occurred when nematodes penetrated their host. Enhanced rhizodeposition was indicated by Haase et al (2007) for sugars, amino acids and organic acids (fumarate) at the apical root zones of barley infected by M. incognita 1 week ANI. Using the same nematode–plant model system, the present study does not indicate related long-term effects on microbial biomass. This is in line with Yeates et al (1999b) investigating five different endo- and ectoparasitic nematode species (sedentary, migratory) with white clover as the host. On the other hand, Tu et al (2003) reported reduced microbial biomass carbon with the ectoparasitic Rotylenchus reniformis on cotton. Generally, the studies revealing proliferation of microorganisms utilized the sedentary clover-cyst nematode Heterodera trifolii (Yeates et al., 1998, 1999a; Denton et al., 1999). This type of root herbivory is characterized by a pronounced damage of root tissue as cyst nematodes migrate intracellularly by rupturing cell walls (Cohn et al., 2002; Williamson & Gleason, 2003). On the other hand, the root-knot nematodes in the present study move intercellular and nondestructively by separating cells at the middle lamella. In conclusion, each type of plant–nematode association has differing implications for carbon allocation in the rhizosphere, and thus for the impact of nematode herbivory on soil microbial biomass. The diverse parasitic strategies within the group of root feeders therefore make it difficult to assign a general picture for these belowground trophic interactions.
Belowground allocation of plant carbon
The infection of barley by M. incognita significantly affected the allocation of plant-derived carbon to rhizosphere microorganisms (13Cmic). Three days after 13CO2 pulse-labelling, the 13C signal was most prominent in the microbial biomass of control soils, but decreased with increasing nematode inoculation density. Thus, in the presence of nematodes microorganisms sequestered less plant carbon. Generally, the rates of maximum incorporation of 13C pulses into the microbial biomass range from several hours to 3 days, after pulsing with a strong exponential decrease in 13C with time (Lu et al., 2002; Leake et al., 2006). With a chase period of 3 days the observed 13C sequestration by microorganisms therefore represents the flux of recently photoassimilated carbon. That, at a similar height of microbial biomass, less plant carbon was fixed could be related to a faster turnover rate (i.e. higher metabolic activity) of microorganisms in the presence of nematodes. Soil respiration is the main fate of most of the recent photosynthate directed into soil by plant roots. Considerable quantities of 13C may have been respired by microorganisms and therefore were not incorporated into the biomass. Additionally, part of the plant carbon likely was translocated to nematode feeding sites, as galled root tissue was found to show marked increases in organic acids, free amino acids, proteins, lipids, minerals, and sugars (Wang & Bergeson, 1974; Van Gundy et al., 1977). These plant resources sequestered by nematodes were not available to rhizosphere microbial communities.
In contrast to the present results Yeates et al (1999b) observed an increase in 14C in the microbial biomass in the rhizosphere of nematode-infected white clover after 14C pulse labelling. This discrepancy in mechanisms in belowground carbon allocation is likely related to the specific host plants and time scales investigated. Plant roots create a selective environment for microbial populations, and legumes (e.g. clover) inhabit different bacterial communities than plants without a Rhizobium symbiosis (e.g. barley) (Marilley et al., 1998). Rhizosphere bacterial communities also vary over time, reflecting qualitative and quantitative differences in root exudation (Morgan et al., 2005). Accordingly, the amount of photosynthate incorporated into the microbial biomass pool depends on plant age, with higher turnover rates of 13Cmic in younger compared with older individuals (Butler et al., 2004). Yeates et al (1999b) pulsed clover 59 days after planting, whereas the barley in the present study was 33 days old, and had not yet reached maturity. The differences in the physiological status of the host plant therefore are an important factor for carbon sequestration by rhizosphere microorganisms.
In sum, the results obtained imply a marked demand for carbon by nematodes even at low levels of root infection. This metabolic sink likely directs plant resources predominantly to nematodes and not to rhizosphere microorganisms. However, along with nematode infection more plant carbon entered the detrital pool, presumably due to enhanced rhizodeposition. This was visible in the rhizosphere soil (13Ct) compartment by a slight enrichment in 13C in the treatment with 8000 M. incognita 3 days after pulse-labelling. The quantities of pulse-derived 13C allocated to the bulk soil carbon pool may be considerable, but are masked by the huge amount of unlabelled Ct (Leake et al., 2006). Nevertheless, microbial communities in the rhizosphere of nematode-infected plants less effectively fixed these recent photoassimilates. At a stage where plant parasites have established feeding sites in the host tissue, low-level root herbivory apparently does not support microbial communities via this carbon pathway.
Microbial community structure
Microbial biomass is generally considered to be a single entity, whereas analysis of PLFAs can be used to monitor changes in the structure of the microbial community actively involved in soil nutrient cycling (Lu et al., 2004; Ramsey et al., 2006). In comparison with controls, the amounts of total, bacterial, and fungal PLFAs were unchanged with 2000, and reduced with 4000 and 8000 M. incognita added, at 2 weeks ANI. One week later, pots inoculated with 2000 nematodes showed the highest amounts of PLFAs. This suggests that only very low densities of root parasitic nematodes impose positive effects on rhizosphere microorganisms, whereas other infection rates, although below the threshold level for damage to the host plant, have a negative impact. The latter may be attributed to the increased number in root-knots developed at higher infection rates. The surface of root-knots displays a reduced exudation of sugar and amino acid, and almost no organic acid rhizodeposition (Haase et al., 2007). This local, but strong decline in plant resources may have affected the microorganisms in the surrounding rhizoplane. Overall, the interactions in the plant–nematode association are complex, with not just the induced leakage attributing to modifications in rhizosphere microbial communities.
Microbial community structure assessed by PLFA patterns was affected by both nematode infection and the time course of the experiment. The latter is likely due to the developmental stage of barley plants and related changes in the rhizosphere environment. In young plant roots, bacterial communities are dominated by r-strategists, and as roots mature, a shift in favour to K-strategists occurs (De Leij et al., 1993; Morgan et al., 2005). Nematode-induced changes in individual PLFAs generally resembled those observed for the total amounts of the two major groups: the bacteria and fungi. However, time effects were much more prominent, with the PLFA pattern strongly altered at 2 weeks ANI, and an intermediate response at 3 weeks ANI. At 4 weeks ANI, only 3 PLFAs were affected, of which the methyl-branched i16:0 and i17:0 are indicative for Gram-positive bacteria (Zelles, 1999). Besides nematode-mediated changes in root exudation, root morphology may play an important role in shaping microbial communities. Nematode infection is known to cause root-hair elongation induced by enhanced phytohormone levels in response to wounding (Pitts et al., 1998; Wubben et al., 2001, 2004). Corresponding morphological changes were observed in barley roots infected with M. incognita (Haase et al., 2007). In sum, the multiple direct (e.g. induction of leakage and root-knots) and indirect (e.g. altered root morphology and exudation) effects of nematodes on their host plant resulted in the distinct changes in the microbial community structure observed.
Conclusions
The possibility of a beneficial effect of low-level herbivory by plant parasitic nematodes on soil microbial communities is particularly tempting, considering their high abundance and diversity, and their traditional role as pests in soils. However, the present results do not sustain this hypothesis in general. Supporting evidence was found only at very low nematode infection rates. Such a positive influence likely is short-termed and strongly affected by the developmental stage of the nematode. After establishment of feeding sites, these act as an effective metabolic sink, and plant-derived carbon becomes less available for rhizosphere microorganisms. Moreover, the carbon flow into microbial biomass via leakage and rhizodeposition is dependent on the respective plant–nematode association. The scale of impact likely varies with the mode of feeding. Nevertheless, the results demonstrate that, at background levels, root herbivory by nematodes can have a profound influence on microbial community structure in the rhizosphere. This will affect soil metabolism and nutrient transfer, and hence aboveground plant performance and competition.
Acknowledgements
The authors wish to thank S. Rudolph (University of Hohenheim, Institute for Soil Science and Land Evaluation) for the help in laboratory analyses and Dr G. Neumann (University of Hohenheim, Institute of Plant Nutrition) for the use of greenhouse facilities. Dr I. Merbach (UFZ, Centre for Environmental Research, Leipzig-Halle, Bad Lauchstädt) is thanked for the supply with soil, and Prof. Vetter and Roland von der Recke (University of Hohenheim, Institute of Food Chemistry) for the opportunity to use the GC/MS system.
References
