


Abstract
Biological soil characteristics such as microbial biomass, community structures, activities, and functions may provide important information on environmental and anthropogenic influences on agricultural soils. Diagnostic tools and detailed statistical approaches need to be developed for a reliable evaluation of these parameters, in order to allow classification and quantification of the magnitude of such effects. The DOK long-term agricultural field experiment was initiated in 1978 in Switzerland for the evaluation of organic and conventional farming practices. It includes three representative Swiss farming systems with biodynamic, bio-organic and conventional fertilization and plant protection schemes along with minerally fertilized and unfertilized controls. Effects on microbial soil characteristics induced by the long-term management at two different stages in the crop rotation, i.e. winter wheat after potato or corn, were investigated by analyzing soil bacterial community structures using analysis of PCR-amplified rRNA genes by terminal restriction fragment length polymorphism and ribosomal intergenic spacer analysis. Application of farmyard manure consistently revealed the strongest influence on bacterial community structures and biomass contents. Effects of management and plant protection regimes occurred on an intermediate level, while the two stages in the crop rotation had a marginal influence that was not significant.
Introduction
Sustainable land use for the preservation and improvement of soil fertility is important for agriculturally managed ecosystems (Tilman, 1999; Doran & Zeiss, 2000). Factors influencing soil characteristics have mostly been determined based on chemical or physical parameters (Gerhardt, 1997; Eck & Stewart, 1998; Castillo & Joergensen, 2001; Izquierdo et al., 2003). However, transformation processes and nutrient cycles mediated by soil biota also influence soil quality, and therefore, biological soil characteristics such as microbial biomass, community structure, activity and function may also reflect the influences of different environmental or anthropogenic factors (Kennedy & Smith, 1995). Soil microbiota play an important role in nutrient turnover (Dighton, 1995; Kennedy, 1999). Therefore, it has been suggested that it is essential to analyze the effects of different factors on the bacterial community structures in agricultural soils (Kennedy & Smith, 1995; Pankhurst et al., 1996; Kennedy & Gewin, 1997; Kennedy, 1999). Because cultivation-dependent techniques access only a small proportion of the microbial community (Colwell & Grimes, 2000), molecular tools may allow for a more detailed assessment of changes in microbial community structures in soil, and thus may be of assistance for the determination and monitoring of soil quality (Hill et al., 2000; Kirk et al., 2004). PCR-based techniques such as denaturing gradient gel electrophoresis (DGGE), single strand conformation polymorphism (SSCP), terminal restriction fragment length polymorphism (T-RFLP), and ribosomal intergenic spacer analysis (RISA) have been frequently applied in analyses of soil microbial community structures (for a review see Kirk et al., 2004).
Microbial diversity in agricultural soils was found to be low when compared to pristine soils (Torsvik et al., 2002), but the specific factors responsible for these differences are not well understood. Many studies have shown that organic farming, which avoids the use of synthetic fertilizers and pesticides, may lead to increased soil biodiversity and biological activity in soils when compared to conventional farming (Mäder, 1995; Bossio et al., 1998; Carpenter-Boggs et al., 2000). Biodynamic farming, as a specific form of organic farming (Steiner, 1993), has also been reported to sustain better soil quality than conventional farming practices (Reganold et al., 1993). In addition to different farming systems, factors such as plant species (Grayston et al., 1998; Smalla et al., 2001; Marschner et al., 2004), soil type (Girvan et al., 2003) and tillage (Lupwayi et al., 1998) may also influence biological soil characteristics.
When investigating system-specific differences in agricultural soils it is important to consider changes that become apparent only after a long period of time (Temple et al., 1994; Poulton, 1996). In a long-term experiment at Rothamsted, UK, started in 1848, it has been demonstrated that effects on yield and ecological parameters can become apparent only after 40 years (Powlson & Johnston, 1994). However, at that time, tools for determining specific biological soil characteristics such as community structures were not available. The DOK long-term field experiment in Switzerland was established in 1978 and enables the investigation of effects of fertilization and plant protection strategies in agricultural systems on soil characteristics and crop yield (Mäder et al., 2002). The DOK experiment includes biodynamic (BIODYN), bio-organic (BIOORG) and (FYM) based conventional farm yard manure (CONFYM) farming systems along with mineral (CONMIN) and unfertilized (NOFERT) controls and a 7-year crop rotation that is running temporally shifted in three parallels. The effects of farming systems and crops in a defined rotation were thoroughly investigated assessing chemical, physical and biological soil characteristics as well as yield and energy balance (Alföldi et al., 1995; Mäder et al., 2000, 2002). Mean crop yields were 20% lower in the organic systems, i.e. BIODYN and BIOORG, when compared to the conventional CONFYM system, but reduced input of NPK fertilizer (34–51%), pesticides (97%), and energy (20–56%) revealed ecological advantages of organic farming (Mäder et al., 2002). In addition, increases in microbial activity, soil aggregate stability, microbial and earthworm biomass, root colonization by mycorrhiza, and number of arthropods represent some characteristics reported for the organic farming systems when compared to CONFYM (Mäder et al., 2002).
In this study, microbial soil characteristics were determined for a detailed assessment and ranking of effects of the different factors in the DOK system. Soil microbial biomass was determined in order to allow for the comparison of data to previous studies, and to validate the quality of soil DNA extraction. Extracted soil DNA was used to resolve bacterial community structures with two independent PCR-based ribosomal RNA gene operon profiling techniques, i.e. T-RFLP and RISA. Both techniques are compatible with semi-automated application and detailed statistical analyses, allowing one to test the robustness of the results obtained (Hartmann et al., 2005). In addition, T-RFLP and RISA target different genetic regions and therefore differ in their phylogenetic resolution, which has been reported to be approximately at the genus level for T-RFLP and at the species level for RISA (Fisher & Triplett, 1999; Dunbar et al., 2001).
Materials and methods
Experimental system and soil sampling
Analyses were performed on soil samples from the DOK long-term agricultural field experiment in Switzerland, which was started in 1978. The experiment is situated 300 m above sea level in a topographically leveled area on alluvial loess (haplic luvisol) that has been agriculturally cultivated for decades (Mäder et al., 2000). The mean precipitation in the area is 785 mm year−1 and the annual mean temperature is 9.5°C. For a detailed description of the experimental concept and characteristics, including data on energy efficiency, system productivity and different physical, chemical, and biological soil characteristics see previous publications (Alföldi et al., 1995; Mäder et al., 2000, 2002). Five different treatment types, i.e. BIODYN, BIOORG, CONFYM, CONMIN, and NOFERT (Table 1), were sampled from the split-split block field design with four replicates. Plots of 5 × 20 m have been arranged on an area of 1.4 ha. BIOORG has been maintained according to standard organic farming practice in Switzerland (Eidg.Volkswirtschaftsdepartement, 1997), while for BIODYN guidelines for biodynamic farming have been applied (Kirchmann, 1994). The conventional system CONFYM has been maintained according to Swiss standard recommendations (Eidg.Volkswirtschaftsdepartement, 1998). The same 7-year crop rotation has been used in all systems, i.e. potato, winter wheat 1, soy bean, corn and winter wheat 2, followed by 2 years of grass clover, and has been temporally shifted in three parallels. Therefore, the effects of different combinations of preceding and actual crop could be investigated. Soil preparation was identical for all systems.
Agricultural management regimes in the DOK long-term field experiment
Farm yard manure (FYM) application of 1.4 livestock units ha−1 year−1 (∼2000 kg organic carbon ha−1 year−1) was performed with aerobically composted FYM(BIODYN) (C/N=8), slightly aerobically rotted FYM(BIOORG) (C/N=11); anaerobically rotted FYM(CONFYM) (C/N=12). For details on the experiment refer to previous publications Mäder (2002, 2000).
Preparations 500 (horn manure) and 501 (horn silica) were applied (Steiner, 1993).
CuSO4 was used for plant protection in BIOORG potato until 1991.
Bulk soils were sampled in March 2003 before the first fertilizer application after winter. Samples of all four field replicates from all five treatments and from two different positions in the crop rotation, i.e. winter wheat 1 after potato (P-WW1) and winter wheat 2 after corn (C-WW2), were obtained. From each plot, 16 soil cores each with a diameter of 2.5 cm were taken to a depth of 20 cm, pooled and transported to the laboratory. Plant debris was removed and soils were sieved and immediately subjected to microbial biomass determination and DNA extraction.
Soil microbial biomass
To obtain a validated determination of soil microbial biomass, two techniques were applied. Chloroform fumigation extraction (CFE) was performed according to Vance (1987). Total soluble organic carbon of 20 g (dry weight equivalent) chloroform fumigated and control soil was extracted with 80 mL of 0.5 M K2SO4 and analyzed for extracted carbon by infrared spectrometry (DimaTOC, Dimatec, Essen, Germany). Soil microbial biomass Cmic-CFE (mg kg−1 soil) was determined using the conversion factor 0.45 (Martens, 1995).
Substrate-induced respiration (SIR) was performed according to Anderson & Domsch (1978). To 50 g (dry weight equivalent) of pre-equilibrated soil samples, 150 mg glucose was added, mixed, and the initial CO2 production response was measured with an infrared gas analyzer (IRGA) according to Heinemeyer (1989). Soil microbial biomass Cmic-SIR (mg kg−1 soil) was calculated from the initial respiration rates using the conversion factor 30 (Kaiser et al., 1992).
Extraction and quantification of DNA from soil
Nucleic acids were extracted from 0.5 g fresh soil according to the protocol of Bürgmann (2001) using a FastPrep bead beater (FP 120, Savant Instruments Inc., Holbrook, NY). Extracted DNA was quantified with PicoGreen® (Molecular Probes, Eugene, OR) on a luminescence spectrometer (Perkin Elmer, LS 30, Wellesley, MA) (Hartmann et al., 2005). In addition to the four field replicates, a pooled DNA sample of the four corresponding replicates was prepared.
Genetic profiling of soil bacterial populations
T-RFLP and RISA were performed as described by Hartmann (2005). PCR for T-RFLP analysis was performed with bacteria-specific small subunit ribosomal RNA (SSU rRNA) gene primers 27F (5′-AGAGTTTGATCMTGGCTCAG-3′, FAM-labeled) and 1378R (5′-CGGTGTGTACAAGGCCCGGGAACG-3′) (Heuer et al., 1997) on 10 ng soil DNA, corresponding to an average of 200 μg dry weight soil, in a total volume of 50 μL. PCR products were digested with MspI (Promega, Madison, WI). Restriction products were purified with Microcon YM-30 filter columns (Millipore, Billerica, MA). The T-RF product sizes and quantities were analyzed on an ABI Prism 3100 Genetic Analyzer (Applied Biosystems, Foster City, CA) equipped with 36 cm capillaries filled with POP-4. Peak calling was performed using Genotyper v3.7 NT (Applied Biosystems) and raw data were standardized using z-transformation (Excel, Microsoft, Redmond, WA). PCR for RISA was performed with bacteria-specific primers bRISAfor (5′-TGCGGCTGGATCCCCTCCTT-3′, HEX-labeled) and bRISArev (5′-CCGGGTTTCCCCATTCGG-3′) (Normand et al., 1996) on 30 ng DNA, corresponding to 600 μg dry weight soil, in a total volume of 25 μL. The PCR products were purified with Microcon YM-100 filter columns (Millipore). Analysis of RISA products was as described for T-RFLP.
Statistical analyses
The consistency of the microbial biomass determined with CFE and SIR as well as DNA content was evaluated with Pearson Product-Moment Correlation Coefficients (r). The two-sided t-test was used to determine treatment specific differences. Explorative statistical analyses of T-RFLP and RISA data were performed with Ward cluster analysis based on Euclidean distances with Statistica version 6.1 (StatSoft Inc., Tulsa, OK). For cluster analysis, the mean of replicates and the corresponding pool samples were used in order to reduce dendrogram complexity. The distance matrices used for dendrogram construction were compared using the Mantel test (Mantel, 1967) with NTSYS-pc 2.1 (Rohlf, 2000).
The main factors explaining differences among genetic profiles as well as differences observed in Ward dendrograms were quantified by applying Monte Carlo permutation tests using canoco for Windows 4.5 (Microcomputer Power, Ithaca, NY) according to ter Braak and Smilauer (2002), followed by Bonferroni correction (Bland & Altman, 1995). Significance values were assigned to nodes in dendrograms. Partitioning of variance based on the different treatment factors (Borcard et al., 1992) and ordination of samples relative to treatment factors were performed using redundancy analysis (RDA) with canoco (Hartmann et al., 2005).
The percentage of fragments with significantly different abundance in each farming system and/or in each position in the crop rotation was determined by one way analysis of variance (anova) with Statistica (StatSoft Inc). Potential indicator fragment categories affected by a specific treatment factor, without interaction with other factors, were identified using two-factorial anova.
Results
Biomass and DNA content
Average soil DNA content was highest in BIODYN at both stages in the crop rotation, i.e. winter wheat after potato (P-WW1) and winter wheat after corn (C-WW2) (Fig. 1). The lowest DNA contents were detected in NOFERT. Differences were only significant (P<0.05) between BIODYN and the three systems NOFERT, CONMIN and CONFYM at the P-WW1 crop rotation stage. The soil microbial carbon (Cmic) biomass determined with chloroform fumigation extraction (CFE) revealed highest average values in BIODYN plots and lowest average values in CONMIN plots for both stages in the crop rotation. Cmic biomass in FYM-treated systems, i.e. BIODYN, BIOORG and CONFYM, was significantly (P>0.05) higher than in NOFERT and CONMIN, except for CONFYM at the C-WW2 crop rotation stage. In addition, significant (P<0.05) differences were also observed among plots receiving FYM, i.e. between BIODYN/BIOORG and CONFYM at the P-WW1 crop rotation stage. The soil Cmic biomass determined with SIR revealed highest average values in BIODYN plots and lowest values in NOFERT plots in both stages in the crop rotation. The FYM-treated plots, i.e. BIODYN, BIOORG and CONFYM, contained significantly (P<0.05) higher amounts of Cmic compared to NOFERT and CONMIN plots. Significantly (P<0.05) higher biomass was also found in BIODYN as compared to CONFYM in the C-WW2 crop rotation stage. The correlation between soil DNA contents and biomass was r=0.69 (P<0.001) for SIR and r=0.64 (P<0.001) for CFE. The correlation between CFE- and SIR-biomass was r=0.84 (P<0.001).
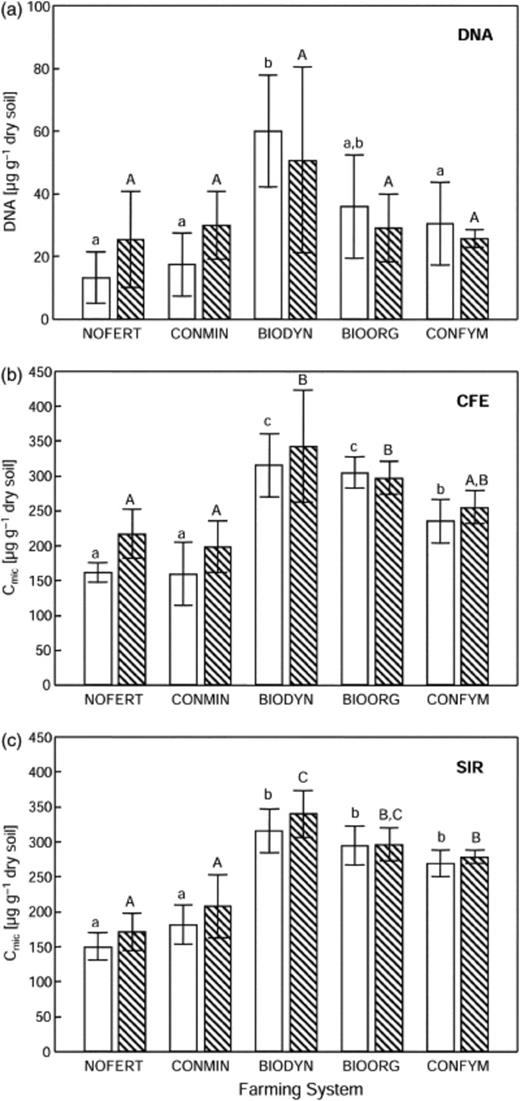
Microbial biomass parameters determined in soils of the DOK long-term field experiment for two stages in the crop rotation, i.e. winter wheat 1 after potato (P-WW1; open bars) and winter wheat 2 after corn (C-WW2; hatched bars). Microbial biomass was determined with soil DNA extraction (a), chloroform fumigation extraction (CFE; b) and substrate induced respiration (SIR; c). Data are presented as mean values and standard deviations of four independent field replicates. Systems marked with different lower case (P-WW1) or upper case (C-WW2) letters are significantly different (t-test; P<0.05). BIODYN: biodynamic; BIOORG: bio-organic; CONFYM: conventional; NOFERT: unfertilized; CONMIN: minerally fertilized (see Table 1)
Soil bacterial community structures
In bacterial genetic community profiles, determined with T-RFLP and RISA targeting the rRNA gene operon, 79 T-RFs with sizes of 61 to 488 relative migration units (rmu) and 73 RISA fragments of 288 to 998 rmu were unambiguously scored across all samples. A cluster analysis of pools and of mathematical averages of replicates of both profiling data sets revealed identical dendrogram topologies with distinct groups for each farming and control system (Fig. 2). Arithmetic averages of the four replicates clustered consistently with the corresponding pools of DNA extracts. The correlation of distance matrices used for dendrogram construction revealed coefficients between 0.87 and 0.93 (P<0.001). Systems receiving FYM were differentiated at the highest branching level (P<0.001) from the control systems with both methods and at both stages in the crop rotation (Fig. 2; branches I vs. II). Among soils receiving FYM, BIODYN was significantly (P<0.01) separated on the second branching level from systems BIOORG and CONFYM (Fig. 2; branches IIa vs. IIb). BIOORG and CONFYM formed distinct groups at the lowest branching node (Fig. 2; branches IIb1 vs. IIb2), but differences were only significant (P<0.05) for RISA profiles at the P-WW1 crop rotation position. CONMIN separated consistently from NOFERT (Fig. 2; branches Ia vs. Ib), but differences were statistically significant only for T-RFLP profiles of the P-WW1 crop rotation stage.
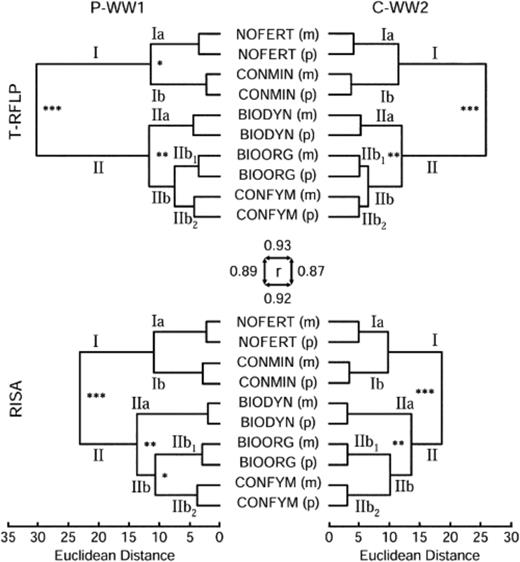
Cluster analysis based on Euclidean distances of bacterial terminal restriction fragment length polymorphism (T-RFLP) and ribosomal intergenic spacer analysis (RISA) data for two stages in the crop rotation of the DOK long-term field experiment, i.e. winter wheat 1 after potato (P-WW1) and winter wheat 2 after corn (C-WW2). Asterisks at nodes indicate significant branchings as determined with Monte Carlo permutation testing performed on the four independent replicates (***P<0.001; **P<0.01; *P<0.05). Labels on specific branches refer to information specified in the text. Euclidean distance matrix correlation was determined with Mantel test statistics and are indicated for comparison of the two stages in the crop rotation (P-WW1 and C-WW2) within the same profiling methods (horizontal arrows) and for comparison of different profiling methods within the same crop rotation (vertical arrows). BIODYN: biodynamic; BIOORG: bio-organic; CONFYM: conventional; NOFERT: unfertilized; CONMIN: minerally fertilized (see Table 1); (m): arithmetic mean of all four field replicates; (p): pooled DNA sample of all four field replicates.
Farming systems and controls significantly (P<0.001; Table 2) influenced the soil bacterial community structures. However, the major effect was attributed to the application of FYM, i.e. NOFERT/CONMIN vs. BIODYN/BIOORG/CONFYM (P<0.001; Table 2). Highly significant differences (P=0.002) were also observed related to the organic fertilization scheme, i.e. BIODYN, BIOORG and CONFYM. The influence of the stage in the crop rotation on the genetic profile data was marginally insignificant (T-RFLP P=0.055; RISA P=0.054).
Significance of effects of agricultural management factors in the DOK experiment on bacterial community structures as determined with Monte Carlo permutation testing of terminal restriction fragment length polymorphism (T-RFLP) and ribosomal intergenic spacer analysis (RISA) data
| Treatment | T-RFLP | RISA |
| Farming system and controls | 0.001 | 0.001 |
| FYM application | 0.001 | 0.001 |
| Organic fertilization scheme | 0.002 | 0.002 |
| Stage in the crop rotation | 0.055 | 0.054 |
| Treatment | T-RFLP | RISA |
| Farming system and controls | 0.001 | 0.001 |
| FYM application | 0.001 | 0.001 |
| Organic fertilization scheme | 0.002 | 0.002 |
| Stage in the crop rotation | 0.055 | 0.054 |
BIODYN, BIOORG, CONFYM, NOFERT, and CONMIN (see Table 1).
BIODYN, /BIOORG, and/ CONFYM vs. CONMIN and /NOFERT.
BIODYN, BIOORG, and CONFYM.
Different stages in the crop rotation, i.e. winter wheat after potato (P-WW1) and winter wheat after corn (C-WW2).
Ordination of data by constrained redundancy analysis also revealed a strong effect of FYM application on the bacterial community profiles (Fig. 3). Samples from NOFERT and CONMIN separated from BIODYN, BIOORG, and CONFYM on the first ordination axis (RDA 1), explaining 25.3% (T-RFLP) or 18.1% (RISA) of the variance. NOFERT vs. CONMIN and BIODYN vs. BIOORG and CONFYM separated on the second ordination axis (RDA 2) explaining 6.3% (T-RFLP) or 6.8% (RISA) of the variance. The stage in the crop rotation had minor influence on the distribution of the genetic profiling data.
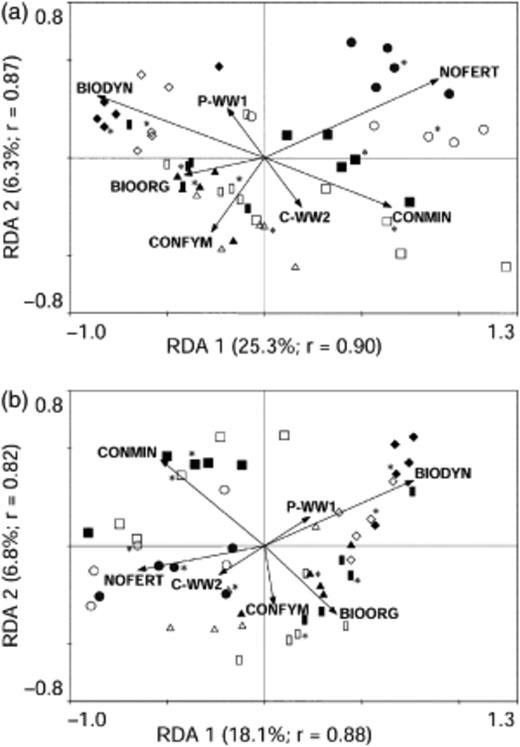
Constrained ordination determined by redundancy analysis of soil bacterial terminal restriction fragment length polymorphism (T-RFLP) and ribosomal intergenic spacer analysis (RISA) profiles for two stages in the crop rotation of the DOK long-term field experiment, i.e. winter wheat 1 after potato (P-WW1) and winter wheat 2 after corn (C-WW2). Data points are based on T-RFs (a) or RISA fragments (b) of each of the four field replicates and the corresponding pool (indicated by asterisks). First (RDA 1) and second (RDA 2) ordination axes are displayed with explained variance in parentheses. Overall correlations between analyzed factors (farming system and stage in the crop rotation) and dependent variables (T-RFs and RISA fragments) on the first two ordination axes were indicated by the corresponding r value. Vector directions indicate maximum variation due to the corresponding factor, while vector lengths indicate strength of the correlation. P-WW1: winter wheat 1 after potato (closed symbols); C-WW2: winter wheat 2 after corn (open symbols). BIODYN: biodynamic (◆/◊); BIOORG: bio-organic  ; CONFYM: conventional (▲/△); NOFERT: unfertilized (●/○); CONMIN: minerally fertilized (▪/◻) (see Table 1).
Partitioning of total variance in the data sets based on the redundancy analysis on all canonical axes revealed that 39.6% (T-RFLP) or 34.7% (RISA) of the variance was explained by the treatment factors, i.e. the farming system and crop rotation (Table 3). The influence of farming systems and controls was approximately eight times higher than that of the stage in the crop rotation. FYM application accounted for 30.9% and 26.1% of the variance, respectively. BIODYN, NOFERT and CONMIN contributed more strongly to the total variance than BIOORG and CONFYM.
Percentage of variance in terminal restriction fragment length polymorphism (T-RFLP) and ribosomal intergenic spacer analysis (RISA) data sets explained by treatment factors of the DOK experiment as determined with redundancy analysis
| T-RFLP | RISA | |
| All measured factors | 39.6 | 34.7 |
| Farming systems and controls | 35.7 | 30.6 |
| FYM application | 30.9 | 26.1 |
| Stage in the crop rotation | 3.9 | 4.1 |
| NOFERT | 14.1 | 9.0 |
| CONMIN | 8.9 | 8.2 |
| BIODYN | 12.8 | 11.2 |
| BIOORG | 4.4 | 5.3 |
| CONFYM | 4.4 | 4.5 |
Influence of all treatment factors investigated, i.e. stage in the crop rotation (P-WW1 and C-WW2) and farming or control systems (BIODYN, BIOORG, CONFYM, NOFERT, and CONMIN; see Table 1).
BIODYN, BIOORG, CONFYM, CONMIN, and NOFERT.
BIODYN, BIOORG, and CONFYM.
P-WW1 and C-WW2.
T-RFs and RISA fragments, which significantly discriminated the different genetic profiles, were identified using anova (Table 4). This analysis revealed that 81% of the fragments were significantly (P<0.05) influenced by the treatment factors. Quantitative differences in abundances were found for 44% (T-RFLP) and 60% (RISA), while qualitative differences were detected for 37% (T-RFLP) and 21% (RISA) of the fragments. Seventy-six percent or 78% of all fragments revealed significantly altered abundance among all treatments, i.e. BIODYN, BIOORG, CONFYM, CONMIN and NOFERT, while 25% or 28% altered between the two stages in the crop rotation. Most of the fragments with significantly different abundances among the farming systems were attributed to FYM application. Using pairwise comparisons of the treatments, 37–60% of all fragments were significantly different in abundance between the plots that did receive FYM and plots that did not receive FYM, whereas 11 to 53% altered within the three farming systems and 15 or 22% between the controls. Forty-six percent or 52% of all fragments significantly altered only based on the farming system without revealing a farming system × crop rotation position interaction and were designated potential farming system indicators. Three percent or 4% of the fragments were identified as potential indicators for the stages in the crop rotation. Thirty eight percent and 49% of the fragments were identified as potential FYM application indicators. Percentages of altering fragments between T-RFLP and RISA as determined with anova (Table 4) showed high correlation of r=0.94 (P<0.001).
Number and percentage of terminal restriction fragments (T-RF) and ribosomal intergenic spacer analysis (RISA) fragments significantly (P<0.05) influenced by treatment factors of the DOK experiment as determined with anova
Percentages are indicated in parentheses.
Significantly (P<0.05) different intensities in at least one treatment.
Present or absent T-RF or RISA fragment in at least one treatment.
Differences regarding stage in the crop rotation (P-WW1 and C-WW2) and farming or control systems (BIODYN, BIOORG, CONFYM, NOFERT, and CONMIN; see Table 1).
Significant (P<0.05) differences without interaction of farming system and crop rotation.
Discussion
Data on physical, chemical and biological soil characteristics of the present and previous studies from the DOK field experiment revealed reproducible and representative differences induced by different agricultural management and control systems (Alföldi et al., 1995; Mäder et al., 2002; Widmer et al., in press). Biomass and DNA contents were correlating with previous biomass determinations in the DOK field experiment (Mäder et al., 2002; Widmer et al., in press) and confirmed the high comparability of these indices as reported before (Marstorp et al., 2000; Bundt et al., 2001; Blagodatskaya et al., 2003; Hofman & Dusek, 2003; Hartmann et al., 2005; Widmer et al., in press). The extraction of high quality DNA is essential for performing unbiased genetic profiling, and correlating DNA content with established biomass estimates represents one means to validate the quality and representativity of extracted DNA. The relatively large variation among the replicates of DNA measurements, which reduced the statistical discrimination power, may be mainly explained by extraction from fresh soil as well as by the small sample sizes of 0.5 g soil. However, the highly reproducible genetic profiles among replicate samples and the profiling techniques revealed a high representativity of these DNA extracts, which represents a prerequisite for the detailed analysis of effects due to agricultural management factors (Widmer et al., in press) or other influences (Hartmann et al., 2005).
Statistical analysis of data from genetic profiling revealed (i) identical dendrogram topologies and highly similar distance matrices (Fig. 2), (ii) similar significant differences by permutation testing (Table 2, Fig. 2), (iii) similar sample distribution by redundancy analysis (Fig. 3), and (iv) a high correlation of changes detected by anova (Table 4). In addition, the genetic profiles of pooled samples, representing the experimental averages of replicates, clustered consistently with the corresponding arithmetic averages of the four field replicates (Fig. 2). Altogether, the high consistency provided strong support that T-RFLP and RISA are reliable tools for studying effects on soil bacterial community structures (Hartmann et al., 2005).
Agriculturally managed soils tend to show decreased microbial diversity when compared to pristine soils (Torsvik et al., 2002). However, few direct comparisons reported the extent to which factors such as fertilization and crop species induce differences in microbial community structures (Kennedy et al., 2004; Marschner et al., 2004; Widmer et al., in press). Cluster analysis and hierarchical ranking of treatment effects on soil bacterial community structures with discriminative statistics represented a helpful approach to classify the extents of different environmental or agricultural impacts (Hartmann et al., 2005). In addition, fragments indicating treatment-specific effects such as the farming system or crop-species in the genetic profiles can be statistically identified (Table 4; Hartmann et al., 2005). In the future, this may allow for the phylogenetic identification of organisms associated with specific treatments and the development of treatment-specific indicator diagnostics, which are prerequisites for environmental monitoring (Widmer et al., in press).
The genetic profiles of bacterial communities in the soils of the DOK field revealed major differences between soils receiving FYM, i.e. BIODYN, BIOORG and CONFYM, and soils receiving no (NOFERT) or mineral fertilization (CONMIN). Cluster analysis and permutation testing (Fig. 2, Table 2), canonical ordination (Fig. 3) and anova (Table 4) revealed that the effects on microbial communities induced by FYM application were the most pronounced. Most of the detected ribotypes, i.e. 62% of T-RFs and 60% of RISA fragments, indicated highly significant differences between FYM and non-FYM treated plots. This may be explained by the addition of the readily available organic matter and nutrients contained in FYM, by the introduction of bacterial populations via FYM application, or by secondary effects of the FYM application such as altered soil characteristics or plant growth (Bossio et al., 1998). Strong effects on microbial communities induced by addition of organic matter via FYM application were found with DNA-based approaches (Parham et al., 2003; Sun et al., 2004; Widmer et al., in press), by analyzing fatty acid profiles (Carpenter-Boggs et al., 2000; Peacock et al., 2001) or using community level substrate utilization (CLSU) analysis (Widmer et al., in press). In contrast, in a field experiment started in 1984, Suzuki (2005) suggested that effects on microbial communities, as determined by T-RFLP and fatty acid methyl ester (FAME) profiles, may be dominated by mineral fertilizer application due to changes in chemical soil parameters such as soil pH or exchangeable calcium. In the present study, mineral fertilization induced consistent differences in microbial communities when compared to unfertilized plots (Fig. 2, Table 4), but these differences were clearly smaller when compared to FYM-related effects. This finding is supported by the results of other studies comparing FYM and minerally fertilized systems (Carpenter-Boggs et al., 2000; Parham et al., 2003; Sun et al., 2004; Widmer et al., in press). The causes for these different findings are not known, but different conditions regarding systems, soil types or climate may be important. Furthermore, comparisons among different studies may be difficult, because terms such as ‘biodynamic’ or ‘conventional’ farming in current agriculture are subject to different definitions regarding fertilization, plant protection and soil cultivation. Beside the changes in the community structures, the number of microorganisms also increased in FYM-related systems, as indicated by higher microbial biomass, i.e. CFE-Cmic, SIR-Cmic and DNA content (Fig. 1). An increase in biomass parameters through the stimulation of microbial growth by providing organic substrates was previously observed in the DOK field experiment (Mäder et al., 2002; Widmer et al., in press) and in other systems (Goyal et al., 1993; Bossio et al., 1998; Carpenter-Boggs et al., 2000; Peacock et al., 2001; Parham et al., 2003).
Previous results from CLSU analyses in the DOK field experiment revealed smaller differences of bacterial profiles between BIODYN and BIOORG than between any other analyzed system (Mäder et al., 2002). In contrast, T-RFLP and RISA profiles in the present study revealed smallest differences between BIOORG and CONFYM, whereas BIODYN was significantly different from these systems (Fig. 2, Table 4). Differences between organic and conventional farming systems have been reported in an other long-term system, managed for 8 to 9 years before sampling (Bossio et al., 1998; Lundquist et al., 1999). Differences between bio-organically and biodynamically treated soils have not been observed in a short-term experiment with a duration of one growing season (Carpenter-Boggs et al., 2000). This suggested that the differences between the systems may develop over a long period of time and may not be detectable in short-term experiments. Long-term factors such as increased soil pH, humus content and organic carbon, in combination with short-term factors such as different amounts of N, P, K and Mg, may have lead to the development of distinct microbial communities in BIODYN (Alföldi et al., 1995). The special character of the biodynamic system was also observed in the microbial biomass parameters, which revealed the highest average amounts in BIODYN, followed by BIOORG, and the lowest amounts in CONFYM (Fig. 1). The lower content of microbial biomass in the conventional system was in agreement with former studies (Bossio et al., 1998; Castillo & Joergensen, 2001; Mäder et al., 2002). Therefore, more detailed investigations of factors and affected soil microorganisms in the BIODYN soils of the DOK field experiment are required.
The influence of crops on soil microbial communities has been reported to be complex and to depend on crop type as well as on specific soil characteristics, sampling time and sample type (Grayston et al., 1998; Smalla et al., 2001; Marschner et al., 2004). Widmer (in press) have reported significant effects of grass-clover and winter wheat on soil microbial community structures by using T-RFLP analysis in the DOK field experiment. These crop effects were smaller than the effects of FYM application, but stronger than those of BIODYN, BIOORG and CONFYM. Other studies have come to various conclusions by finding either dominant effects of fertilizer when compared to crops (Kennedy et al., 2004), or opposite results (Bardgett et al., 1999). In the present study, the effects of the different stages in the crop rotation, i.e. winter wheat following potato and winter wheat following corn, which simulates a preceding crop effect on the soil microbial community structures, were smaller than any farming system related effects and marginally insignificant (Fig. 2). Although the effects of preceding crops on the bacterial community structures have been reported before (Lupwayi et al., 1998), they appeared to be smaller when compared to fertilization and plant protection. This was also confirmed by the dominant influence of the farming systems on data variance when compared to the preceding crop (Table 3). The crop effects described by Widmer (in press) ranked between the effects of FYM application and those of different FYM types and thus were clearly more pronounced than the effects of preceding crops reported in the present study.
Conclusions
The stability and consistency of the experimental system and the methodological approach demonstrated the importance of well designed long-term field experiments and robust monitoring techniques. The application of T-RFLP and RISA in combination with statistical analysis allowed to hierarchically rank the effects of defined agricultural management factors on soil bacterial community structures. Data from the present as well as a previous study by Widmer (in press) revealed that the application of farm yard manure to the soils had the most significant influence on bacterial community structures and biomass parameters. The influence of the crops occurred on the second hierarchical level followed by effects driven by biodynamic, bio-organic and conventional management systems. The preceding crops in the crop rotation had only a minor influence on community structures and soil biomass. The identification of treatment-associated taxa detected by statistical tools may be an important subsequent step in order to provide powerful indicators and diagnostic tools.
Acknowledgements
The DOK field experiment is a long-term project funded by the Swiss Federal Office for Agriculture (BLW). The continuous high quality management of the field experiment by the field teams of Agroscope FAL Reckenholz and FiBL, as well as support given by farmers, is greatly acknowledged. We wish to acknowledge Roland Kölliker for providing important assistance in statistical analysis and for helpful comments on this manuscript. We are grateful to Manuel Pesaro and David Dubois for critical discussions and comments on this manuscript. The project was supported by funding from the Swiss National Science Foundation (SNF).
References
