


Abstract
The bacterial community composition of the active layer (0–45 cm) of a permafrost-affected tundra soil was analysed by fluorescence in situ hybridisation (FISH). Arctic tundra soils contain large amounts of organic carbon, accumulated in thick soil layers and are known as a major sink of atmospheric CO2. These soils are totally frozen throughout the year and only a thin active layer is unfrozen and shows biological activity during the short summer. To improve the understanding of how the carbon fluxes in the active layer are controlled, detailed analysis of composition, functionality and interaction of soil microorganisms was done. The FISH analyses of the active layer showed large variations in absolute cell numbers and in the composition of the active microbial community between the different horizons, which is caused by the different environmental conditions (e.g., soil temperature, amount of organic matter, aeration) in this vertically structured ecosystem. Universal protein stain 5-(4,6-dichlorotriazin-2-yl)aminofluorescein (DTAF) showed an exponential decrease of total cell counts from the top to the bottom of the active layer (2.3 × 10⁹–1.2 × 10⁸ cells per gram dry soil). Using FISH, up to 59% of the DTAF-detected cells could be detected in the surface horizon, and up to 84% of these FISH-detected cells could be affiliated to a known phylogenetic group. The amount of FISH-detectable cells decreased with increasing depth and so did the diversity of ascertained phylogenetic groups.
1 Introduction
Arctic tundra soils contain large amounts of organic carbon, accumulated in thick layers of soil organic matter [1,2] and are known as a major sink of atmospheric CO2 during the Holocene [3,4]. The reason for the accumulation of organic material is a reduced microbial decomposition of organic matter due to the extreme climatic conditions. Generally, this decomposition is slow and incomplete with high moisture and low temperature [5]. Arctic tundra soils are totally frozen throughout the year and only a thin active layer is non-frozen and shows biological activity during the short summer. In this extreme environment microorganisms have to be capable of withstanding low temperature and repeated freezing–thawing cycles. Due to the underlying ice shield large part of the soils is waterlogged and decomposition of organic matter takes place under anaerobic conditions. The final step in the process of anoxic decomposition of complex organic matter is methanogenesis. Therefore, tundra soils are one of the most important sources in the budget of atmospheric methane (CH4), which is the second significant greenhouse gas after carbon dioxide [6]. Tundra wetlands are estimated to emit between 20 and 40 Tg yr−1 CH4[7]. It accounts for 20% of global methane emission [8].
The large carbon pool in the northern latitudes together with a predicted climate warming [9] leads to speculations about a possible feedback effect on global climate changes by increased decomposition of organic matter and possible increased methane emission [9,10]. For a better prediction of how such changes in environmental conditions may affect the carbon pool, a detailed knowledge of composition, functionality and interaction of microorganisms involved in the carbon cycle is important.
In general, the number, diversity, and activity of soil organisms are influenced by soil organic matter properties (e.g., content, availability), soil texture, pH, moisture, temperature, aeration, and other factors [11]. Soil is a heterogeneous environment and soil aggregates, soil pores, and root environments (rhizosphere) provide numerous niches for different soil microbial communities. Because of the complex vertical structure of the soil and the physical and chemical differences between the horizons it is not possible to deduce a subsurface community structure from analysing surface soils. Deeper layers may contain microbial communities, which are specialised for their environment and differ from surface communities [12,13].
Cultivation-based methods usually fail to give a complete picture of the composition of complex communities [14–16]. Molecular, i.e., cultivation-independent techniques could give complementary insight into complex environments. The FISH method is based on the detection of rRNA. Because the rRNA content is associated with the metabolic state of the organism [17–19], FISH results are influenced by the activity of the cells [20–25]. Although FISH signals cannot directly be translated to cell activity status it is approved that there is a positive relationship between bacterial metabolic rates and the capacity to detect the active cells [26]. In ecological studies it could be an advantage to describe the composition of the more active, and hence ecologically relevant part of the community instead of the total existent population.
The aim of this study was to characterise the population of active microorganisms in the whole active layer of a permafrost-affected soil, by using FISH without previous cultivation.
2 Materials and methods
2.1 Study site and soil conditions
The investigation site is located on Samoylov (N 72°22, E 126°28), a typical island of the central part of the Lena Delta, Siberia. Detailed description of the geomorphologic situation of the island and the whole delta was given previously [27–29]. With an area of about 32,000 km2, the Lena Delta is the second largest delta in the world. It is situated in the continuous permafrost zone. The mean annual air temperature in the period 2001–2003, measured by a Russian weather station on Stolb Island, which is approximately 8 km away from Samoylov Island, was −11.9 °C; mean annual precipitation in the same period was about 233 mm [30]. The landscape of the delta is dominated by a microrelief of ice-wedge polygons, which develop due to annual freeze–thaw cycles. The soils are totally frozen for at least eight months every year and only a shallow active layer of about 20–50 cm is unfrozen during the summer months. Predominant landscape formations are low-centred polygons where the flat central parts are surrounded by raised rims. The investigated soils in the polygon centres are characterised by a water level near the soil surface, which, together with the cold climate conditions, leads to an accumulation of organic matter and formation of peat layers. The mainly anaerobic decomposition of soil organic matter generates high CH4 production and emission rates from these sites. Mean flux rates of 53.2 ± 8.7 mg CH4 m−2 d−1 were measured for the polygon centres for the period between the end of May and the beginning of September 1999 [27].
The soil in the centre of a typical polygon was described and sampled in August 2001. At this time the thaw depth of the active layer was up to 45 cm with the water table 18 cm below the surface. The vegetation in the polygon centres site was composed of a moss/lichen layer (total coverage 95%) and a vascular plant layer (total coverage 30%). The latter was dominated by the sedge, Carex aquatilis[31]. For soil description and sampling, a vertical soil profile was dug. Four different peaty, sandy loam textured soil horizons were distinguished. They were covered by a horizon consisting of weakly decomposed organic material. Subsamples for physio-chemical soil characteristics and biological analyses were taken in a horizontal way subsequently after the horizons were identified. Samples for biological analyses were placed into 250 ml Nalgene boxes, which were locked with a seal tape to prevent oxygen contamination of the samples. To ensure detailed investigation of the soil, horizons with a thickness of more than 10 cm were subdivided and subsamples were taken. Soil properties (Table 1, Fig. 1) were described according to Schoeneberger et al. [32] and laboratory analyses were done according to Schlichting et al. [33]. The soil was classified as Typic Historthel according to US Soil Taxonomy [34].
Selected soil physico-chemical characteristics of the investigated Typic Historthela
| Horizonb | Depth (cm) | Soil textureb (%) | Textural classb | Munsell colorc | Rootsb | Reducing soil conditionsd | ||
| Sand | Silt | Clay | ||||||
| Oi | 0–5 | – | n.d. | Many | No | |||
| 5–10 | – | n.d. | Many | No | ||||
| 10–17 | – | n.d. | Many | No | ||||
| A | 17–20 | 77 | 15 | 8 | Sandy loam | 10YR 2/1 | Many | Yes |
| Bg 1 | 20–23 | 76 | 18 | 6 | Sandy loam | 2,5Y 4/4 | Common | Yes |
| Bg 2 | 23–30 | 69 | 26 | 5 | Sandy loam | 10YR 3/2 | Few | Yes |
| 30–35 | 68 | 27 | 5 | Sandy loam | 10YR 3/2 | Few | Yes | |
| Bg 3 | 35–40 | 65 | 29 | 6 | Sandy loam | 10YR 4/2 | None | Yes |
| 40–45 | 60 | 33 | 7 | Sandy loam | 10YR 4/2 | None | Yes | |
aSoil classification was done according to US Soil Taxonomy Soil Survey Staff [34].
bClassifications were done according to Schoeneberger et al. [32].
cSoil colour determination was done according to the Munsell soil colour charts [72].
dReducing soil conditions were detected by using α–α′-Dipyridil test. Soil Survey Staff [34].
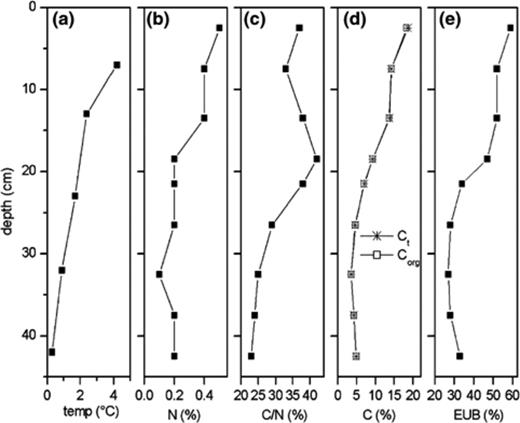
Vertical profile of selected soil properties and EUBmix counts relative to total bacterial cell numbers. (a) Average soil temperature in August, (b) N content, (c) C/N ratio, (d) C content, and (e) fraction of TBC detected with probe EUBmix. C and N contents were measured using Vario EL III elemental analyzer (Elementar Analysensysteme, Germany).
The active layer is subject to great temperature variations between the different horizons. Automatic soil temperature measurements were started in 1998 using Thermistor Soil Temperature Probes 107 (Campbell Scientific Ltd.). The temperature sensors were installed in different depths between soil surface and permafrost table [35]. The average, minimum and maximum temperatures in August for three years are given (Table 2). During summer the upper soil horizons had not only a higher average temperature, compared to the deeper horizons. They were also exposed to a strong diurnal fluctuation, decreasing with depth. The minimum winter temperature measured was −37 °C at a depth of 7 cm and increased up to −29 °C at a depth of 42 cm. The upper soil above 23 cm depth was frozen for 8 months, while the deeper horizons were frozen for 9–10 months in the year.
August temperatures in different soil depths of the investigated Typic Historthel
| Depth (cm) | Temperature (°C) in August (avg. min./max.) | |||||
| 1998 | 1999 | 2001 | ||||
| 7 | 4.2 | 0.7/12.8 | 5.1 | 1.8/11.1 | 4.2 | 0.8/11.4 |
| 13 | 2.4 | 0.8/5.3 | 3.6 | −0.6/8.6 | – | – |
| 23 | 1.7 | 0.0/3.2 | – | – | – | – |
| 32 | 0.9 | 0.4/1.7 | 1.9 | −1.6/3.2 | 2.2 | 1.3/4.0 |
| 42 | 0.3 | −0.6/0.6 | 0.9 | 0.4/4.1 | 1.2 | 0.6/2.1 |
–, No temperature was determined due to broken temperature sensor.
2.2 Sample preparation for cell counts
Subsamples for cell counts by 5-(4,6-dichlorotriazin-2-yl)aminofluorescein (DTAF) staining and FISH were frozen immediately after sampling and were transported to Germany. After transportation they were thawed at 3 °C. Immediately after thawing subsamples of 1gram were either fixed directly in ethanol (96%) or in a freshly prepared, 4% paraformaldehyde/phosphate-buffered saline (PBS) solution (pH 7.2) for 4 h at 5 °C. The paraformaldehyde-fixed samples were then washed with PBS and stored in ethanol–PBS (1:3) at −20 °C. Before application to slides, we diluted the samples with 0.1% sodium pyrophosphate in distilled water to obtain 100–200 cells per microscopic field of view. The dilution was dispersed by mild sonication with an MS73 probe (Sonopuls HD70; Bandelin, Berlin, Germany) at a setting of 20 for 30 s. Dispersed soil samples were spotted on gelatin-coated (0.1% gelatine, 0.01% KCr(SO4)2) Teflon-laminated slides with ten wells. Twenty μl of fixed and dispersed soil sample were dropped onto each well, allowed to air dry, and dehydrated by serial immersion of the slides in 50%, 80%, and 96% ethanol. The FISH method was used directly in soil smears because extraction of bacterial cells from soil is difficult to perform due to the exclusion of bacteria associated with soil particles [25].
2.3 Non-selective staining of all cells (DTAF staining)
Before the slides were prepared for FISH, they were stained with the universal protein stain DTAF. Freshly prepared stain solution consisted of 2 mg of DTAF dissolved in 10 ml of phosphate buffer (0.05M Na2HPO4 with 0.85% NaCl, pH 9 [36]). The staining procedure was done as described by Bloem et al. [37]. A drop of stain solution was given on each well with dried soil film and incubated for 30 min at room temperature. After staining the slides were washed three times for 20 min each with phosphate buffer (pH 9). Finally they were passed through four water bathes each for a few seconds and air-dried.
2.4 Fluorescence in situ hybridisations and probe description
All oligonucleotide probes used in this study were purchased from Interactiva (Ulm, Germany). They were labelled with the cyanine dyes Cy3 or Cy5. Probes for the domains Bacteria and Archaea and specific probes for different phylogenetic groups of Bacteria were used. All probe sequences, formamide concentrations in hybridisation buffer, NaCl concentrations in washing buffer, and references are summarised in Table 3. For each hybridisation the bacterial probe EUBmix was used together with one specific probe marked with a different dye. Therefore, the target cells of the group specific probes were marked with three different dyes.
rRNA-targeted oligonucleotide probes used for hybridisation
| Probe | Target group | Sequence (5′–3′) of probe | Target sitea | FAb (%) | NaClc (mM) | Reference |
| EUB338* | Domain Bacteria | GCTGCCTCCCGTAGGAGT | 16S (338) | 0–35 | 80–900 | [73] |
| EUB338 II* | Domain Bacteria | GCAGCCACCCGTAGGTGT | 16S (338) | 0–35 | 80–900 | [74] |
| EUB338 III* | Domain Bacteria | GCTGCCACCCGTAGGTGT | 16S (338) | 0–35 | 80–900 | [74] |
| NON338 | Control probe complementary to EUB338 | ACTCCTACGGGAGGCAGC | 16S | 0–35 | 80–900 | [75] |
| ARC915 | Domain Archaea | GTGCTCCCCCGCCAATTCCT | 16S (915) | 20 | 225 | [39] |
| ALF968 | α-subclass of Proteobacteria | GGTAAGGTTCTGCGCGTT | 16S (968) | 35 | 80 | [76] |
| BET42a | β-subclass of Proteobacteria | GCCTTCCCACTTCGTTT | 23S (1027) | 35 | 80 | [77] |
| GAM42a | γ-subclass of Proteobacteria | GCCTTCCCACATCGTTT | 23S (1027) | 35 | 80 | [77] |
| CF319A** | Cytophaga–Flavobacterium cluster of CFB-phylum | TGGTCCGTGTCTCAGTAC | 16S (319) | 35 | 80 | [77] |
| CF319B** | Same as CF319A | TGGTCCGTATCTCAGTAC | 16S (319) | 35 | 80 | [77] |
| HGC69a | Gram-positive bacteria with high GC content | TATAGTTACCACCGCCGT | 23S (1901) | 25 | 159 | [78] |
| LGC354A*** | Gram-positive bacteria with low GC content | TGGAAGATTCCCTACTGC | 16S (354) | 35 | 80 | [79] |
| LGC354B*** | Same as LGC354A | TGGAAGATTCCCTACTGC | 16S (354) | 35 | 80 | [79] |
| LGC354C*** | Same as LGC354A | TGGAAGATTCCCTACTGC | 16S (354) | 35 | 80 | [79] |
*–***, Probes marked with the same amount of * are applied in equimolar mixtures.
aEscherichia coli numbering.
bPercentage (vol/vol) of formamide in the hybridisation buffer.
cPercentage (vol/vol) of NaCl in the washing buffer.
In situ hybridisations with probes HGC69a and LGCmix were done on ethanol-fixed samples, while paraformaldehyde-fixed soil samples were used for probing gram-negative bacteria. Probe NON338 was used as a negative control for the ethanol-fixed as well as the paraformaldehyde-fixed samples. In situ hybridisations were performed similarly as described elsewhere [38,39]. A 10 μl aliquot of hybridisation buffer (0.9 M NaCl, 20 mM Tris–HCl; pH 8.0), 0.02% sodium dodecyl sulfate (SDS), formamide in concentrations as given in Table 3, and 30 ng/μl of probe was placed on each well. The slides were transferred to an equilibrated 50 ml polypropylene top tube [24] and incubated at 46 °C for 90 min. Slides were then washed at 48 °C for 10 min in washing buffer (20 mM Tris–HCl, pH 8.0), 5 mM EDTA, 0,01% SDS w/v, NaCl concentration as given in Table 3. Afterwards they were washed in ice-cold double-distilled water for a few seconds and quickly dried in an air stream. Finally slides were mounted in Citifluor AF1 antifadent (Plano; Wetzlar, Germany) and covered with a coverslip.
2.5 Microscopy and quantification
A Zeiss LSM 510 scanning confocal microscope equipped with an Ar ion laser (488 nm), and two HeNe lasers (543 and 633 nm) was used to record optical sections. Image handling was done with the LSM510 software (version 2.3). Small fluorescent pieces of the soil matrix hindered an automatic detection with our equipment, as was described, e.g., by Daims et al. [40], therefore the counting was done manually. For each hybridisation approach at least 1000 DTAF-stained cells were counted on at least 10 randomly chosen fields. For each horizon the rate of bacteria detectable by FISH (cells containing a sufficient number of ribosomes [16]) was calculated by counting EUBmix-positive signals relative to DTAF-counts on PFA-fixed samples. These calculations were corrected for samples with high proportions of gram-positive bacteria, according to Friedrich et al. [41]. This was done by adding the amount of bacteria detected by probes HGC69a and LGCmix in the ethanol-fixed samples to the EUBmix counts.
Group-specific cell counts were performed with DTAF-stained soil samples simultaneously hybridised with Cy5-labelled EUBmix and the respective group-specific Cy3-labelled probe. This procedure enabled a threefold staining of the target-cells. This was important because background signals of non-bacterial soil particles often hinder clearly convincing results in soil samples, when using a single fluorescent probe [42]. Quantification of specific cells was done relative to the number of EUBmix-hybridised cells. Counting results were always corrected by subtracting signals obtained with the probe NON338.
For calculating the number of cells per gram of soil (BC), the mean count of bacteria per counting area (B), the microscope factor (area of the sample spot/area of counting field), (M) the dilution factor (D) and the weight of fixed sample used for hybridisation (W) were determined and arranged in the equation BC=B×M×D×W−1.
3 Results and discussion
Total bacterial cell numbers (TBC) in the soil, determined by DTAF staining, ranged from 1.2 to 23.0 × 10⁸ cells g−1. These numbers were comparable to TBCs found in other arctic soils [43], and peat [44] and soils of other regions [45]. As shown in Table 4 and Fig. 1, TBC were highest (23.0 × 10⁸ cells g−1) in the uppermost 5 cm layer of the soil and decreased with depth. In the deepest investigated horizon (40–45 cm) 1.2 × 10⁸ cells g−1 were detected. It corresponds to 10% of the TBC detected in the surface horizon. TBC decreased exponentially with increasing depth (r2= 0.9711), with the exception in the horizon between 17 and 20 cm soil depth, where cell counts in the same order as in the layer above were retrieved (Table 4). Total cell counts for the deepest sample of the active layer were in the same range as other studies found below the permafrost table in continuously frozen sediments in Russia using acridine orange [46], DTAF staining [47], or direct visual microscopic counting [48].
Total bacterial numbers in different horizons of the soil analysed after DTAF staining and relative percentage of hybridised cells with specific probes
| Sample depth (cm) | Total cell counts (cells/g [108]) (mean ± SD) | % of DTAF cells (mean ± SD) detected with specific probesa | % Affiliated Eubacteriab | |||||||
| EUBmix | ALF968 | BET42a | CF mix | GAM42a | HGC69a | LGCmix | ARC915 | |||
| 0–5 | 23.0 ± 7.8 | 59 ± 12 | 1.3 ± 1.2 | 11.7 ± 3.2 | 8.4 ± 5.6 | 3.3 ± 0.7 | 4.3 ± 2.3 | 5.7 ± 2.0 | 0.5 ± 0.7 | 34.7 |
| 5–10 | 13.8 ± 3.3 | 52 ± 7 | 0.5 ± 0.9 | 6.3 ± 1.2 | 3.4 ± 3.2 | 9.8 ± 2.1 | 7.5 ± 2.3 | 1.0 ± 1.0 | 22.4 ± 30.0 | 29.0 |
| 10–17 | 9.2 ± 2.9 | 52 ± 10 | 5.5 ± 2.2 | 11.9 ± 2.4 | 5.1 ± 5.1 | 3.2 ± 1.2 | 10.0 ± 4.4 | 7.7 ± 7.1 | 9.9 ± 23.3 | 44.0 |
| 17–20 | 10.4 ± 3.2 | 47 ± 16 | 1.1 ± 1.3 | 9.5 ± 0.8 | 0.4 ± 1.0 | 2.9 ± 0.8 | 12.6 ± 3.2 | 3.1 ± 2.6 | 5.2 ± 11.1 | 31.9 |
| 20–23 | 5.5 ± 2.1 | 34 ± 6 | 2.1 ± 1.5 | 4.7 ± 1.0 | 0.0 ± 0.0 | 5.6 ± 2.5 | 10.8 ± 5.8 | 3.2 ± 2.2 | 7.2 ± 16.6 | 28.5 |
| 23–30 | 3.7 ± 1.5 | 28 ± 6 | 2.8 ± 3.5 | 3.4 ± 1.0 | 1.1 ± 1.1 | 0.0 ± 0.0 | 4.7 ± 3.3 | 0.4 ± 0.8 | 2.6 ± 5.8 | 12.2 |
| 30–35 | 2.6 ± 0.7 | 27 ± 10 | 0.4 ± 0.9 | 5.2 ± 0.4 | 0.0 ± 0.0 | 0.1 ± 0.9 | 0.1 ± 0.1 | 0.4 ± 0.8 | 0.9 ± 2.4 | 17.2 |
| 35–40 | 2.0 ± 0.7 | 28 ± 5 | 0.2 ± 0.6 | 5.5 ± 0.8 | 0.0 ± 0.0 | 0.2 ± 0.5 | 2.2 ± 1.2 | 1.2 ± 1.8 | 8.1 ± 19.3 | 15.2 |
| 40–45 | 1.2 ± 0.5 | 33 ± 8 | 3.8 ± 1.8 | 2.9 ± 2.0 | 0.0 ± 0.0 | 0.0 ± 0.0 | 4.9 ± 2.4 | 0.1 ± 0.4 | 1.0 ± 1.8 | 12.2 |
aPercent detection compared to DTAF. Numbers have been corrected by subtracting NON338 counts. Probe names are abbreviations of those shown in Table 1.
bResults obtained from the addition of counts with all above named specific probes without probe ARC 915.
Not only the total cell numbers, but also the fraction of cells detectable with probe EUBmix, which identified members of the domain Bacteria, decreased by depth from 59% to around 30% (Table 4). This decrease in the fraction of detectable bacteria was due to a strong exponential decrease (r2= 0.963) of absolute EUBmix counts from 13.6 to 0.4 × 10⁸ cells g−1 (Fig. 2). There were only a few studies to compare our data. The soil samples in which Zarda et al. [49] and Christensen et al. [25] found 41% or only 5% of the TBC with probe EUB338, were from the upper 10 cm of soils located in the temperate zone. A more comparable environment could be the Siberian peat samples investigated by Dedysh et al. [44], in which up to 65% of TBC were found with EUB 338. These results indicate that the extreme low temperatures in the investigated tundra soil did not lead to lower amounts of active bacteria than that from other soils. The high amounts of active bacteria found in our investigation of tundra soil as well as by Dedysh in the peat samples could be attributed to the very high content of organic matter, especially in the upper horizons. It is accepted and shown in other studies that carbon availability is the most important limiting factor for microbial growth in soil [50–53]. Its possible influence on the activity of cells and hence on their ribosome content enhanced the detectability by FISH. Therefore the decreased EUB detection found in the deeper soil horizons could be attributed to the lower C content in these horizons. The EUB detection rates throughout the soil profile showed a very strong correlation to Corg content (R2= 0.951, p= < 0.0001, n= 9) (Fig. 1(d) and (e)). Considering the low temperatures, at which mesophilic organisms show a drastic decrease of metabolic activity, the EUBmix amounting of the TBC number in the deeper horizons indicated the existence of psychrophilic or at least psychrotrophic organisms.
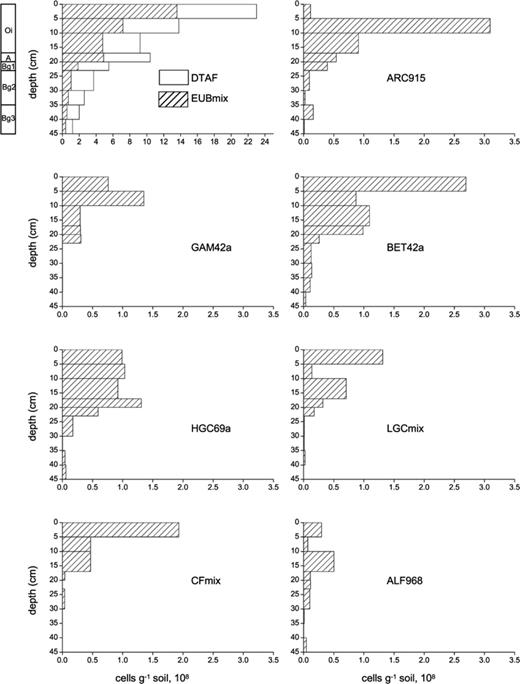
Vertical profile of absolute numbers of bacteria detected with different probes in the investigated Typic Historthel. All data correspond to 1 g soil (dry weight). Probe names and target groups are explained in Table 3. Note the different x-axis range of the first diagram. Classification of the soil profile in different horizons is given on the left of the DTAF/EUBmix profile.
In contrast to the distribution observed for the domain Bacteria, none of the individual major phylogenetic groups showed a clear exponential decrease of cell numbers with depth. Notably, the highest abundance of the gram-positive Bacteria with a high G + C content, the α-Proteobacteria, and the γ-Proteobacteria was found in horizons below the top 5 cm. However, all groups showed much higher abundances in the upper part of the profile and a significant reduction in cell numbers in depths below 23 cm. Apparent differences among the individual bacterial groups were the amount of cell numbers and their distribution in soil profile (Fig. 2). This can be explained by different habitat requirements for the bacterial groups as well as positive and negative influences among bacterial species.
For example, the Cytophaga–Flavobacterium cluster (CF group) of CFB phylum (Cytophaga–Flavobacterium–Bacteroides phylum) was found in the amount between 2.0 × 10⁸ and 0.5 × 10⁸ cells g−1 in the upper 17 cm of soil. Most of the known members of this group are organotrophic, aerobic bacteria that are specialised in the degradation of complex macromolecules like proteins, pectin or cellulose [54,55]. The influence of water level and organic matter on the abundance of the Cytophaga–Flavobacterium group was obvious. In the aerobic upper 17cm layer of the soil, the top 5 cm layer containing the highest amount of organic matter had the highest amount of cells of Cytophaga–Flavobacterium group whereas in the anaerobic zone, below the water table at 18 cm, nearly no cells were detected. This major difference in cell abundance between the aerobic and anaerobic horizons was not found for the other phylogenetic groups. For the high G + C group, cell counts were nearly equal (approximately 1 × 10⁸ cells g−1) in the horizons between 0 and 20 cm whereas the gram-positive Bacteria with low G + C content showed a more varying distribution in the upper 20 cm layer with cell numbers between 1.3 and 0.3 × 10⁸ g−1.
The abundances of the phylogenetic groups as illustrated in Fig. 2 led to the different compositions of active Bacteria in the horizons as shown in Fig. 3. With our set of probes for major phyla within the domain Bacteria we could affiliate between 12.2% and 44.0% of the total DTAF counts (Table 4). In the upper 23 cm layer this ratio was between 28.5% and 44%, which means that at least in the upper horizons the majority (55–84%) of the FISH-detectable Bacteria could be affiliated to a known phylogenetic group. In the upper part of the soil, a more diverse composition of active Bacteria than in the lower horizons was found. Two dominant groups and at least two other groups with relevant cell numbers were found in each horizon. For example, in the upper 5 cm the β-Proteobacteria group was dominant (20% of all EUB-counts could be assigned to this phylogenetic group), followed by the Cytophaga–Flavobacterium group (14%). Three other groups were found in ratios between 6% and 10%. The β-Proteobacteria and high G + C groups were the dominant throughout the soil profile. A direct comparison of the data with other studies was not possible due to the above-mentioned restriction of other FISH studies to the surface layer. Significant decrease in the diversity of the soil microbial communities with depth were also detected in other studies by using phospholipids fatty acid (PFLA) analysis or terminal restriction fragment length polymorphism (TRFLP) analysis [13,53,56]. The decrease of the amount of EUB-detected cells detectable by specific probes in depths below 23 cm suggested that a larger portion of species did not fit into the phylogenetic groups detected with our probes. However, the reason is most likely a lower activity of cells in deeper horizons and hence a lower rRNA content, which is not high enough for a detectable signal of the phylogenetic group probes. This assumption is supported by the observation that the signal intensity of the EUBmix probe decreased in deeper soil horizons.
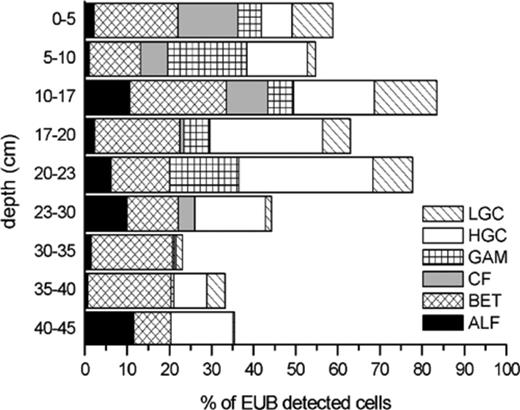
Vertical profile of probe-specific counts relative to EUB-counts (percentages) in the Typic Historthel. Probe names are abbreviations of those shown in Table 3.
The greater diversity and activity of cells in the upper horizons can be explained by higher temperatures and better substrate supply. In the upper layers the high root density may contribute, in addition to the high C content, to higher activity. While the upper 23 cm showed a high root density, only few roots were found between 23 and 35 cm, and none below 35 cm. The rhizosphere is known as a highly active soil compartment. Microbial activity and growth are stimulated through the release of compounds such as amino acids and sugars in plant root exudates [57]. Therefore microbial communities associated with the rhizosphere are often more active in relation to the microorganisms in bulk soil [58]. In addition to better substrate provision in the rhizosphere, another effect, which could influence bacterial composition in the rhizosphere, is the transport of oxygen from the atmosphere to the roots through the aerenchyma. This transport is described for many wetland plants as adaptation to anaerobic soil conditions [59–61]. At the investigated soil site the large aerenchyma of Carex aquatilis serve as pathways for gas transport [31]. The presence of oxygen in the rhizosphere could enable the existence of aerobic species in an environment, which is anaerobic on the macroscopic scale. Altogether, the decrease of temperature, aeration, and substrate supply with depth leads to reduced activity of cells and eliminates those unable to withstand these harsher conditions.
Quantification of the domain Archaea was more difficult and showed higher standard deviations than that of the domain Bacteria. This was due to a strong formation of aggregates, as shown in Fig. 3. The basic requirement for the counting method is a homogeneous distribution of cells on each well. Cell counts are illustrated in Fig. 2, but one should keep in mind the statistical problems related with these data. Most Archaea were found in the Oi-horizon between 5 and 10 cm. The number of approximately 3.0 × 10⁸ cells g−1 means that 22% of all DTAF cell counts could be assigned to the domain Archaea (Table 3). Also, the cell numbers from 10 to 23 cm were higher than in the upper 5 cm.
In the following, the cell counts retrieved by Arc915 were discussed as cell counts of methanogens. For justification, the subsamples of the upper 17 cm, where high amounts of cells were detected by probe Arc915, were additionally hybridised with probe MER 1, which is specific for 16SrRNA of methanogens [62]. Nearly the same number of cells hybridised with Arc915 as with MER1. Additionally, methane activity measurements (unpublished data) show a high methane production in the depth of 5–17 cm, where high numbers of Arc915 cells were found.
Soil depth, at which most methanogens were found, was a zone with changing oxygen conditions, which was above the water level during sampling time and not in the anaerobic zone of the profile. Oxygen content in this horizon is not optimal for methane production since methanogens are regarded as strictly anaerobic organisms [63] and can only survive in anaerobic microhabitats of this horizon. Other soil investigations also found methanogens in oxic soil horizons [64–66]. Wagner and Pfeiffer [64] demonstrated that aerobic and facultative anaerobic microflora in soil enable methane activity in the presence of oxygen in microscale anoxia. The reason why the methanogens seem to favour the upper horizons despite the suboptimal oxygen rates could be related to the better substrate provision in these horizons. The upper horizons of the Typic Historthel provide a high content of organic carbon and high cell numbers of Eubacteria, which convert high-weight macromolecules to the substrates that can be used by the methanogens. Other studies also found a strong influence of the amount [67] and the quality [68] of fresh organic carbon in soil on the amount and activity of methanogens. Despite its high amount of organic matter, nearly no Archaea were found in the uppermost 5 cm. This upper layer is less compact and therefore better vented than the layers below and did not provide enough anaerobic microhabitats.
It should be noted that soils are spatiotemporal heterogeneous environments. Therefore the results of this study reflect the situation at the sampling point in the low-centred polygon at the time of sampling. In order to draw broader conclusions about the ecological situation in low-centred polygons further samplings at different times are necessary. Due to the time-consuming analysis only one profile was examined but attention was paid to that the characteristics of this polygon were typical for the surrounding landscape. This study can thus provide only an early insight into community structure in polygonal tundra soils.
4 Conclusions
This study reveals the first analysis of the composition of an active community from tundra soil. By use of FISH we have shown that differences in soil parameters, like C content, water content, and root existence, caused differences in the composition of bacterial communities among the horizons of the Typic Historthel. For some phylogenetic groups such as the Cytophaga–Flavobacterium group, the most influential parameters were identified. Despite all differences in the requirements of the specific groups, which influence their abundances in soil, the total diversity and quantity of active cells was strongly related to the content of organic matter, an effect that was noted in soils of polygonal tundra also by other researchers [69,70]. Nevertheless, despite the harsh environmental conditions in the deeper horizons directly above the permafrost, there is evidence for high amount of cells (4 × 10⁷ cells g−1) with at least minimal activity. Even in the deeper parts of the active layer at least a minimal turnover of organic matter, by probably psychrophilic organisms, can therefore be expected.
Using the described protocol for FISH, this technique was successfully used to describe the composition of active bacterial community of arctic soil. By applying three different dyes, every positive target cell was stained at least with two different dyes, which enabled a clear discrimination between bacterial cells and non-bacterial soil particles (Fig. 4). The relatively high standard deviation of cell counts obtained for some groups is attributed to the heterogeneity of soil. However, the deviations were in the same order as in other studies of sediment [71] and soil [49]. To better resolve the effect of different community compositions on the carbon conversion, future investigations will combine community analyses with investigations of substrate conversion in different soil horizons.
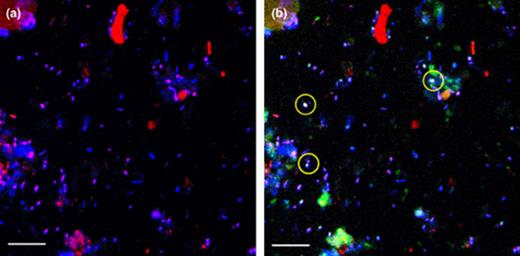
Confocal laser scanning microscope (CLSM) images showing DTAF staining and in situ hybridisation of bacteria in a soil sample from the top 5 cm. Both pictures show identical microscopic fields, displayed in different artificial colours. (a) Hybridisation with probe EUBmix-Cy5 (red), additional all cells were stained with DTAF (blue). Due to double staining the target Bacteria cells appear purple. (b) Additional hybridisation with probe CFmix-Cy3 (green). Target Cytophaga–Flavobacterium cells appear yellow, due to threefold staining. Some of them were marked with yellow circles. The scale bars represent 10 μm.
Acknowledgements
We thank the Russian–German field parties during the expedition 2001 for the enjoyable cooperation in the field. We thank Ute Bastian, Christine Flemming (Alfred Wegener Institute, Research Unit Potsdam), and Susanne Kopelke (Institute of Soil Science, University of Hamburg) for providing laboratory assistance. We also thank Dr. Otto Baumann (Department of Zoophysiology, University of Potsdam) for extensive introduction into CLSM handling and providing microscope time. Special thanks to Lars Kutzbach for many fruitful discussions and to Christian Wille for critical reading of the manuscript.
This study is part of the German–Russian project The Laptev Sea System (03G0534G), which was supported by the German Ministry of Education and Research (BMBF) and the Russian Ministry of Research and Technology.
References
