


Abstract
Virus inactivation and virus adsorption, resulting from interactions with minerals, constitute important aspects of an aquifers disinfection capacity. Investigations using a 20 cm column filled with medium-grained natural sands demonstrated that the sands can attenuate up to 62% of a pulse of viruses injected. Experiments using repeatedly washed sands had significantly lower attenuation capacity than fresh sands, due to removal of fine-grained (silt and clay-sized) coatings on grain surfaces. X-ray diffraction analyses of the sand, and the associated fine-grained coating indicated that no significant mineralogical differences existed between these two materials. The experimental data suggested that rougher surfaces/crystal edges in the grain coatings reduced repulsive forces between viruses and the sands permitting greater virus adsorption to the column matrix. Soaking all sands with Tryptone solution after testing released adsorbed viruses indicated that short-term viral inactivation due to interactions with the column matrix was a negligible part of the attenuation process.
1 Introduction
Microbiological contamination of water by bacterial, viral and protozoan pathogens constitutes a significant threat to public health. The extent of the problem was presented in 1987 United Nations Development Programme study that estimated that between three and five billon water-borne diarrhoeas occurred worldwide annually, of which five to ten million resulted in death [1]. In developed countries, strict controls on surface water quality have reduced the threat of infection from river and lake water. However, less stringent controls on groundwater quality have meant that contaminated groundwater may now constitute a greater threat to public health. Recently Macler and Merkle [2] estimated that between 750,000 and 5.9 million diseases related to microbiologically contaminated groundwater occur in the US every year. Of these contaminants, viruses have caused the greatest concern in terms of public health, largely as a consequence of their smaller size, which is suspected to result in enhanced mobility relative to larger bacteria and protozoa [2]. In the same paper, investigators also noted that the physical and chemical controls governing viral fate and transport in natural media are far from thoroughly understood [2].
Part of the reason for the lack of knowledge about the transport and attenuation of viruses in groundwater is that processes controlling viral behaviour in aquifers are complex. Viral attenuation in aquifers, relative to a similarly sized non-reactive tracer, results mainly from adsorption and inactivation [3]. Adsorption is a process by which viruses stick to aquifer surfaces, and may be either irreversible or reversible [4]. Inactivation is the process by which viruses loose their capacity to infect host cells due to disruptions in protein coating of the virus, resulting in degradation of enclosed nucleic acids [5] and may occur when viruses are suspended in liquid or adsorbed onto surfaces [6].
Both adsorption and inactivation processes can play an important role in determining an aquifers disinfection capacity. The United States Environmental Protection Agency [7] defined natural disinfection as “Source water treatment via virus attenuation by natural subsurface processes such as virus inactivation, dispersion (dilution) and irreversible sorption to aquifer framework solid surfaces”. Consequently, understanding of the processes controlling virus adsorption and inactivation can assist considerably in assessing the vulnerability of groundwater supplies to viral contamination.
Various laboratory-scale investigations have demonstrated the importance of electrostatic and hydrophobic forces in controlling virus attenuation in porous media. [4,8,9]. These studies have typically employed model systems that have used either glass beads or mono-mineral sands, and have shown that in the absence of significant quantities of organic matter, negatively charged viruses can be repulsed by negatively charged mineral surfaces, depending on the chemistry of the solution suspending the viruses [3]. Moreover, Dowd et al. [10] demonstrated that different viruses are adsorbed to variable degrees, largely as a function of their electrostatic properties.
Laboratory-scale studies investigating virus transport through natural sands are less common in the literature than studies using model systems [11–13]. This may be due in part to the fact that natural systems are compositionally more complex [14]. Many natural sands are poly-mineralic, i.e. they consist of a variety of different minerals [15]. These minerals may be present as patches on mineral surfaces, individual grains of various minerals, or mineral aggregates (rock fragments).
Elimelech et al. [17] noted that both the polarity and magnitude of the charge on a mineral surface is pH-dependant, and that the point at which there is no net charge on the surface is called the point of zero charge (PZC). In a review of viral attenuation in a number of soil types, Gerba and Bitton [5] observed that virus adsorption was greater in soils having high PZC values than those having low values, thereby providing an indication of the importance of the surface charge of different materials on viral attenuation. Consequently, different minerals may be expected to attract or repel viruses to variable degrees. Similarly, studies by Schulze-Makuch et al. [13] suggested that feldspars attracted negatively charged MS-2 viruses to a greater degree than more negatively charged quartz under acidic conditions in deionised water.
It is nonetheless noteworthy that the above virus transport investigation used sand consisting of silicate minerals. Stumm [16] noted that these minerals typically react very slowly in most groundwaters. In contrast, other rock forming minerals, most notably carbonates, are more reactive, and may more easily dissolve or precipitate within the range of chemical conditions observed in most natural groundwaters [18]. Moreover, the importance of Ca2+ as a potential determining ion that controls the surface charge of calcite has been demonstrated [19]. Indeed, Stumm and Morgan [18] observed that it is not meaningful to quote the PZC of calcite without stating the chemistry of the associated solution. Consequently, in order to investigate virus transport through aquifer materials at the laboratory scale, not only must natural deposits be used, but the chemistry of the water in contact with these deposits must resemble that of the aquifer, if appropriate attenuation mechanisms are to be identified.
Prediction of virus adsorption rates to mineral surfaces is further complicated by non-ideal collector (grain) surfaces with surface heterogeneities. These heterogeneities may arise as a consequence of imperfections on mineral surfaces that produce variations in the density and polarity of electrostatic charge [17]. These imperfections include chemical impurities, cracks, lattice defects and edge effects [21]. Jin et al. [22] highlighted the importance of these imperfections in the deposition of negatively charged φX-174 onto similarly charged Quartz Sands. Indeed, in a wider context the presence of surface charge heterogeneities is believed to be one of the reasons why theoretical predictions of particle attachment to surfaces under unfavourable (mutually repulsive) conditions is considerably greater than anticipated, even for model systems [23].
This paper investigates the viral transport through natural poly-mineralic aquifer sands at the laboratory scale and evaluates the role of the different minerals and surface charge heterogeneities present on grain surfaces in viral attenuation. The overall investigative approach involved identifying minerals present in natural sand and relating the attenuation capacity of the sand to the minerals and their distribution on grain surfaces, where they are available to interact with viruses. The relative influence of specific minerals was assessed by carrying out experiments using individual minerals, or a more limited number of minerals than present in the natural sands. All sands had the same grain size and approximately equal grain angularity. A secondary objective of this work was to determine the relative roles of short-term viral inactivation and adsorption on viral attenuation processes in the sand.
In order to achieve the above objectives, a series of column experiments were carried out in which a pulse of bacteriophage (bacterial viruses or phage), suspended in water with a similar chemistry to that sampled from the source aquifer of the sands, was injected into columns filled with different types of saturated sand, which had different mineralogies. The degree of virus attenuation could be established for different minerals by monitoring phage concentrations in the column effluent, relative to a conservative tracer. Adsorbed but still virulent phage were subsequently desorbed by soaking in a protein hydrolysate solution, Tryptone. Mass balance calculations permitted the proportions of adsorbed and inactivated viruses to be determined, based on the differences between the quantities of phage injected, and those recovered in the column effluent and by desorption.
2 Materials and methods
2.1 Porous media
The attenuation capacity of samples of the deposits underlying the Kappelen test site (Kappelen), Switzerland [24] formed the focus of this investigation. Visual inspection of the samples showed the deposits to consist of sands and gravels containing a variety of different types of rock fragments and minerals. Application of 1 N HCl to grains surfaces in the field revealed that calcium carbonate was present on a number of surfaces, including siliceous materials such as granite fragments.
Agitated, wet sieving using standard sieve sizes (DIN. ISO 3310/1) separated sand and silt/clay grain size fractions from coarser gravels in the 33 samples collected from three boreholes. The samples were subsequently rinsed in deionised water. After washing, the sands were oven-dried at 40 °C under ventilated conditions to remove moisture while preventing changes in the structure of constituent minerals, which may occur at high temperatures [25]. Microscopic examination of sand samples failed to detect staining associated with the presence of iron or manganese oxides/hydroxides on any grain surfaces examined.
Granulometric analyses of the samples collected from the three boreholes suggest that in all but one case, coarse sand to silt-sized grains (grain diameter (φ)<1 mm) make up no more than 20% of total sample mass [26,27]. Nonetheless, preliminary surface area calculations for these grain size fractions indicate that they constitute over 75% of the surface area of the samples, thereby reflecting their relative importance in adsorption processes, where available surface area dictates the degree of reaction [21]. Consequently, transport and attenuation studies focussed on phage interactions with minerals in this fine-grained fraction.
A composite sample consisting of medium-grained sand fractions (250 μm <φ< 500 μm) from the 33 borehole grab samples was mixed and used for column-scale studies. Studies using this sand type permitted the attenuation capacity of aquifer materials to be assessed and compared to other widely available sand types of similar grain size. The sands are referred to as Fresh Kappelen Sands.
In order to evaluate the influence of specific minerals on the viral adsorption capacity of the Fresh Kappelen Sands, a series of column experiments were carried out using sands consisting of individual minerals or a subset of the minerals present in the Kappelen Sands. These sands were as follows:
Quartz Sands: Medium-grained analytical grade Quartz Sand (Aldrich, Steinheim, Germany). Fresh sands were used for each experiment.
Granitic Sands: Medium-grained Granite Sand dominated by quartz and feldspars. The difference in attenuation capacity between this sand and the Quartz Sands permitted assessment of the influence of feldspars on virus attenuation. Fresh sands were used for each experiment.
Calcite Sands: Medium-grained Sands, prepared by crushing a block of pure calcite and separating the resulting 250 μm <φ< 500 μm fraction by agitated wet sieving with de-ionised water. This sand allowed the influence of pure calcite on virus attenuation to be assessed. Fresh sands were used for each experiment.
Quartz–Calcite Mixture: A mixture of the above-mentioned Quartz and Calcite Sands with the same proportion of calcite as that determined to cover grain surfaces of Fresh Kappelen Sands according to X-ray fluorescence data (see below). This sand was intended to act as a model carbonate/silicate system that could be compared with the Fresh Kappelen Sands. The same sample of sand was repeatedly used for successive experiments.
Apart from evaluating the effects of specific minerals on viral attenuation capacity of the Fresh Kappelen Sands, three separate aliquots of this sand were subjected to different treatments. These treatments permitted the assessment of the influence of changing conditions on the sands grain surfaces, during successive experiments, on its viral attenuation capacity. The sands were named according to the treatments as follows:
Reused Kappelen Sands: Three virus tracer tests carried out using the same sample of sand evaluated the effects of experimental repetition on the sands viral attenuation capacity. The sand was extruded, washed and dried at 40 °C following each experiment, before repacking and use in a subsequent tracer test. Studies using the Reused Kappelen Sand were intended for investigation of the possibility of whether deposition of viruses during previous experiments reduced the attenuation capacity of the sand in subsequent experiments due to blocking of previously available virus deposition sites on grain surfaces (Blocking).
Washed Kappelen Sands: These were treated in a similar manner to the Reused Kappelen Sands, i.e. they were packed, extruded, dried and repacked three times. However, the Washed Kappelen Sands were not exposed to viruses until they were packed in the column for the third time. By comparison with the results of experiments using the Reused Kappelen Sands, the response of the Washed Kappelen Sands permitted the effects of packing, extrusion and drying to be distinguished from blocking due to virus deposition. New Washed Kappelen Sands were used for each experiment.
Acid-digested Kappelen Sands: These sands were digested in an acid bath consisting of a 36% acetic acid solution, buffered with sodium acetate to pH 4.2, over a 10-hour period, before rinsing in deionised water and drying at 40 °C. The acid digestion process removed calcium carbonate (verified by XRD analyses) and thus permitted the influence of this material on attenuation to be assessed by comparing virus recoveries with those from experiments using the Fresh Kappelen Sands and the Washed Kappelen Sands. The same sands were used for successive experiments.
2.2 X-ray diffraction mineralogical analyses
X-ray diffraction (XRD) analyses using a SCINTAG XRD 2000 diffractometer identified the major minerals constituting the undigested and Acid-digested Kappelen Sands. Additional analyses of the silt/clay (<63 μm) fractions were carried out to determine whether the mineralogy of the fine-grained material noted on grain surfaces during preliminary examinations of the aquifer material, differed from that of the bulk mineralogy of the sands used in column testing.
Sample preparation and semi-quantitative analyses of the bulk mineralogy of each of the natural poly-mineralic porous medium followed the procedure described by Adatte et al. [28]. Final composition quantification using external standards generally provides an error varying between 5% and 10% for the phyllosilicates and 5% for other minerals.
2.3 Scanning electron microscopy X-ray fluorescence analysis
Scanning electron microscopy of uncoated sand samples using a Philips XL-30 environmental scanning electron microscope (ESEM) at 25 kV allowed high-resolution visual inspection of surface conditions on the mineral grains of the various porous media to be studied. Additional analyses using the ESEMs EDAX ZAF X-ray fluorescence (XRF) probe allowed semi-quantitative estimation of the proportions of various metals and silicon using a 50 μm × 50 μm window focused on randomly selected grain surfaces to be ascertained to ±5%. XRF analyses of the surfaces were compared with model mineral compositions to provide an indication of the relative proportions of various minerals present on grain surfaces.
2.4 Organic carbon analyses
Organic carbon analyses by Rock Eval 6 pyrolysis determined the weight percentage of organic carbon in eight Fresh Kappelen Sand samples and four Acid-digested Kappelen Sand samples. This method has a detection limit of 0.1% organic carbon. Further details of this analytical method are contained in Disnar et al. [29].
2.5 Virus tracer
The marine bacteriophage H40/1 acted as the virus tracer for all column test experiments. The phage is a host-specific non-pathogenic B1 type marine bacterial virus (Siphoviridae) hosted by the marine bacterium Pseudoalteromonas gracilis[30]. Marine bacteriophages, such as H40/1 and their hosts are naturally absent from groundwater systems [31].
Measurements by Rossi [32] using transmission electron microscopy showed that H40/1 has a capsid that is 39 nm in diameter and a 46 nm tail. Hydrophobicity measurements made using a contact angle goniometer microscope, carried out in the framework of the current research program, indicated that H40/1 was hydrophilic (contact angle: 52°± 1°, n= 6). Similarly, measurements of the electrophoretic mobility of this phage in the synthetic freshwater (SF) used in the experiments indicated that the H40/1 had a strong negative charge at the ambient experimental pH. (ζ-potential H40/1 =−23.5 ± 2.5 mV, n= 6 for each measurement made at pH 7.1, 7.4, 7.5, 8.0). Moreover, similar measurements down to pH 5.6 provided the same value within error (26.9 ± 2.5 mV), thereby indicating that H40/1s isoelectric point in SF is less than 5.6.
Prior to starting the experiments, phage production was carried out on petri dishes using seawater agar (SWA) following the procedure used by Rossi [32]. The surface of double agar layer of petri dishes with confluent lysis was scraped, mixed in a small volume of saline buffer (0.9 g/l NaCl, Trishydroxymethylaminomethane (Tris)-HCl, pH 7.5) and centrifuged (15 min, 12,000g) so as to remove bacterial cells and agar debris. The supernatant acted as the virus stock (source concentrate) and was stored at 4 °C to minimize viral inactivation throughout the whole set of experiments.
2.6 Synthetic freshwater/solute tracer
A synthetic freshwater consisting of 8 mg/l of KCl, 62 mg/l of MgSO4· 7H2O, 294 mg/l of CaCl2· 7H2O, and 21 mg/l of NaHCO3 dissolved in Nanopure© water (Barnsted, Dubuque, IA) (resistivity-18.1 MΩ cm) acted as the tracer solvent/suspending liquid and flushwater for the column experiments. The water was buffered with 1.8 ml/l of 1 M Tris (C4H11NO3) (Fluka, Buchs, Switzerland) and adjusted with 1 N HCl to pH 8.0 (±0.1). Schijven et al. [33] indicated that concentrations of polyvalent cations can be crucial in determining the degree of virus adsorption occurring under unfavourable deposition conditions. Consequently, the bivalent cation concentrations of the synthetic freshwater resembled those of groundwater samples collected from Kappelen, while the pH was approximately 1 unit higher than that observed at the site [28] to prevent excessive carbonate dissolution of the column matrix.
Saturation calculations using the hydrochemical model Phreeq [34] demonstrated that the water was slightly undersaturated with respect to calcite (calcite saturation index =−0.4). By using slightly undersaturated water, crystal precipitation, that may change H40/1 transport conditions in the column through virus adsorption to newly precipitated minerals, was avoided. Such facilitated transport has been noted to occur between viruses and other inorganic minerals in groundwater systems [35].
A 100 ppb solution of uranine, (sodium fluorescein, Fluka, Buchs, Switzerland) acted as the solute tracer. Käss [36] summarised studies indicating that uranine is pH sensitive and photo-degrades in strong light but otherwise undergoes little to no interaction with inorganic materials.
Before mixing with H40/1, the SF and tracer reservoirs were agitated with Teflon-coated magnetic stirrer under a vacuum of −70 mm Hg for 15 min prior to all experiments to remove dissolved gases, which could exsolve in the column. At the start of an experiment, phage stock, diluted in 9 μl of saline buffer was added to the 100 ml tracer reservoir containing uranine. The tracer mixture was homogenised by magnetic stirring to give a stock concentration of 400 plaque-forming units per ml (pfu/ml). Source samples were collected from the tracer reservoir immediately after mixing and at half-hourly intervals until the end of the experiment. Analyses of these samples permitted virus source concentration variation in the tracer reservoir to be determined with time and thus the H40/1 inactivation rates in liquid not interacting with the column matrix could be evaluated. The tracer reservoir was stored at room temperature throughout all experiments (21–24 °C)
2.7 Column experiment procedure
Fig. 1 illustrates the operation of the column apparatus used in the tracer experiments. Prior to each experiment, the 20 cm long × 2 cm internal diameter borosilicate glass column was packed with sands in 1 cm increments by pouring them into degassed synthetic freshwater 3 cm or less. Packing the column matrix using the tap and fill method [8] using a 1 cm diameter solid glass rod, reduced the possibility of grain bridging and the development of preferential flow paths. A notable increase in turbidity was apparent in the water column when packing Fresh Kappelen Sands, Reused Kappelen Sands and sands containing calcite. This turbidity quickly disappeared with subsequent flushing. Porosities during all experiments were 43%± 3.5%.
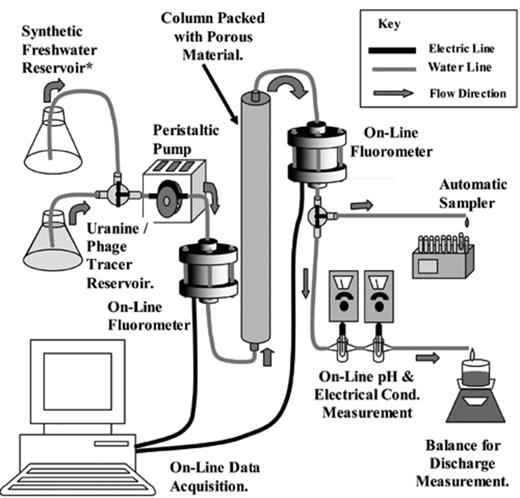
Schematic illustration of column apparatus used in bacteriophage tracer test experiments.
All column experiments lasted 3 hours. Triplicate experiments provided an indication of the variation in experiment results. At the end of each experiment, sands were washed in de-ionised water and oven-dried at 40 °C in a ventilated atmosphere. A peristaltic pump (Ismatec IP-15, Glattbrugg, Switzerland), connected to the column by 3 mm ID silicone tubing, pumped water/tracer through the column at an approach velocity of 6.9 × 10⁻⁴ m/s, (± 1.1 × 10⁻⁴ m/s between experiments). At least 15 pore volumes of tracer-free synthetic freshwater passed through the column prior to tracer injection to permit chemical equilibration. Tracer test experiments consisted of injecting a short pulse (approximately 0.5 pore volumes) of the H40/1/ uranine tracer mixture into an actively pumping tracer-free system, followed by an additional eight pore volumes of tracer-free flush water. Kretzschmar et al. found excellent agreement between this short-pulse technique and the more commonly used step-pulsed technique, where tracers are injected over a prolonged period in studies using inorganic colloids [37]. Moreover, preliminary column experiments investigating the H40/1 attenuation capacity of Kappelen Sands compared the short pulse method with the step method and found that recoveries using each method varied by ± 3%.
On-line fluorometers monitored solute tracer concentrations in column influent and effluent water at 10 s intervals and could detect uranine at concentrations as low as 0.1 ppb [38]. Regular on-line measurements of pH and conductivity during the experiments confirmed that hydrochemical conditions remained constant during all tracer tests. An automatic sampler continuously collected column effluent samples for bacteriophage analyses at 0.1 pore volume intervals. All experiments were completed at between 21 and 24 °C.
H40/1 concentrations in tracer reservoir samples, and samples collected using the automatic sampler, were assayed using an optimized double agar layer technique [32] on seawater agar medium. Rossi found the detection limit using this method to be less than 1 pfu/ml [32]. The results of duplicate analyses for each sample were quantified the day after cultivation, by direct counting.
2.8 Miscible extrusion
Upon completion of experiments, column matrix extrusion was carried out using a 50 ml syringe filled with synthetic flushwater. The syringe was connected to the influent side of the inverted sand column and the hydraulic pressure applied by the syringe allowed intact column matrix to be extruded and sampled with a high degree of control. Sand samples, weighing approximately 1 g were collected at three cm intervals along the column length, placed into a 20 ml bath of dilute Tryptone (5 g/l Fluka, Buchs, Switzerland) and agitated for 15 min at 100 rpm using a rotating agitator. Subsequent sampling and viral assays were carried out in an analogous manner to those of column effluent samples. The assays allowed phage concentrations in the supernatant to be ascertained and related to the dry weight of sand in the sample. Double analyses of duplicate aliquots from each interval allowed sample variability to be assessed.
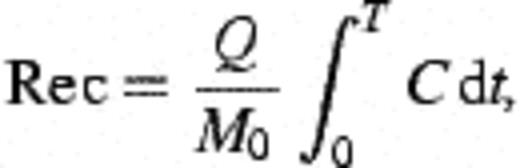
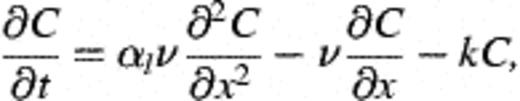
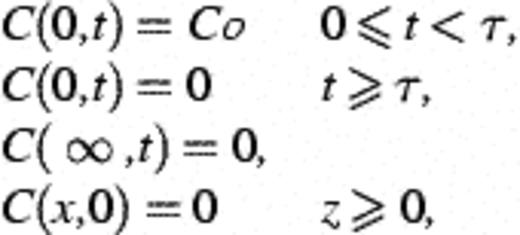
2.9 Calculation of recovery, deposition constants, and collision efficiency
3 Results
3.1 X-ray analyses
Table 1 presents the results of XRD measurements made on the medium sand and the silt/clay sized mineral fractions separated by sieving 33 samples of Kappelen Aquifer sand and gravel. The results indicate that both size fractions contain the same major minerals, although the proportion of calcite is higher in the finer-grained fraction, whereas quartz is more abundant in the sand. The standard deviation of the both minerals ranges between 18% and 29% of the average content, calculated for the two grain-size fractions.
Summary of mineralogical analyses of medium sand and silt/clay sized fractions by XRD, Kappelen Test Site, Switzerland
| Size fraction | Calcite | Quartz | K Feldspar | Na Feldspar | Dolomite | Sheet silicates | Residual minerals |
| φ<63 μm | |||||||
| Mean | 40 | 27 | 3 | 6 | 4 | 6 | 15 |
| Standard deviation | 10 | 5 | 2 | 2 | 4 | 2 | 12 |
| <250 μm <φ<500 μm | |||||||
| Mean | 28 | 39 | 6 | 9 | 1 | 3 | 14 |
| Standard deviation | 8 | 8 | 4 | 4 | 0 | 1 | 13 |
See Table 2 for mineral formulae. Proportions of minerals making up less than 3% of bulk mineralogy incorporated into residual minerals. Sample size n= 33 for each fraction. (φ= grain diameter).
Comparative results for XRD and XRF analyses summarising the bulk mineralogy, and mineralogy of grain surfaces, of the composite sand sample used in column testing are presented in Table 2. The results are comparable to the average values obtained for individual sample analyses presented in Table 1± one standard deviation, thus indicating that the composite samples were representative of the average mineralogy of the Kappelen Aquifer sands. Framework silicates (quartz and feldspars) dominate the Kappelen sands composition (59% of the bulk mineralogy), although calcite is also present in significant quantities (20% of bulk mineralogy). The term “residual minerals” provided by XRD analyses in both Tables 1 and 2 refers to minerals present in the samples that could not be identified because they have variable lattice spacings, due to phenomena such as solid solution series, or were identified but made up less than 3% of the bulk mineralogy in all sand types investigated. In deposits sampled from the Kappelen area, residual minerals are typically dominated by unidentifiable sheet silicates (T. Adatte, personal communication)
Compositions of Granitic Sand, Fresh Kappelen Sands and Acid-digested Kappelen Sands determined using semi-quantitative XRD and XRF analyses
| Mineral/sand type | Fresh Kappelen Sands (%) | Digested Kappelen Sands (%) | Granitic Sands (%) | |||
| XRF | XRD | XRF | XRD | XRF | XRD | |
| Quartz – SiO2 | 46 | 45 | 50 | 49 | 33 | 37 |
| K Feldspar – KalSi3O8 | 0 | 4 | 7 | 12 | 37 | 14 |
| Albite – NaAlSi3O8 | 16 | 10 | 23 | 12 | 17 | 27 |
| Calcite CaCO3 | 28 | 20 | 0 | 0 | 0 | 1 |
| Dolomite – CaMg(CO3)2 | 2 | 0 | 0 | 0 | 0 | 0 |
| Sheet silicatesa | 9 | 3 | 20 | 4 | 13 | 5 |
| Residual mineralsa | 18 | 24 | 15 | |||
| Percentage of grains partially covered with iron oxide coating and/or ankerite Ca(Fe, Mg)(CO3)2 | 2 | 1 | 1 | |||
XRD results provide bulk mineralogical compositions. XRF analyses provide mineralogy of grain surfaces.
aX-ray diffraction analysis considers muscovite as the only sheet silicate mineral present in a sample. Other sheet silicates are included as residual minerals. X-ray fluorescence data identify sheet silicates based on model compositions and potential solid solution series substitutions. These minerals include end-members such as muscovite (KAl2(AlSi3)O10(OH)2), biotite (K(Mg, Fe)3(Al, Fe)Si3O10(OH, F)2) and chlorite (Mg5Al(AlSi3O10)(OH)8). Limit of resolution of apparatus is 1% of surface area.
XRF analysis of Fresh Kappelen Sand grain surfaces indicates that the same minerals detected by XRD occur on the sand grain surfaces in similar proportions, although calcite appears to be more abundant to the detriment of sheet silicates. Significantly, analyses of surfaces containing measurable quantities of iron are normally associated with aluminium and silicon, in consistent proportions comparable to those observed in minerals such as biotite (K(Mg, Fe)3(Al, Fe)Si3O10(OH, F)2) suggesting that most of the iron present occurs in sheet silicates rather than as iron oxides/hydroxides. Indeed, the amount of iron oxides/hydroxides on grain surfaces was indistinguishable from that of ankerite (Ca(Fe, Mg)(CO3)2) in many samples analysed by XRF. Both carbonates and oxides containing iron were detected in XRD analyses of Kappelen sand and silt/clay samples at between 1% and 2% of bulk mineralogy. This indicates that the deposits may contain 1% or less of iron oxides/hydroxides on grain surfaces. No manganese oxides were detected in XRD or XRF analyses of samples.
The results of the X-ray analyses are consistent with visual observations made in the field, and studies of the sand under the microscope, where no iron or manganese staining was apparent on grain surfaces. Moreover, the mineralogical interpretation of the results of the XRF analyses corroborates the idea that the residual mineral fraction, quantified by XRD, is dominated by sheet silicates. Furthermore, the results of the mineralogical analysis are consistent with the composition of the source rocks present in the fluvioglacial aquifers catchment [41].
3.2 Scanning electron microscopy
The images of Undigested Kappelen Sands such as that presented in Fig. 2(a) demonstrate that the grains of the Fresh Kappelen Sands grains have coatings of finer grained material partially covering their surfaces. Similar coatings were apparent on fresh calcite grains (Fig. 2(c) and (d)), but were less abundant on repeatedly used calcite grains, and particularly on Washed Kappelen Sands. Moreover, the coatings were not apparent on samples of granite sand and Acid-digested Kappelen Sand studied (Fig. 2(b) and (e)), although certain grains in the later material did show signs of corrosion (Fig. 2(f)). No corroded grains were apparent in the sample of Fresh Kappelen Sand.
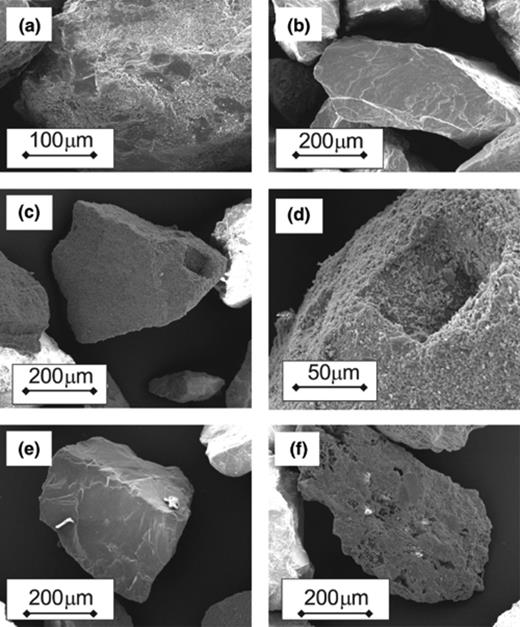
Scanning electron microscope photographs of investigated granular media. (a) Fresh Kappelen Sands showing fine-grained material on smooth grain surface. (b) Granitic sand; note smooth grain surface. (c) Calcite Sand; note pit on right hand side of the grain. (d) Detail of the pit on Calcite Sand grain in (c) showing fine-grained sized material on surface. (e) Sand grain from Acid-digested Kappelen Sands. (f) Corroded sand grain from Acid-digested Kappelen Sands; such grains were not observed in undigested sands.
The SEM images of the Fresh Kappelen Sands are consistent with the grains being coated in fine calcium carbonate bearing material, as deduced from testing surfaces with 1 N HCl in the field. The images suggest that these coatings were removed by repeated soaking and rinsing and/or by the acid digestion process.
3.3 Organic carbon analyses
Organic carbon analyses of both Undigested Kappelen Sands and Acid-digested Kappelen Sands failed to detect organic carbon above the analytical detection limit of 0.1% organic carbon.
3.4 Column experiment results
Fig. 3 shows representative breakthrough curves for the Kappelen sands and mono-mineralic sands investigated by column testing (i.e. the figure presents breakthrough curves for experiments with median H40/1 response, for the three repetitions using each sand type). The response in the Granitic Sand is not presented but resembles that of the Quartz Sand. The results of both of the duplicate analyses for each sample analysed for H40/1 content are presented in the figure. The results of individual bacteriophage assays do not vary by more than ±25% from their average value. This variability is also applicable for the results of experiments using the granitic sands and the quartz/calcite mixture, as well as for analyses of samples collected during miscible extrusion experiments following selected experiments.
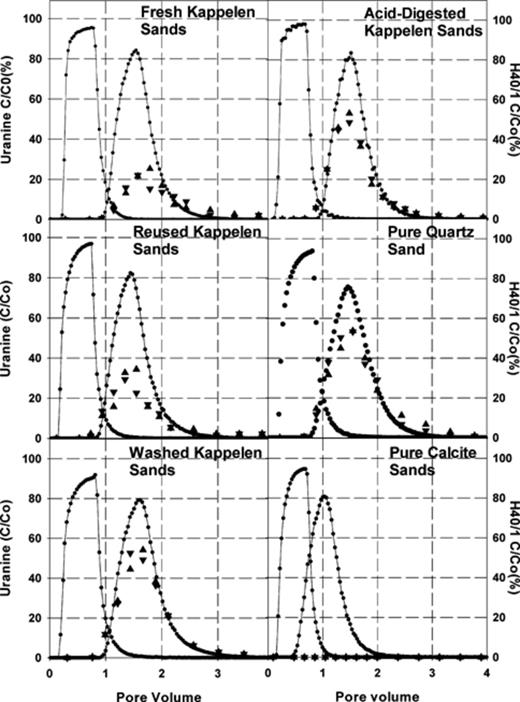
Representative uranine and H40/1 bacteriophage breakthrough curves for the investigated sand types (quartz/calcite mixture and Granite Sands omitted). Solid lines represent uranine breakthrough curves. Triangles represent H40/1 bacteriophage concentrations. All concentrations are relative to those in the tracer reservoir.
H40/1 recoveries and subsequent derived parameters are presented for each sand investigated in Table 3. Recoveries are greatest for Quartz Sand and Granitic Sand, with up to 98% of H40/1 injected recovered in column effluent (91%± 7%) for the Quartz Sand. Similarly high recoveries are apparent for the Granitic Sands, where recoveries of up to 98% were observed (92%± 6%). The results contrast strongly with recoveries obtained in experiments using pure Calcite Sands, where no phage were observed in the column effluent. Recoveries using Fresh Kappelen Sands were 39%± 1%.
Summary of test results/deposition values for various investigated porous media
| Matrix | Experiment no. | H40/1 recovery (%) | Effective porosity (%) | k (1/s) × 10−3 | Vel (m/s) × 10−4 | Collision efficiency × 10−2 |
| Fresh | 1 | 38 | 41 | 3.4 | 6.8 | 3.50 |
| Kappelen | 2 | 38 | 43 | 2.8 | 7.3 | 3.20 |
| Sandsa | 3b | 40 | 40 | 3.3 | 7.0 | 3.20 |
| Reused | 1b | 40 | 40 | 3.3 | 7.0 | 3.20 |
| Kappelen | 2 | 53 | 41 | 2.3 | 7.0 | 2.30 |
| Sands | 3 | 60 | 36 | 2.0 | 7.8 | 1.50 |
| 4 | 86 | 42 | 0.5 | 6.7 | 0.54 | |
| Washed | 1 | 81 | 38 | 0.8 | 7.7 | 6.80 |
| Kappelen | 2 | 92 | 37 | 0.3 | 7.7 | 0.25 |
| Sandsa | 3 | 89 | 36 | 0.4 | 7.7 | 0.29 |
| Digested | 1 | 75 | 37 | 0.9 | 6.0 | 1.30 |
| Kappelen | 2 | 75 | 38 | 0.9 | 5.9 | 1.30 |
| Sands | 3 | 72 | 42 | 1.1 | 6.8 | 1.20 |
| Quartza | 1 | 93 | 41 | 0.2 | 5.8 | 0.23 |
| 2 | 84 | 42 | 0.6 | 7.0 | 0.63 | |
| 3 | 98 | 40 | 0.1 | 7.1 | 0.07 | |
| Calcitea | 1 | 0 | 41 | n/a | 7.2 | n/a |
| 2 | 0 | 43 | n/a | 6.7 | n/a | |
| 3 | 0 | 41 | n/a | 7.2 | n/a | |
| 40% Calcite | 1 | 5 | 40 | 11.0 | 4.8 | 11.00 |
| 60% Quartz | 2 | 11 | 40 | 8.1 | 4.7 | 7.60 |
| 3 | 60 | 35 | 2.1 | 5.0 | 1.50 | |
| Granitic | 1 | 93 | 43 | 0.2 | 6.6 | 0.28 |
| Sandsa | 2 | 86 | 44 | 0.5 | 6.5 | 0.61 |
| 3 | 98 | 43 | 0.1 | 6.7 | 0.08 |
aFresh sand used for each experiment.
bSample #3 reused as Sample #1 for Reused Kappelen Sands experiments.
Despite the absence of calcite, the Acid-digested Kappelen Sands have a significant attenuation capacity, which remained consistent with repeated use of the sand (recovery 73%± 2%). The consistent relative recoveries observed with the Acid-digested Kappelen Sands contrast strongly with the variation in relative recovery observed with the Reused Kappelen Sands (40–80%). Indeed, relative recoveries observed in the first experiment using these sands are less than half of those observed from the third experiment using the same material. The recoveries from this final experiment using the Reused Kappelen Sands are comparable to those observed from experiments using the Washed Kappelen Sands, where recoveries were 86.5%± 5.5%. The tendency of increasing recovery with reuse, observed in the Reused Kappelen Sands, was also apparent in the quartz/calcite mixture. In this case, the increase in recovery is even more dramatic, ranging from 5% recovery in the first experiment to 60% recovery in the third experiment using the same sand (32.5%± 27.5%). Clearly there was an additional process operating on both the Reused Kappelen Sands and quartz/calcite mixture, which caused much greater variability in recovery relative to the other sand types.
Accounting for variations in flow velocity and porosity, the collision efficiencies derived from the recovery data using Eqs. (2) and (3) better reflect the attractive properties of the various sands to colliding H40/1. Despite the slight variations in the flow regime and porosity between experiments, the tendency for the Fresh Kappelen Sands to act as attractive surfaces for H40/1 deposition is apparent in its higher collision efficiency values relative to the other natural sand types (α-Fresh Kappelen Sands: 0.032–0.035). Moreover, the increasing recoveries observed in the Reused Kappelen Sands and in the quartz/calcite mixture are reflected in declining values of collision efficiency by approximately order of magnitude, from 0.032 to 0.0054 in the case of the Reused Kappelen Sands, and 0.11–0.015 in the case of the quartz/calcite mixture. Indeed the α value determined from the final experiment using the Reused Kappelen Sands resembles that of the washed sands (0.0025–0.0068).
No significant decline in H40/1 concentration in the tracer source reservoirs over the duration of the experiments was observed. This suggests that inactivation of suspended H40/1 in the tracer reservoir over the duration of the experimental period was insignificant.
3.5 Extrusion experiments
Fig. 4 summarises the results of the extrusion experiments for each sand type investigated, apart from the Granitic Sand, which could not be studied due to insufficient materials. The results confirmed that all sands contained adsorbed, yet still virulent phage at the end of each experiment. The proportion of adsorbed yet still virulent phage detected in the extrusion process ranged from less than 2% for the Quartz Sand to 100% for the pure Calcite Sand. Moreover, when the numbers of viruses recovered in the extrusion were considered in conjunction with those collected in the column effluent, it is apparent that the number of viruses recovered is equal to the number injected within the range of experimental error (±5%).
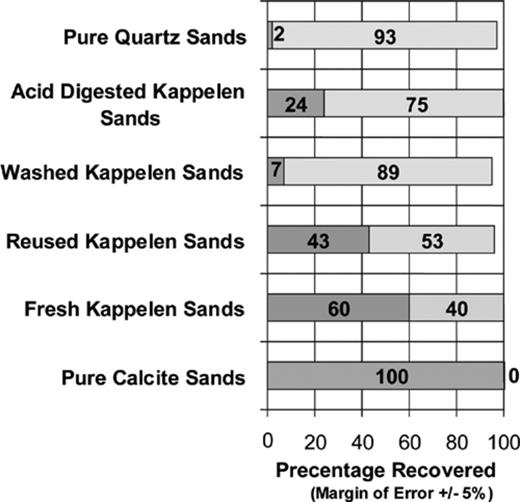
Relative proportions of H40/1 adsorbed on column mMatrix (dark grey) and recovered in column effluent (white) in experiments using natural sands. (Figures represent percentages of injected H40/1 present in sorbed and effluent fractions).
4 Discussion
The results of X-ray analyses demonstrate that framework silicates and calcite dominate both the medium-sand fraction and fine-grained (silt/clay) size fraction that partially coat the Kappelen sands, although significant proportions of sheet silicates are present in both materials. On the other hand, X-ray analyses suggest that the minerals frequently cited to explain bacteriophage adsorption, namely iron and manganese oxides and hydroxides [11,42], were present in insignificant quantities in the investigated samples. Consequently, these minerals are not suspected to be responsible for the high levels of viral attenuation in the Kappelen sands.
Miscible extrusion test data indicate that Tryptone solution was capable of desorbing H40/1 from all sand types investigated. The mass of viruses released using the miscible extrusion method varied for the different sands studies. However, the total recovery of the mass of H40/1 injected, observed when the mass in the effluent is combined with the mass obtained by extrusion, indicates that none of the minerals present in the Kappelen sands have caused viral inactivation due to adsorption over the 3 hour duration of each experiment. Consequently, all phage on mineral surfaces maintain their virulence over this period, despite being adsorbed.
Recoveries of H40/1 observed in the column effluent in tests using individual minerals, or using a subset of the minerals present in the Kappelen sands, provide an insight into the roles of various surfaces in the attenuation process. The high recoveries observed in experiments using Quartz Sand indicate that this mineral has a very low capacity to adsorb H40/1. Moreover, high relative virus recoveries obtained with Granitic Sands indicate that the additional minerals in this material, notably feldspars (over 51%, according to XRF analyses) and sheet silicates (13%– XRF data) did not have an H40/1 attenuation capacity significantly greater than quartz under the experimental conditions. Similar results were noted by Schulze–Makuch et al. [13] in MS-2 mass transport experiments through quartz- and feldspar-dominated sand at pH 8.1 using deionised water.
In contrast to the silicate minerals, the absence of H40/1 in the effluent of columns filled with Calcite Sands suggest that calcite is responsible for the high degrees of H40/1 attenuation observed in the Kappelen sands. However, the successively greater relative recoveries of H40/1 and declining collision efficiencies observed using the quartz/calcite mixture suggest that the attenuation capacity of the mineral is more limited than the results of the experiments carried out using pure fresh calcite would initially suggest.
A comparable increase in relative recovery and decline in collision efficiency in successive experiments was also noted with the reused Kappelen sands, suggesting that a similar process was operating. A consistent rise in recovery, and concomitant decline in collision efficiency is often observed where deposition sites are limited and colloidal blocking occurs [22]. However, the recovery observed in the final experiment with the Reused Kappelen Sand is comparable to recoveries noted with Washed Kappelen Sands that had not been exposed to H40/1 prior to experimentation. This suggests that blocking may not be responsible for the declining attenuation capacity of the Reused Kappelen Sands with reuse. In fact, if blocking were responsible, a low recovery/high collision efficiency would be anticipated in the Washed Kappelen Sands. This is not observed and thus suggests that sand soaking/rinsing process is responsible for the decline in the Reused Kappelen Sand H40/1 attenuation capacity.
Relative recoveries of the Washed Kappelen Sands resemble those observed in Quartz Sands and Granitic Sands, despite their calcite content. (A calcite content of 25% wt/wt in the Washed Kappelen Sands was confirmed by XRD at the end of the column experiment program.) These high recoveries obtained with Washed Kappelen Sands, suggest that calcite has a low attenuation capacity under ambient experimental conditions.
The apparently contradictory results regarding the contribution of calcite to virus attenuation gained from the column experiments with Washed Kappelen Sands, compared to those of the Calcite Sands, can be explained by considering conditions on the surfaces of the sand grains. Investigations using scanning electron microscopy revealed the presence of fine-grained silt and clay sized particles on the surface of Fresh Kappelen Sands and the Calcite Sands. These fine-grained coatings were subsequently removed during either the acid digestion and/or washing. This conclusion corroborates with observations made while packing columns, where silt and clay sized material was removed in suspension. The silt/clay-sized coating on the surface of the Fresh Kappelen Sand has similar bulk mineralogy to that of the sand grains. These observations, coupled with low H40/1 recoveries obtained in column experiments using coated sands, suggest that sands with a fine-grained coating can adsorb H40/1 better than the uncoated sands, despite their equivalent mineralogy.
Elimelech and O'Melia [43] argued that protrusions on otherwise smooth surfaces can significantly reduce repulsive forces between colloidal particles and collector surfaces under unfavourable deposition conditions. Similarly, Ross and Olivier noted that edge effects can be one of the principal causes of charge heterogeneity that may reduce, if not reverse, the polarity of surface charge density [21]. Such conditions could permit the negatively charged bacteriophage to approach otherwise repulsive surfaces and allow adsorption, especially if the edges of the crystals are oppositely charged. Moreover, work by Bickmore et al. [44] using atomic force microscopy showed that crystal edge surface area may occupy up to 30% of the total surface area in a sample of clay-sized material. As a consequence, depending on the charges on the edges of the crystals and surface roughness, significant differences in interaction forces could thus be anticipated for a collector covered in a fine-grained material, relative to a smooth surface with the equivalent composition.
The results of column experiments with Fresh Kappelen Sands, and of experiments with Calcite Sands, suggest that the fine-grained material on the sand surfaces reduces the overall repulsive charge of sand grains sufficiently to permit adsorption of negatively charged H40/1 particles to surfaces that would otherwise be repulsive. The removal of these coatings by washing results in less surface roughness/charge heterogeneity on grain surfaces and makes the grains more repulsive to approaching viruses. This reduces the degree of H40/1 adsorption. The net result of this change in surface conditions is that an increased recovery of H40/1 is observed in the column effluent.
A similar phenomenon is apparent for the quartz–calcite mixture where the fraction of the sand surface covered in favourable deposition sites declines from 10% to 1% between experiments #1 and #3, according to Eq. (4). In the case of both the Calcite Sands, and the Kappelen sand grain SEM photographs suggest that the proportion of grains covered with coatings is greater that that calculated. This suggests that the assumption that the coating has a collision efficiency of unity, may be an overestimation of the true value of the fine-grained coatings on the grains, and that a lower value αpatch value may be more appropriate to express the influence of the grain coatings on H40/1 attenuation.
Microtextural effects are also believed to be responsible for the greater bacteriophage adsorption observed in Acid-digested Kappelen Sands, compared to Washed Kappelen Sands, despite the absence of silt/clay coatings on the acid-digested sand surfaces. The results of column tests using the Washed Kappelen Sands indicate that sand grains contained sheet silicates that did not attract H40/1. However, the acid digestion process is believed to have removed calcium carbonate and/or trace amounts (less than 0.1%) of organic matter that may be present between the layers of sheet silicate minerals [45], exposed on grain surfaces. Relative recovery data from Washed Kappelen Sands indicate that neither calcium carbonate nor possible trace organic matter appear to have provided an attractive deposition sites for the negatively charged hydrophilic bacteriophage, H40/1. However, removal of these surfaces by digestion is suspected to have exposed a number of additional adsorption sites, which permitted greater H40/1 adsorption to the column matrix and thus increased the bacteriophage attenuation capacity of the Acid-digested Kappelen Sands, relative to the Washed Kappelen Sands. Consequently, the attenuation capacity of the Acid-digested Kappelen Sands is believed to be an artefact generated by the acid-digestion process, and is not applicable to attenuation mechanisms operating in the field.
The results of this study further highlight the influence of irregularities on collector surfaces in colloid/virus transport noted by other authors [11,17,20,22,46], by thus further emphasising the importance of grain roughness/crystal edge effects on virus adsorption. Indeed the results indicate that significant differences in the prediction of attenuation capacity in aquifers may arise from using idealized surfaces, including smooth mineral grains, which may have the same mineralogy as the aquifer matrix. Failure to consider such phenomena may partially explain discrepancies between field-based results and those of laboratory studies investigating bacteriophage migration, as noted by Schijven and Hassanizadeh [3]. Nonetheless, the importance of laboratory techniques has been demonstrated in this study, both in demonstrating the importance of grain microtexture in viral attenuation as well as in showing that, despite the significant adsorption of phage H40/1 occurring on the Kappelen Sands, adsorbed bacteriophage retain their infective capacity over the duration of the experimental period.
Acknowledgements
This research was funded by the Swiss National Science Foundation (Grant Number: FN-20–061370.00). The Mineralogy Group at Geological Institute of the University of Neuchâtel completed X-ray diffraction analyses. X-ray fluroesence analyses were completed at the Swiss Centre for Electronics and Microtechnology, Neuchâtel, Switzerland. The authors wish to thank Mrs. Magali Grob for carrying out the bacteriophage analyses.
References
