


Abstract
Vertical changes in archaeal community structure in mesophilic freshwater lake sediment were investigated using denaturing gradient gel electrophoresis of amplified 16S rRNA genes and reversely transcribed 16S rRNA fragments. Electrophoretic band pattern of archaeal community did not drastically change with depth. The archaeal 16S rRNA-based denaturing gradient gel electrophoresis band pattern was very similar to the 16S rDNA-based pattern. These results indicate that archaeal community structure does not drastically change throughout the 0–20 cm in depth, and most archaeal populations in the sediment retain extractable rRNA. Phylogenetic analysis of seven sequences retrieved from both DNA- and RNA-based denaturing gradient gel electrophoresis revealed that these sequences were divided into four major lineages; the kingdom Crenarchaeota, the order Methanomicrobiales, the family Methanosaetaceae, and an uncultured cluster within Euryarchaeota. The order Methanomicrobiales and the family Methanosaetaceae were the dominant methane-producing archaea in this profundal freshwater lake sediment. Moreover, we found Euryarchaeota that are not related to methanogens, and non-thermophilic Crenarchaeota. This suggests that archaeal populations other than methanogens in low-temperature sediment have been previously underestimated.
1 Introduction
Aquatic sediments are important sites for anaerobic mineralization of organic matter [1]. In sediments, a vertically structured ecosystem is formed according to the efficiency of the energy metabolisms of organisms. The depth-related changes in anaerobic metabolisms and microbial diversities have been intensively studied [2–7]. In particular, sulfate reduction and methanogenesis are recognized as key terminal processes. In freshwater lake sediment, methanogenesis is dominant due to limited sulfate available as electron acceptor. Methanogenesis is carried out by metabolically different (hydrogenotrophic and aceticlastic) methane-producing archaea, which are exclusively affiliated with the domain Archaea. Although the diversity of Archaea in natural environments has been intensively studied using culture-independent approaches (rice paddy soil [8]; sediment [9–14]), fewer studies have been carried out to elucidate the depth-related change of archaeal communities in sediments [3,6,14].
We investigated vertical distributions of methane-producing archaea in the profundal sediment of Lake Biwa using quantitative membrane hybridization with previously designed probes [6]. 16S rRNA of the family Metanosaetaceae (probe Msae825) and the order Methanomicrobiales (probe Mmic1200) were most abundant methane-producing archaea (MPA) among total archaeal 16S rRNA (probe Arch915) in the sediment, accounting for 8.1–14.5% and 10.1–19.8%, respectively. Thus, the sum of MPA (probes Msae825 and Mmic1200 together) accounted for approximately 20–30% of all archaeal 16S rRNA (probe Arch915). This indicates that other kinds of Archaea possibly exist but could not be recognized by these probes. Furthermore, members of Euryarchaeota unrelated to MPA [10,12] and non-thermophilic Crenarchaeota [15–17] have been recently reported in freshwater sediments. Thus, these microorganisms might also account for the rest of the archaeal community.
In this study, we used denaturing gradient gel electrophoresis (DGGE) of PCR amplified 16S rRNA gene fragments to determine which archaea were present in the profundal sediment of freshwater Lake Biwa and how the whole archaeal community changed with depth. We also compared the DGGE profiles of amplified 16S rDNA with DGGE of reversely transcribed (RT) 16S rRNA fragments to reveal the structural differences between the whole and active archaeal communities in the sediment.
2 Materials and methods
2.1 Sample collection and measurements of methane production and sulfate reduction rates
Sediment samples were collected at a site of 90 m water depth (35° 23.4′N, 136° 7.7′E) in northern Lake Biwa by R/V Hakken-gou on 22 November 2001. The northern basin of Lake Biwa is mesotrophic and monomictic, and its maximum depth is 104 m. A single large sediment core (12 cm in diameter and 50 cm in length) was collected with a core-sampler (Type MT-2, Rigosha, Tokyo, Japan) after washing the core-sampler thoroughly with lake water. Triplicate cores were then retrieved from the core-sampler with three thoroughly washed tubes (4.5 cm in diameter and 32.5 cm in length) and capped with butyl rubber stoppers. The cores were transferred to the laboratory in an ice-cooled box and sectioned at 0–2 cm and 3 cm intervals below 2 cm until the 20 cm depth. A detailed description of the sampling site, sampling procedure, sample characteristics, and physicochemical properties of the sediment has been previously described [6,7]. The methane production rates (MPR) and sulfate reduction rates (SRR) were determined in triplicate at 8 °C as described previously [18,19].
2.2 DNA and RNA isolations from the sediment
Sediment samples were washed three times with 120 mM sodium phosphate buffer, pH 8.0 to remove any extracellular nucleic acid [20]. One gram of sediment samples was then aliquoted (0.5 g each) into two screw-cap tubes containing 0.5 g of prebaked (200 °C, 2 h) glass beads (diameter 0.1 mm: 0.05 mm=1:1, w/w). Sub-samples were lysed in 0.9 ml of lysis buffer (50 mM Tris-HCl, 0.1 mM EDTA, 25% sucrose, and 10 mM sodium pyrophosphate, pH 8.0) and stored at −80 °C until nucleic acid extraction.
After thawing and centrifugation of sub-samples, the supernatants were removed. Then, the following solutions were added to each tube: 0.6 ml of 120 mM sodium phosphate, pH 8.0, 0.6 ml of phenol–chloroform–isoamyl alcohol (25:24:1, pH 8.0), and 50 μl of 20% sodium dodecyl sulfate (SDS). The sediment pellets were mechanically disrupted by bead beating (Mikrodismembrator U; B. Braun Biotech International, Melsungen, Germany) for 1 min at 2000 rpm. Nucleic acid isolation and purification were carried out using the hydroxyapatite (HTP) (Bio-Gel HTP Gel, Bio-Rad Laboratories Ltd., Hercules, CA) spin-column method [21]. Salts and humic contaminants were removed from the nucleic acid elution using a 2.5 ml Sephadex G-75 spin-column [22]. After isopropanol precipitation, the nucleic acid pellets were resuspended in 50 μl of nuclease-free water and aliquoted into two tubes (10 μl aliquot for DNA and 40 μl aliquot for RNA isolations). Total RNA was prepared by enzymatic digestion of DNA after total nucleic acids extraction. RNA was resuspended in 20 μl of nuclease-free water after phenol-chloroform-isoamyl alcohol extraction and ethanol precipitation. The concentrations of nucleic acids were measured using a spectrophotometer (GeneSpec III, Hitachi, Tokyo, Japan).
2.3 PCR, RT-PCR amplification and DGGE analysis
Genomic DNA template concentrations were adjusted to approximately 10 ng for each layer sample. Single strand DNA (ssDNA) was prepared from 1 μg isolated RNA using a commercial reverse transcription kit (SuperScriptTM first-strand synthesis system for RT-PCR, Invitrogen Life Technologies, Carlsbad, CA) according to manufacturer's protocol. Random hexamers were used to generate ssDNA.
The complement of probe ARC344, and ARC915 [23] were used as forward and reverse primers, respectively. GC-clamp [24] was attached to 5′-end of the forward primer. The reaction mixture contained 10 ng of genomic DNA (1 μl of ssDNA solution) as a template, 5 μl of 10× Ex TaqTMBuffer, 500 μM of each dNTP, 0.5 μM of each primer, and 2.5 U of TaKaRa Ex TaqTM (Takara, Shiga, Japan) in a final volume of 50 μl. PCR was performed in a thermal cycler (Thermo Hybaid, Middlesex, UK) using the following program; initial denaturation for 1 min at 94 °C; 30 cycles of denaturation (2 min at 94 °C), annealing (1.5 min at 56 °C), and extension (2 min at 72 °C); and the final extension for 10 min at 72 °C.
PCR-amplified 16S rDNA fragments were separated using DGGE as described by Muyzer et al. [24] using D-gene or D-code system (Bio-Rad Laboratories, Hercules, CA). The denaturing agent gradient ranged from 20 to 45% (100% denaturant was defined as 7 M urea and 40% deionized formamide). PCR products were electrophoretically separated for 4 h at a constant voltage of 200 V and temperature of 60 °C. After electrophoresis, the gels were incubated for 10 min in Milli-Q water containing ethidium bromide (1.0 mgl−1), rinsed for 10 min in Milli-Q water, and photographed with UV (312 nm) transillumination system equipped with a CCD camera (ATTO printgraph, ATTO, Tokyo, Japan). DGGE band profiles were used for sequencing of electrophoretic bands and calculation of the diversity index.
2.4 Calculation of Shannon–Weaver index (H′) and phylogenetic analysis of excised bands
Bands excised from both DNA- and RNA-based denaturing gels were re-amplified with the following PCR program: initial denaturation for 1 min at 94 °C and 17 cycles of denaturation (1 min at 94 °C), annealing (1 min at 55 °C), and extension (1.5 min at 72 °C). Some bands failed re-amplification from initial DGGE gel. DGGE analysis from the same genomic and the reversely transcribed DNA templates was repeated three times in order to re-amplify those bands. Reproducibility of DGGE profiles was confirmed by performing three independent DGGE gels. Re-amplification of faint bands could be achieved by increasing the number of PCR cycles. Individual re-amplified bands were verified by comparing the relative migration on the gels. PCR products were purified using a QIAquickTM PCR purification kit (Qiagen, Hiden, Germany) and sequenced with the dye terminate cycle sequencing using ARC915 and the complement of A533b [8] as internal primer since the complement of probe ARC344 did not work well as a sequencing primer. Thus, sequence regions from 344 to 533 were determined by sequencing of a single strand. Phylogenetic tree was constructed based on a maximum parsimony analysis of the dataset in the ARB program package [25]. Partial sequences (>400 bp) of the DGGE bands were added to an alignment of about 700 homologous archaeal 16S rRNA genes by using the aligning tool of the program.
2.5 Nucleotide sequence accession numbers
The partial rRNA gene sequences have been deposited in the GenBank, EMBI, and DDBJ nucleotide sequence databases under Accession Nos. AB154425 to AB154431.
3 Results and discussion
3.1 Vertical profiles of methane production and sulfate reduction rates and their relative contributions for terminal mineralization
Vertical profiles of methane production rate and sulfate reduction rate are shown in Fig. 1A. Methane production rate was very low at 0–2 cm and peaked at 8–11 cm with values as high as 33.6 nmol ml−1 sediment d−1. In contrast, sulfate reduction rate was highest (28.2 nmol ml−1 sediment d−1) at 0–2 cm and then decreased with depth. Sulfate reduction rate was nearly stable at a level of about 9.5 nmolml−1 sediment d−1 below 5–8 cm. According to Aller's equation [26], the rates of CO2 production by means of methane production and sulfate reduction are estimated as equivalent to methane production rate and twice sulfate reduction rate. Relative contribution of CO2 production by each process was calculated assuming that the sum of methane production and sulfate reduction accounted for 100% of CO2 production in the sediment [18] (Fig. 1B). The relative contribution by methane production was 2.9% at 0–2 cm depth and then increased up to 63.7% at 8–11 cm depth.
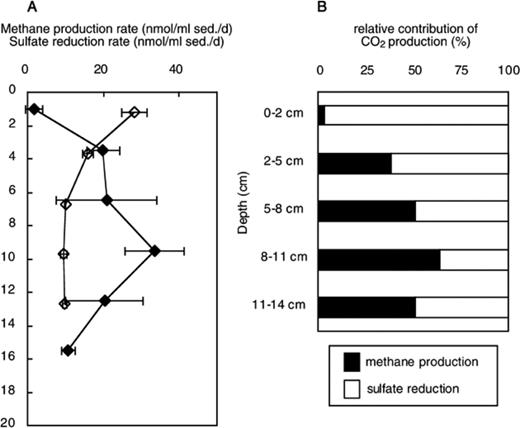
Vertical profiles of methane production rate (closed diamond) and sulfate reduction rate (open diamond) (A), and relative proportion of CO2 production by methane production and sulfate reduction in the profundal sediment of Lake Biwa. Methane production rates and sulfate reduction rates were derived from three measurements. The bars represent standard deviation.
Vertical separation of these two processes was observed already in a previous investigation [6] and in studies on other freshwater lake sediments [18,27]. Takii et al. [18] demonstrated that methane production and sulfate reduction were largely restricted by temperature and supply of sulfate, respectively, in a constantly low-temperature freshwater sediment. The effects of addition of substrates, sulfate, and molybdate on methane production rate in Lake Biwa sediment sample obtained on 6 July 1999 were previously investigated [Takii, unpublished data]. Addition of acetate or H2 to sediment of the 2–8 cm layer did not affect methane production rate, suggesting a sufficient supply of substrates for MPA under in situ temperature (8 °C). However, addition of sulfate inhibited methane production rate by 80% while addition of molybdate did not affect methane production rate. Therefore, sulfate reduction rate was limited by sulfate concentrations, and MPA could be outcompeted, owing to prior availability of the substrate, by sulfate reducing bacteria if there was a sufficient supply of sulfate. Since sulfate was supplied only from overlying water, the distributions of both activities were vertically separated.
3.2 Phylogenetic affiliations of separated archaeal 16S rDNA fragments from DGGE analysis
Seven sequences were successfully determined out of 14 bands indicated by open circles (LB1A to LB7A) on both DNA- and RNA-based gels (Fig. 2). The identity of DNA- and RNA-based DGGE bands was checked by comparing their sequences (>99.8%). Eletrophoretic bands with similar migration to each sequenced band were considered to have the same sequence. Archaeal PCR amplification of the DNA sample in the 0–2 cm layer failed due to the small archaeal populations [6]. A previous study demonstrated that archaeal 16S rRNA accounted for approximately 1.0% of total 16S rRNA (combined signals of general bacterial, archaeal, and eukaryal probes) [6]. The full-length sequences (positions 344–915 in Escherichia coli) of bands indicated by closed circles (NSB1 to NSB3) could not be determined, presumably due to chimera formation or co-migration of DGGE fragments [28,29], although they could be re-amplified. Phylogenetic analysis revealed that all archaeal sequences were closely related to the sequences retrieved from freshwater environments (Fig. 3). Six out of seven sequenced DGGE bands were affiliated with Euryarchaeota and the remaining sequenced band was affiliated with Crenarchaeota (Fig. 3).
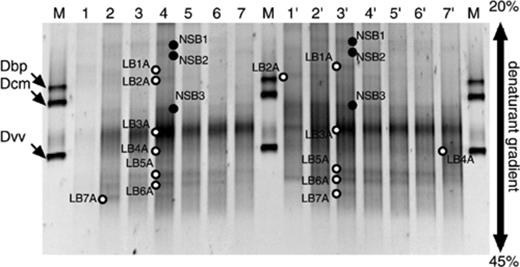
DGGE analysis of archaeal community in profundal sediment from Lake Biwa. Profiles of the PCR-amplified 16S rDNA (lanes 1–7) and profiles of the reversely transcribed 16S rRNA (lanes 1′ to 7′). Lanes 1 and 1′, 0–2 cm; 2 and 2′, 2–5 cm, 3 and 3′, 5–8 cm; 4 and 4′, 8–11 cm; 5 and 5′, 11–14 cm; 6 and 6′, 14–17 cm; 7 and 7′, 17–20 cm; M, amplified 16S rDNA derived from Desulfobulbus propionicus (Dbp), Desulfococcus multivorans (Dcm), and Desulfovibrio vulgaris (Dvv) were used as markers. The DGGE bands (LB1A–LB7A) indicated by open circles were excised and sequenced, and those partial sequences were used for phylogenetic analysis, whereas bands (NSB1–NSB3) indicated by closed circles could not be sequenced.
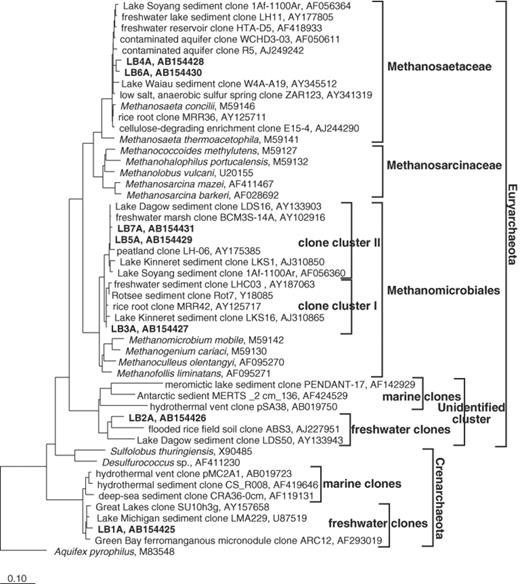
Affiliation of sequenced DGGE bands. The tree is based on a maximum parsimony analysis of the dataset in the ARB program package. Partial sequences of the DGGE bands were added to an alignment of about 700 homologous archaeal 16S rDNA using the alignment tool of the program. The scale bar represents 10% estimated divergence. Identification of DGGE bands was shown in Fig. 2.
The sequence of the most prominent band, LB3A, observed in both DNA- and RNA-based DGGE analyses was affiliated with the order Methanomicrobiales but clustered into an uncultured archaeal cluster (clone cluster I). Two sequences LB5A and LB7A were also affiliated with another uncultured archaeal cluster (clone cluster II) within the order Methanomicrobiales. These suggest that the populations of matching bands LB3A, LB5A, and LB7A were probably hydrogenotrophic methanogens since their sequences obviously clustered into the order Methanomicrobiales. However, we can not rule out the possibility that they are not methanogens until archaeal strains affiliated with these uncultured clusters are isolated and their physiological properties are characterized. The sequences LB4A and LB6A were affiliated with the family Methanosaetaceae, which were obligate acetate-utilizing methanogens. The result that the dominant methanogens in the profundal sediment from Lake Biwa belong to the order Methanomicrobiales and to the family Methanosaetaceae is consistent with the studies on other freshwater sediments such as Rotsee (Switzerland) [3], Lake Soyang (South Korea) [11], and rice paddy soil [8]. In addition, in Lake Michigan the dominant methanogens belong to the order Methanomicrobiales and the family Methanococcaceae, whereas the order Methanosarcinales was almost negligible [5].
LB2A sequence was affiliated with a distinct cluster consisting of only environmental sequences within Euryarchaeota. Hence, it was unclear whether the population corresponding to LB2A sequence was from a methanogen. LB1A sequence was closely related to crenarchaeotal sequences obtained from low-temperature freshwater environments [16,17]. Recently, evidence on the presence of new Euryarchaeota unrelated to methanogens [10,12] and new Crenarchaeota [15–17] in freshwater sediments has been reported. These organisms, however, have not yet been isolated. Thus, the ecological importance of such kinds of Archaea might be underestimated. Furthermore, the primer pair used in this study contains a few mismatches among freshwater clone clusters within Crenarchaeota (2 mismatches to ARC344) and unidentified cluster containing LB2A within Euryarchaeota (1–2 mismatches to ARC344 and 1 mismatch to ARC915). In consequence, the abundance of archaeal populations corresponding to LB1A and LB2A might be underestimated in this study. Quantitative analysis such as membrane and fluorescence in situ hybridization using probes targeting these populations is needed to accurately determine the abundance of these populations.
3.3 Depth-related changes in archaeal community in freshwater lake sediment
Slight depth-related changes in archaeal community were observed in both DNA- and RNA-based DGGE analyses (Fig. 2). Vertical changes in archaeal community were mainly characterized by a decrease of the signal intensity of specific bands. For example, electrophoretic bands LB1A (Crenarchaeota), LB2A (uncultured Euryarchaeota cluster), LB7A (Methanomicrobiales), and some non-sequenced bands (NSB1 and NSB2) became faint below 14–17 cm depth. However, most DGGE bands, of which sequences were related to methanogens, were recognized throughout 0–20 cm depth. The exception was band LB7A. The fact that methanogen community hardly changed with depth in profundal Lake Biwa sediment was consistent with that in the peat bog demonstrated in other studies [30,31]. Galand et al. [14], in contrast, reported that a difference in the DGGE band pattern of functional gene (methyl-coenzyme M reductase) amplifications could be observed between the upper layers (−10 and −20 cm) and the deeper layers (−30 and −40 cm) in a Finnish oligotrophic fen. Thus, archaeal community structure did not change within the range of 0 to 20 cm depth. However, it is unclear whether the DGGE band patterns of the archaeal community in much deeper layers are different from those in 0–20 cm layers in the profundal freshwater sediment from Lake Biwa.
The difference between DNA- and RNA-based DGGE profiles of whole archaeal community was almost negligible (Fig. 2), indicating that most archaeal populations in the sediment equally possessed rRNA. This was remarkably different from the bacterial community in the same sediment samples [7]. In the bacterial community, the number of DGGE bands, which were detected in DNA-based analysis but not in RNA-based analysis, increased with depth. This might mean that bacteria, which possess little or no rRNA, accumulate with increasing depth due to limited substrates and electron acceptors. In general, metabolically active cells contain a higher level of intracellular 16S rRNA than quiescent cells [32,33]. However, the relationship between rRNA content and growth rate has been investigated only among the domain Bacteria [34,35] but not among the domain Archaea. Furthermore, there are examples to which this global relationship can not be applied. For example, some ammonia-oxidizing bacteria of the beta subdivision of the Proteobacteria [36], Desulfobacter latus[37], and Vibrio sp. [38] have been reported to maintain high cellular rRNA contents even under starved or inhibitory conditions. Hence, we need to investigate whether this global relationship between rRNA content and growth rate is applicable to archaeal strains. However, the lack of non-cultured mesophilic crenarchaeota and non-methanogenic euryarchaeota cultures constrains interpretation of differences between DNA- and RNA-based DGGE profiles. Therefore, efforts to isolate those kinds of archaea will be needed.
The Shannon–Weaver diversity index (H′) was calculated from the DGGE pattern (the number and relative signal intensity of bands in the individual lanes) and is shown in Fig. 4. The H′ from DNA- and RNA-based DGGE profile ranged from 0.43 to 0.80 and from 0.50 to 0.88, respectively. These values were lower than those for bacterial diversity (1.20–1.26 from DNA-based analysis, 0.95–1.15 from RNA-based analysis) in the same samples [7]. The difference in H′ within the archaeal DGGE profile was larger than within the bacterial DGGE profile although depth-related change in the archaeal DGGE profile was apparently smaller than that in the bacterial DGGE profile. This discrepancy is due to the difference in the number of DGGE bands since the difference in H′ became larger when DGGE bands were fewer. In contrast to bacterial community, the H′ from RNA-based analysis was slightly higher than that from DNA-based analysis and their vertical changes were similar (Fig. 4). The presence of band LB4A, which is affiliated with Methanosaetaceae, in RNA-based DGGE profiles largely contributed to the higher H′ based on RNA than that based on DNA. RNA-based analysis provides greater sensitivity due to the higher copy number of 16S rRNA (104–105 copies in rapidly growing bacteria) [34] than that of rrn operon (1–14 copies) [39]. In particular, the abundance of filamentous microorganisms might be underestimated in DNA-based analysis since the proportion of DNA from filamentous cells to DNA from most common microorganisms is small in total DNA extracted from natural samples, due to lower DNA content per cell-volume [40]. For example, Falz et al. [3] reported that seven out of 17 sequenced clones (ca. 40%) from a DNA-based archaeal clone library,derived from the sediment of Rotsee,were related to Methanosaeta sp. These populations were identi fied by RNA-based fluorescent in situ hybridization to be equal to 32–150% of the total archaeal cells hybridized with probe Arch915 [3]. Thus, an RNA-based approach can be effective for detecting large cell-volume microorganisms such as filamentous microorganisms.
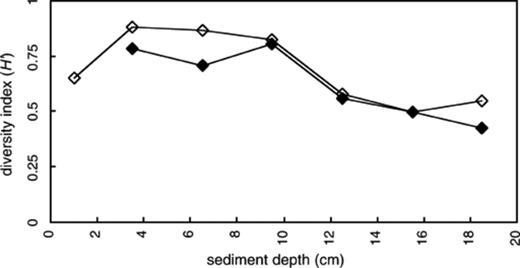
Vertical changes of Shannon–Weaver index of diversity (H′) based on the number and relative intensities of the bands identified by DGGE analysis of PCR-amplified 16S rDNA (closed diamond) and reversely transcribed 16S rRNA (open diamond).
Acknowledgements
We wish to thank the entire crew of the R/V Hakken-gou, Lake Biwa Research Institute, for their skillful assistance in sampling. We are also indebted to Dr. Takuo Nakajima (Lake Biwa Institute, Shiga) and Mr. Hisaya Kojima (Tokyo Metropolitan Univ.) for valuable discussion and their sampling assistance. This work was supported by grants from Showa Shell Sekiyu Foundation for Promotion of Environmental Research (No. A34) to Y.K. and from the Ministry of Education, Culture, Sport, Science, and Technology, Japan (No. 12440219) to M.F.
References
