


Abstract
In this study, we describe a competitive polymerase chain reaction (PCR) for the quantification of the sequences of dsrAB in sulfate-reducing microorganisms. We used the dsr1F/dsr4R set of primers, previously designed by Wagner et al. (1998), and a competitor sequence was constructed from the dsrAB genes of Desulfovibrio vulgaris. The detection limit of competitive PCR corresponded to 45 copies of the dsrAB genes per ng of extracted DNA, and most of the dsrAB sequences amplified and cloned from DNA extracted from Seine estuary sediments were amplified with a similar efficiency. Competitive PCR was then used to assess the abundance of dsrAB genes in the total DNA extracted from the sediment of the Seine estuary mudflats. We observed that the abundance of dsrAB coincided with the variation in the sulfate reduction rate with the depth of the sample, confirming the importance of ‘dsrAB’ sulfate-reducing microorganisms in sulfidogenesis in anoxic environments. We obtained values ranging from 0.045×10³ to 6.63×10³ copies of dsrAB per ng of extracted DNA, and values of the sulfate reduction rate ranging from 35 to 158 nmol cm−3 day−1. These results are similar to those obtained in other studies using molecular biology techniques.
1 Introduction
Sulfate-reducing microbial communities include genera from the Bacteria and Archaea domains. They can use sulfate as the final electron acceptor during anaerobic growth [1–3]. In natural environments, these microorganisms are important for sulfur and carbon cycles, being responsible for more than 50% of the mineralization of organic matter in marine sediments [3,4]. The sulfides (S2−) that are produced during the reduction of sulfur oxides, mostly sulfate in the marine environment, react with metal ions to form metal sulfides, which are insoluble and therefore less toxic [5]. Consequently, understanding the dynamics and ecology of this microbial community is particularly important in anoxic sediment contaminated by heavy metals.
Several studies have used culturing methods and molecular techniques to investigate the diversity of microbial sulfate reducers but the quantification methods for these microorganisms are still considered unsatisfactory [6]. Early studies were based on the culturability of the microorganisms in selective medium as determined by most probable number (MPN) counting [7–10]. More recent studies have used molecular biology techniques to overcome the problem of non-culturability of microorganisms isolated from the environment [11]. Molecular quantification methods are based on the hybridization of probes to specific genes such as the 16S rRNA gene. These methods include (1) quantitative slot- or dot-blot hybridization in which RNA is extracted and hybridized to nucleic acid probes, which allows the determination of the number of gene copies in a sample and (2) fluorescent in situ hybridization (FISH), which is based on the fixation of whole cells and allows direct enumeration [6,11–15]. In both cases, the autofluorescence of samples is a major problem that can generate quantification artefacts [6,15]. Recently, two quantitative techniques, real-time polymerase chain reaction (PCR) and competitive PCR (cPCR), have been developed based on the amplification of specific microbial sequences [16]. Real-time PCR combines the amplification of a gene sequence with the quantification of the fluorescently labelled amplicons [17–19]. This technique is highly specific because in addition to requiring two consensus sequences for the design of PCR primers, it also requires a specific conserved internal sequence to allow specific hybridization with a labelled internal probe. This technique has already proven useful for medical and environmental samples [18–20], although the autofluorescence can again be a problem [18]. cPCR does not require a conserved internal sequence but is more time-consuming [16]. It is based on the co-amplification of a target sequence and a standard internal sequence, known as a competitor [21,22]. The main advantage of this technique is that the contaminants co-extracted with nucleic acids have similar effects on the amplification of the target and competitor sequences [21,23,24]. cPCR has proven suitable for the quantification of bacterial species and functional microbial groups in water, soils, and estuarine samples [23–29].
The aim of this study was to quantify sulfate-reducing microbial communities in sediments from the Seine estuary, for which few studies have shown a high level of contamination [5,30]. As these microorganisms constitute a heterogeneous group, including members of several phyla and domains, it is not possible to use the 16S rRNA gene as a molecular marker [1,2,31,32]. However, the dsrAB genes, which encode the dissimilatory sulfite reductase, the key enzyme in dissimilatory sulfate reduction in these microorganisms, may be an appropriate marker [31–33]. Primers were designed on the basis of consensus sequences, making it possible to study the diversity of the community carrying these genes [32,33].
In this study, we describe a cPCR method based on the amplification of the dsrAB genes, using the primer pair dsr-1F/dsr-4R proposed by Wagner et al. [32], which allows the quantification of the main sulfate-reducing microorganisms present in anoxic sediments from the Seine estuary.
2 Materials and methods
2.1 Sampling
Sediment cores were collected from the northern intertidal mudflats of the Seine estuary. A piston corer was used to obtain 30-cm-long cores. They were immediately cut into 15 sections of 2 cm thickness. Approximately 25 g of each section (wet weight) was transferred to the laboratory in a sterile polypropylene tube at 4°C. Subsamples (1 g wet weight) of each section were frozen at −20°C until subsequent molecular analysis. For the determination of the sulfate reduction rate, an undisturbed core was conditioned in an N2 atmosphere before transport to the laboratory.
2.2 Nucleic acid extraction
Total DNA was extracted from 0.5-g sediment samples (wet weight) by use of a Bio-101 FastDNA Spin kit in combination with the FastPrep FP120 bead beating system (Bio-101, USA) according to the manufacturer's instructions. Crude total DNA was purified by elution through Elutip-D columns (Schleicher and Schuell, Dassel, Germany). The concentration of the resulting DNA was estimated by UV transillumination of samples spotted on ethidium bromide agarose plates [34].
2.3 PCR amplification
The dsrAB genes were PCR-amplified with the dsr-1F (5′-AC[C/G]CACTGGAAGCACG-3′, positions 421–436) and dsr-4R (5′-GTGTAGCAGTTACCGCA-3′, positions 2347–2363) primers, as previously described by Wagner et al. [32], but with the following modifications: we used 1.25 U of Taq DNA polymerase (Eurogentec), and 0.25 μM of each primer. PCR was carried out in a Perkin Elmer thermocycler (Gene Amp PCR system 6700) as follows: 20 s at 94°C for initial denaturation; 30 cycles of 15 s at 94°C, 20 s at 54°C, 2 min at 72°C; and a final extension for 1 min at 72°C.
2.4 cPCR
2.4.1 Construction of competitor plasmid
pAS44 was constructed by inserting the dsvAB genes (dissimilatory sulfite reductase genes from Desulfovibrio vulgaris) into pUC18 [31]. The competitor plasmid, pKSAII, was constructed as follows: the 512-bp BglII-BstEII fragment was removed from the dsvAB genes borne on pAS44. The ends were filled in with the Klenow fragment of Escherichia coli DNA polymerase I, and the plasmid recircularized.
2.4.2 cPCR of dsrAB genes
The dsrAB genes present in DNA extracted from sediment samples were quantified by cPCR as previously described [21,22]: 150 fg of competitor sequence carried by pKSAII (pdsr-c) was added to serial dilutions (25–250 fg) of the target sequence carried by pAS44 (pdsr). Similarly, 150 fg of competitor DNA was added to 4 ng of DNA extracted from estuary sediments (dsr-s). The PCR products (20 μl) were analyzed by electrophoresis in an agarose gel (1% (w/v), 0.5×TAE). Gels were run at 50 V cm−1, stained with ethidium bromide and viewed under UV light. PCR products were quantified from digitized gel images (Alpha-Imager™ 1220, Alpha Innotech Corporation, USA). A standard curve was constructed by plotting the log intensity of DNA amplified from the serial dilution against the intensity of the competitor DNA amplification log [pdsr/pdsr-c]). The amount of target was then determined from the log intensity ratio of dsr-s/dsr-c DNA.
2.5 Clone library construction and RFLP analysis
PCR products were cloned by homopolymeric tailing [34]. dC residues were added to the PCR products and complementary dG residues were added to pBSIISK digested with EcoRI. The vector was ligated to the PCR products by hydrogen bonding between the complementary dC:dG homopolymers. The analysis of the diversity of the dsrAB sequences from environmental samples was performed by restriction fragment length polymorphism (RFLP) with the endonucleases EcoRI and SacI. The restriction fragments were resolved by electrophoresis in 1.5% (w/v) agarose gel in 0.5×TAE. Clones with identical restriction patterns were grouped into clone families.
2.6 Sulfate reduction rate
Sulfate reduction rates were determined in 1-cm sections in two replicate cores collected at the same site. Carrier-free 35S-SO42− solution (10 ml, ca. 80 kBq) was injected through pre-drilled silicone ports. Undisturbed cores were incubated for 16 h in darkness and at in situ temperature. Each core was then cut into sections, and sediment slices (7 cm3) were fixed in 20 ml of 20% zinc acetate and frozen. Reduced sulfur compounds were extracted as described by Thode-Andersen and Jorgensen [35]. A 2-cm3 subsample was taken for S0 extraction after 24 h shaking in CS2. Acid-volatile sulfide (AVS) and chromium-reducible sulfide (CRS) fractions were obtained using cold 1 N HCl and hot HCl with Cr2+, respectively. The H2S thus distilled was collected in 1 N NaOH traps. The total activity of 35S radiotracer was determined by β-counting of the S0, AVS and CRS fractions. The sulfate reduction rates calculated for each of the three fractions were summed, and are referred to as sulfate reduction rates (SRR), expressed in nmol cm−3 day−1.
3 Results
3.1 Molecular quantification of the dsrAB genes by cPCR
cPCR is based on the co-amplification of a target DNA sequence from the dsrAB genes and an internal control, i.e. a competitor sequence corresponding to a cloned version of a deleted dsvAB sequence from D. vulgaris. The competitor plasmid, pKSAII, was constructed by deleting a 512-bp BglII-BstEII fragment from the dsvAB sequence carried by pAS44 (Fig. 1). The primer pair dsr-1F/dsr-4R amplified a 1942-bp fragment, corresponding to the target DNA sequence, and a 1430-bp fragment, corresponding to the competitor sequence. To validate pKSAII as an internal competitor, we checked that both pKSAII (competitor) and pAS44 (target) sequences were similarly amplified. The amplification kinetics of the two sequences were identical and both reached the plateau phase after the same number of cycles (Fig. 2).
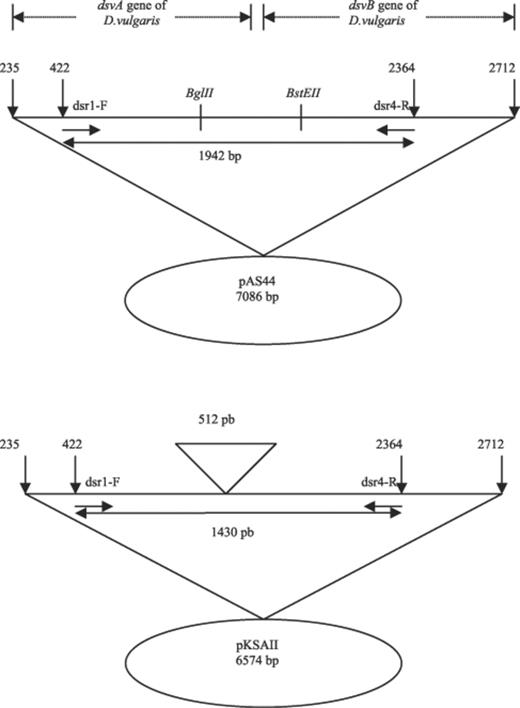
Construction of the competitor plasmid, pKSAII. The competitor plasmid, pKSAII, was constructed by deleting a 512-bp region, comprised between the restriction site of BglII and BstEII, of the dissimilatory (bi)sulfite reductase genes (dsvAB) of D. vulgaris borne on pAS44, as described in Section 2.
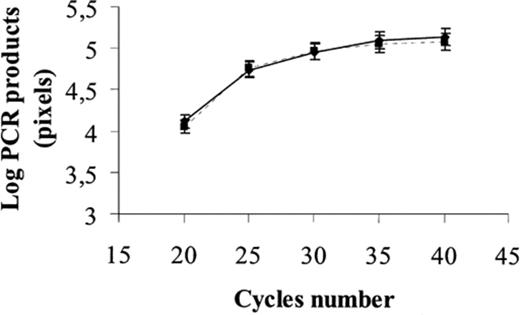
Amplification kinetics of pAS44 and pKSAII sequences. PCR amplification products of 50 pg of both pAS44 (▪) and pKSAII (●) were plotted as a function of the cycle number. The relative amounts of PCR products were determined from the integrated density values (pixels) for the ethidium bromide-stained DNA. Three replicates were performed for each experiment.
The competitor and target DNA fragments co-amplified by cPCR were different in size, making it possible to distinguish between the two amplicons by 1% agarose gel electrophoresis. This also shows that no heteroduplexes were formed in our PCR conditions (Fig. 3A).
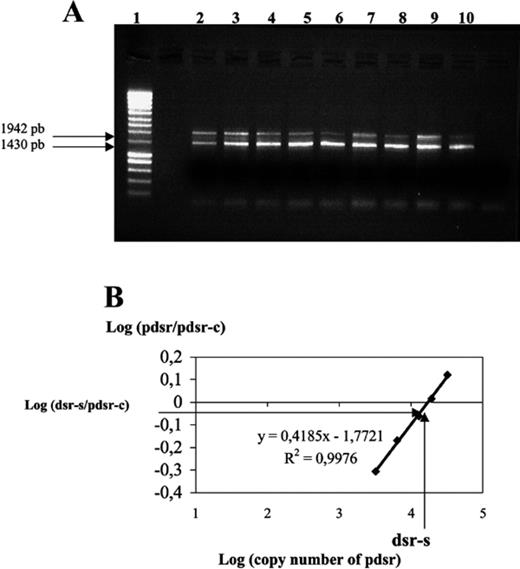
A,B: Molecular quantification of dsrAB genes by cPCR. Molecular quantification of the copy number of the dsrAB genes in microbial DNA extracted from an environmental sample. A: 150 fg of competitor sequence carried by pKSAII (pdsr-c) was added to serial dilutions (25–250 fg) of the target sequence carried by pAS44 (pdsr). Similarly, 150 fg of competitor DNA was added to 4 ng of DNA extracted from estuary sediments (dsr-s). The PCR products were analyzed on agarose gel. DNA masses of pAS44: lanes 2, 250 fg; 3, 150 fg; 4, 100 fg; 5, 50 fg; 6, 25 fg, DNA from sediment samples lanes 7–10. Size ladder (Eurogentec), lane 1. B: The relative intensities of the PCR bands were used to construct the corresponding calibration curve log (pdsr/pdsr-c). The dsr-s/pdsr-c ratio was plotted on the curve and the copy number of dsrAB genes amplified from bacterial DNA extracted from environmental sediment was deduced assuming a mass of 7.81×10⁻¹⁸ g for pAS44, which carries a single copy of the target sequence.
To determine the abundance of dsrAB sequences in total DNA extracted from sediment samples, competitor DNA (pdsr-c) was added to serial dilutions of the target DNA carried by pAS44 (pdsr). At the same time, competitor DNA was added to 4 ng of DNA extracted from estuary sediments (pdsr-s) (Fig. 3A). Then, the standard calibration curve log [pdsr/pdsr-c]=f[pdsr] was constructed and in order to determine the unknown target quantity we plotted the dsr-s/dsr-c ratio on the curve (Fig. 3B). The copy number of dsrAB genes was calculated assuming for pAS44, which contains a single copy of dsrAB gene, a mass of 7.81×10⁻¹⁸ g. Then, the copy number of dsrAB genes in the DNA extracted from environmental samples was expressed per ng of extracted nucleic acid subjected to PCR. To determine the detection limit of the technique, we analyzed serial dilutions containing known copy numbers of dsrAB genes. The detection limit was 45 copies of the dsrAB genes per ng of DNA (data not shown).
There is a few nucleotides sequence diversity in the conserved sequences hybridizing with the dsr1-F/dsr-4R primers, previously designed from the dsrAB genes of D. vulgaris and Archaeoglobus fulgidus. These variations may affect the efficiency of amplification of dsrAB sequences, and consequently the quantification, mostly due to a preferential amplification of dsrAB sequences from D. vulgaris, A. fulgidus, and from the competitor sequence. Thus, it was necessary to determine in which conditions this cPCR, which is well suited to the quantification of the dsrAB genes of D. vulgaris, can be used to quantify the dsrAB genes from other sulfate-reducing microorganisms in our sediment samples. In this way, the dsrAB sequences amplified from the DNA extracted from Seine sediments were cloned, and hybridized with a dsrAB probe (D. vulgaris) to avoid false positive clones. Then, RFLP analysis, based on EcoRI/SacI restriction patterns, classified 41 positive dsrAB clones into 10 clone families (Fig. 4). The amplification efficiency was calculated for one clone from each of these 10 families, with the following mathematical equation for exponential amplification during a PCR: log N=log N0+n log (1+eff), where eff is the amplification efficiency, and n the cycle number. This can therefore be determined by calculating the coefficient α of the slope of the linear regression, which corresponds to the quantity of PCR products according to the number of PCR cycles (18–30 cycles) where [eff]=10α−1.
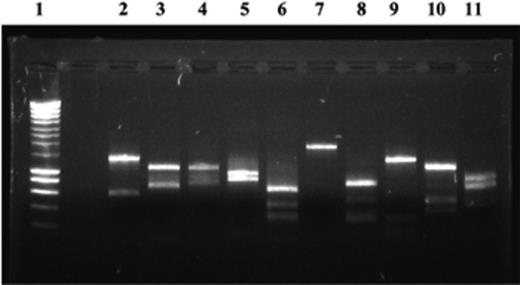
RFLP analysis of dsrAB sequences retrieved from sediment samples. The dsrAB sequences present in the Seine estuary sediments were amplified and cloned. RFLP analysis based on the EcoRI/SacI restriction patterns was performed, and classified the dsrAB sequences into 10 clone families. The gel electrophoresis corresponds to EcoRI/SacI restriction patterns of one clone of each group: lanes 2–11, clone families CF1–10; lane 1, size ladder (Eurogentec).
The amplification efficiencies of the different classes of dsrAB sequences isolated from the Seine samples were compared with those of pAS44, pKSAII, and DNA extracted from a strain of Desulfovibrio desulfuricans (Table 1).
Amplification efficiency of the dsrAB sequences
| Sequence | Number of clones (n=41) | Amplification efficiency (10α−1) | Correlation coefficient (r2) |
| pAS44 | 0.345 | 0.982 | |
| pKSAII | 0.336 | 0.944 | |
| D. desulfuricans | 0.221 | 0.914 | |
| CF1 | 13 | 0.324 | 0.982 |
| CF2 | 10 | 0.241 | 0.969 |
| CF3 | 2 | 0.377 | 0.987 |
| CF4 | 1 | 0.133 | 0.932 |
| CF5 | 1 | 0.341 | 0.989 |
| CF6 | 2 | 0.236 | 0.941 |
| CF7 | 2 | 0.338 | 0.956 |
| CF8 | 3 | 0.235 | 0.936 |
| CF9 | 6 | 0.355 | 0.904 |
| CF10 | 1 | 0.090 | 0.970 |
Amplification efficiencies of the dsrAB sequence from pAS44, pKSAII, D. desulfuricans, and the dsrAB sequences of one clone of each RFLP group were calculated from the slope of the curves of amplification between 18 and 30 cycles (efficiency [eff]=10α−1 where α is the slope of the regression line).
Twenty-four of the 41 clones (classes CF1, CF3, CF5, CF7 and CF9) were amplified with efficiencies varying from 0.324 to 0.377, which is close to the 0.336 of the competitor sequence in pKSAII. Fifteen of the 41 clones (CF2, CF6 and CF8) had efficiencies of approximately 0.24, that is 72% of the efficiency of the competitor (Table 1). Two of the 41 clones, CF4 and CF10, were amplified with efficiencies of 0.133 and 0.09, respectively, that is 40% and 27% of the efficiency of the competitor (Table 1). Finally, the reproducibility of the molecular quantification of the sulfate-reducing microorganisms in anoxic sediments was determined by quantifying the copy number of dsrAB genes in DNA extracted from three subcores collected at the same location in April 2001 (Table 2). The standard deviation was between 5 and 32.5% with a mean standard deviation of 16% along the core depth.
Reproducibility of the cPCR method
| Depth (cm) | Triplicate copy number of dsrAB genes (×103) per ng of extracted DNA | Average (×103) of results from the triplicatesa | ||
| 1 | 1.98 | 2.44 | 2.65 | 2.36±0.28 |
| 3 | 3.59 | 2.65 | 2.97 | 3.06±0.38 |
| 5 | 2.87 | 2.82 | 2.66 | 2.79±0.90 |
| 7 | 2.65 | 1.69 | 1.88 | 1.88±0.42 |
| 9 | 1.76 | 2.11 | 2.42 | 2.10±0.27 |
| 11 | 1.76 | 2.55 | 2.12 | 2.15±0.33 |
| 13 | 1.71 | 1.70 | 1.57 | 1.66±0.07 |
| 15 | 0.90 | 1.20 | 0.84 | 0.98±0.16 |
| 17 | 1.12 | 1.32 | 1.55 | 1.33±0.18 |
| 19 | 0.71 | 0.57 | 0.46 | 0.58±0.10 |
| 21 | 1.26 | 0.83 | 1.07 | 1.05±0.18 |
| 23 | 1.06 | 1.33 | 0.89 | 1.10±0.18 |
| 25 | 1.04 | 1.65 | 1.34 | 1.35±0.25 |
| 27 | 0.63 | 1.29 | 0.91 | 1.01±0.21 |
| 29 | 0.26 | 0.28 | 0.14 | 0.23±0.06 |
Quantification of the copy number of dsrAB genes per ng of total extracted DNA from three cores of sediments sampled at the same location in April 2001. Results correspond to the average of the triplicate samples.
aCorresponds to the standard deviation (n=3).
3.2 Abundance of sulfate-reducing microorganisms (dsrAB) and SRR in sediments from intertidal mudflats
To study the relationship between the sulfate-reducing community ‘dsrAB’ and the sulfate reduction activity in the Seine estuary sediments, we determined both the distribution of the sulfate-reducing microorganisms (dsrAB genes) and the total SRR along the depth of anoxic sediment from estuarine mudflats (Table 3). As the DNA extraction efficiency can vary, mainly due to differences in biogeochemical composition along the core depth, the results are expressed as the copy number of dsrAB genes per ng of total DNA extracted from sediments. Thus, these values are independent of the DNA extraction efficiency and correspond to the relative abundance of microorganisms harboring the dsrAB genes in the total microbial community. The abundance of sulfate-reducing microorganisms (dsrAB genes) in the total microbial community peaked at 6.63±1.06×10³ copies per ng of DNA at 4–6 cm below the water/sediment interface, and decreased with depth to 18–20 cm (Table 3). At this depth, it was possible to amplify the dsrAB genes, but not in sufficient quantities for accurate quantification (45 copies per ng of DNA extracted). Sulfate-reducing microorganisms (dsrAB genes) were thus present all along the core. The highest sulfate reduction rate was 158 nmol cm−3 day−1 of SO42− observed at 4–6 cm below the water/sediment interface. It decreased with depth to a minimum of 35 nmol cm−3 day−1 of SO42− at 18–20 cm below the water/sediment interface. Thus, the distribution of the SRR and sulfate-reducing microorganisms followed a similar pattern.
Abundance of dsrAB genes and SRR in the Seine estuary sediments
| Depth (cm) | SRR (nmol cm−3 day−1) | Copy number of dsrAB genes (×103 ng−1 DNA) | Number of dsrAB cells (×108 cm−3) | Specific SRR (fmol cell−1 day−1) |
| 0–2 | 90 | 4.58±0.74 | 1.61±0.25 | 0.56 |
| 2–4 | 58 | 2.05±0.33 | 0.72±0.12 | 0.81 |
| 4–6 | 158 | 6.63±1.06 | 2.34±0.37 | 0.68 |
| 8–10 | 40 | 5.98±0.96 | 2.11±0.33 | 0.19 |
| 18–20 | 35 | 0.045±0.072 | 0.016±0.002 | 21.8 |
The dsrAB gene abundance and the SRR all along a depth core collected in June 2001, as described in Section 2, and the specific SRR per cell was deduced.
In order to compare our quantitative results with the literature, we estimated the number of cells per cm3, with the caveat that this does not take account of losses during DNA extraction, as discussed above. Then, by taking a mean value of 4.00±0.64×10⁴ ng of DNA extracted per gram of wet sediment (data not shown), and if we consider that each microorganism contains one copy of the gene, we could estimate that the number of dsrAB-positive cells per cm3 was between 2.34×10⁸ and 1.60×10⁶ cells cm−3 (Table 3). The specific rate of sulfate reduction per cell can then be estimated to be between 0.19 and 21.8 fmol cell−1 day−1, and is consistent with those obtained by other molecular methods in similar natural environments (Table 4).
Comparative data of specific SRR in different environments
| Location | Specific SRR (fmol cell−1 day−1) | Method | Reference |
| Pure cultures | 0.2–50 | MPN cell count | [7] |
| Marine sediment (Danish Kattegat) | 3–5 | MPN cell count | [42] |
| Cyanobacterial mats (Sinai, Egypt) | 470 | MPN cell count | [9] |
| Sediments of Kysing Fjord (Denmark) | 10–100 | T-MPN cell count | [10] |
| Hypersaline sediments (Utah, USA) | 5–70 | T-MPN cell count | [8] |
| Marine sediments (Aarhus Bay, Denmark) | 0.01–0.09 | 16S rRNA slot-blot hybridization | [41] |
| Aerobic wastewater biofilms (rotating disk reactors) | 1 | 16S rRNA FISH | [14] |
| Marine Arctic sediments (Svalbard, Arctic Ocean) | 0.14 | 16S rRNA FISH | [12] |
| Temperate intertidal mudflat (German Wadden Sea) | 0.06–0.55 | 16S rRNA FISH | [43] |
| Seine estuary sediments (France) | 0.19–21.8 | ‘dsrAB’ cPCR | This study |
4 Discussion
In an anoxic environment such as estuarine sediment, the microbial reduction of sulfate is the main source of sulfides [2,3]. For several years now, it has been possible to isolate several species of sulfate-reducing microorganisms from natural environments [8–10]. Recently, the difficulties involved in the isolation of these anaerobic microorganisms have been overcome by the use of molecular biology techniques in microbial ecology [6,11]. The aim of this study was to develop a molecular technique to quantify the microbial community that is mainly responsible for the sulfidogenesis in estuarine sediments.
cPCR, like other quantitative methods, has limitations that should be recognized if the data are to be exploited properly. The method is well suited to the analysis of environmental samples since humic acids that are co-extracted with nucleic acids inhibit the amplification of both the target and competitor DNAs to a similar extent. The cPCR described here is based on the use of dsr-1F/dsr-4R primers described by Wagner et al. [32]. Recently, Klein et al. [33] reported a degenerated version of this primer pair that allows for the amplification of a greater range of sulfate-reducing microorganisms and is therefore more appropriate for studying the diversity of the sulfate-reducing community. They also mentioned that the use of the degenerated version of these primers could result in non-specific amplification, and we have therefore preferred to abstain from quantifying some species rather than risk overestimating the numbers of sulfate-reducing microorganisms [33].
Another possible problem is that of sequence variation at the primer sites, which could affect amplification efficiency and introduce quantification bias. In this work, we have shown that most of the dsrAB sequences amplified and cloned from DNA extracted from the Seine estuary sediments are amplified with a similar efficiency, ranging from 72 to 88% of the efficiency of the competitor sequence. Only two clones had substantially lower amplification efficiencies than the competitor sequence; the abundance of these minor sequences will thus be underestimated. However, it has been argued that the quantification step is still reliable if the ratio between amplification efficiencies is constant [16,21]. We would therefore argue that the cPCR method developed here is particularly useful for quantifying levels of the dsrAB gene from sulfate-reducing microorganisms providing amplification efficiencies are similar to those of a competitor sequence.
In the mudflats of the Seine estuary, the abundance of dsrAB genes coincided with the rate of sulfate reduction along the depth of the sample, confirming the importance of dsrAB sulfate-reducing microorganisms in the production of sulfides in anoxic environments [2,3].
The abundance of ‘dsrAB’ microorganisms was highest in the uppermost 15 cm including the transition zone between anoxic and aerobic conditions. In similar environments, such as marine or other estuarine sediments, sulfate-reducing microorganisms are preferentially found in the upper 15 cm and sulfate-reducing activity is also highest in this zone [12,15,36–41].
This work indicates that the specific rate of sulfate reduction per cell in sediments from the Seine estuary is between 0.19 and 21.8 fmol cell−1 day−1. These values are consistent with those previously obtained in similar natural environments with molecular biology methods, although those obtained with marine sediments are somewhat lower [7–10,12,14,41–43]. Generally, the specific rate of sulfate reduction, estimated by the use of molecular quantification, is lower. This difference can be explained by the technical characteristics of these approaches. The small proportion of culturable microorganisms in natural environments could lead to an underestimation of the number of microorganisms and therefore to the overestimation of the specific rate of sulfate reduction by each cell [11]. The ‘dsrAB’ cPCR, like other molecular techniques, seems to be more reliable because it also detects non-culturable microorganisms, although there are limitations due to the yield of DNA extraction, the amplification efficiency and the choice of target gene [11].
The quantification of the dsrAB gene will be correlated with the sulfate reduction rate if ‘dsrAB’ sulfate-reducing microorganisms and sulfite-reducing microorganisms, harboring the dsrAB gene [33], constitute the majority of the sulfidogenic community in the sample. Use of this method is not appropriate for the analysis of samples in which ‘non-dsrAB’ sulfidogenic microorganisms form the major portion of microbial community such as Clostridia, which are often found in environments contaminated with fecal material. Thus, in anoxic marine or estuarine sediments, where an important sulfate-reducing activity is observed, the technique of cPCR reported here allows for the quantification of microorganisms harboring the dsrAB gene that are responsible for the majority of sulfidogenesis in this environment.
Acknowledgements
This work was supported by the Seine-Aval scientific research program, grants from the French government, region Haute Normandie, Agence de l’eau, and industrial partners in the Haute Normandie region (France). We thank Prof. Voordow (University of Calgary) for providing pAS44 and Dr. I. Dupont (CRITT de Cherbourg) for providing the Desulfovibrio desulfuricans strain and Vic Norris for help with the English. J.L. holds a research grant from the region Haute Normandie.
References
