


Abstract
Mycelial biomass estimates in soils are usually obtained by measuring total hyphal length or by measuring the amount of fungal-specific biomarkers such as ergosterol and phospholipid fatty acids (PLFAs). These methods determine the biomass of the fungal community as a whole and do not allow species-specific identification. Molecular methods based on the extraction of total soil DNA and the use of genes as biomarkers enable identification of mycelia directly from the environment. Three molecular techniques were compared to determine the most reliable method for determining the biomass of individual fungal species in soil. The growth of extramatrical mycelium of two ectomycorrhizal (EM) fungal species (Suillus bovinus and Paxillus involutus) in soil was monitored by denaturing gradient gel electrophoresis, a cloning technique and real-time quantitative polymerase chain reaction, and the results were compared with those obtained with hyphal length determination and PLFA analysis. The molecular methods enabled identification and relative quantification of both species separately in an environment with several fungal species present and showed consistent results. Amounts of target DNA per gram soil were used to quantitatively compare soil samples. Increasing amounts of S. bovinus DNA and decreasing amounts of P. involutus DNA were detected over time in an environment containing a more complex community. This work demonstrates that molecular methods provide tools to determine the biomass of individual fungal species in soil.
1 Introduction
Many different ectomycorrhizal (EM) fungal species exist in natural ecosystems and form symbioses with woody perennials and trees. The EM symbiosis is characterised by the presence of colonised root tips and the development of extramatrical mycelia radiating into the soil. EM fungi on root tips can be identified by morphological and molecular methods and for that reason EM root tips are frequently treated as countable units [1] that can conveniently be used to quantify the presence of individual EM fungal species on tree root systems. The ecological importance of specific EM fungi in ecosystems is also often regarded as being proportional to the number of EM root tips. Besides the extent of root tip colonisation, however, variations in exploration and exploitation structure of the extramatrical mycelia largely determine the water and nutrient uptake and the transport and transfer capacities of individual EM fungi. Although the characteristics of the extramatrical mycelium largely establish the functional role of individual EM fungal species [2], identification and quantification of mycelia in soil has been more problematic than the identification and quantification of EM root tips. Only recently have molecular methods enabled identification and quantification of EM extramatrical mycelia in soil [3–7]. Commonly, mycelial biomass estimates in soils are obtained by measuring total hyphal length or by measuring fungal-specific biomarkers such as ergosterol and phospholipid fatty acids (PLFAs) [8–10], but these methods do not distinguish EM fungal species from other fungal species. Inclusion of a non-mycorrhizal control treatment and subtracting the amount of fungal biomass in the control treatment from the fungal biomass in the mycorrhizal treatment is sometimes used to solve this problem [11–13]. This practice can only be applied in artificial systems and, moreover, fungal growth is generally influenced by several factors, including competition with other fungi. The hyphal growth rate of a non-mycorrhizal fungus in a control treatment is therefore not necessarily equal to its growth rate in a treatment with mycorrhizal fungi.
At present, molecular techniques enable the use of genes as biomarkers and facilitate identification of hyphae directly from the environment. Based on the extraction of total soil DNA, molecular techniques such as denaturing gradient gel electrophoresis (DGGE), restriction fragment length polymorphism, competitive polymerase chain reaction (PCR) and cloning–sequencing procedures have been used to identify EM mycelia from soil [3–7]. Nonetheless, identification in itself only reveals the presence of a fungal species in a fungal community. In order to study the species dominance, succession and interaction with other mycelia, the biomass of individual fungal species in soil needs to be measured. For quantification of specific target DNA in environmental samples, real-time quantitative PCR can be used. Very small quantities of DNA can be detected by quantitative PCR, making it an important tool for ecological microbial studies and disease risk assessments [14,15]. Still, a certain quantity of fungal DNA does not necessarily correlate with a certain quantity of fungal biomass. Filamentous fungi differ in cell length, cell volume and amount of DNA per cell and it is therefore not possible to obtain a universal conversion factor to convert DNA quantities to fungal biomass [7]. Yet, as stated by Guidot et al. [7], expressing the results in terms of the amount of DNA per gram soil may be sufficient for a relative comparison of fungal abundance in soil samples. So far, only a few studies have used molecular data obtained from soil DNA extracts in a quantitative way. Mycelia of Hebeloma cylindrosporum have been quantified by competitive PCR in natural soil [7] and clone numbers obtained after a cloning–sequencing procedure have been used to quantify fungal propagule numbers in forest soil [3]. Both applications show that relative quantification of individual fungal species in complex and mixed-species environments is feasible with molecular techniques. Nevertheless, it has not yet been studied how data obtained with these molecular methods relate to data obtained from conventional fungal biomass measures.
In this study, a comparison was made between conventional and molecular methods in order to quantify the presence of EM hyphae in soil. Pinus sylvestris seedlings were inoculated with no, one or two EM fungal species and grown in pots. Fungal presence in the potting soil was determined over time by conventional methods (direct hyphal counts and PLFA analysis) and by three different molecular methods. Samples were analysed by (1) DGGE, (2) screening of a clone library, and (3) application of real-time quantitative PCR. The aim of this study was to compare different hyphal quantification techniques and to test whether molecular methods such as cloning and real-time quantitative PCR can be used to obtain relative measures of hyphal abundance in a mixed-species environment.
2 Materials and methods
2.1 Plant and fungal material
Two EM fungi (Suillus bovinus ‘BL97-14’, fruitbody isolate from Uppsala, Sweden; and Paxillus involutus ‘no. 17’, fruitbody isolate from Sheffield, UK) were grown on MMN medium [16] and sub-cultured twice before transplanting them to autoclaved cellophane (1 min at 120°C) placed on MMN medium, 3 and 5 weeks before inoculation respectively. The two fungi were grown separately on the cellophane as well as jointly on one piece of cellophane. Scots pine seeds (P. sylvestris) were soaked in distilled water for 16 h and surface-sterilised with H2O2 (30%) for 30 min. Sterilised seeds were sown in a mixture of perlite:vermiculite (1:1, v/v), moistened with a modified Ingestad solution (100 N/9 P/54 K/6 Ca/6 Mg/9 S) [17,18] and placed in a climate chamber (16-h photoperiod at 70 W m−2, day/night temperatures of 20/16°C and 80% humidity). Six weeks after sowing, the seedlings were inoculated using a sandwich technique according to the protocol of Colpaert et al. [19]. Seedlings were inoculated with S. bovinus or P. involutus (hereafter named single-species treatment [SS], either ‘Suillus’ or ‘Paxillus’) or with both fungi (hereafter named two-species treatment [TS]). The control group of non-inoculated seedlings was treated the same as the inoculated seedlings. Inoculated and control seedlings were transferred to plant containers (60-ml syringes) filled with acid-washed, sieved perlite, as described by Colpaert et al. [18]. For 1 month, the plant containers were flushed daily with 10 ml modified Ingestad solution. One month after inoculation, inoculated and control seedlings were transplanted to 1-l pots, filled with a mixture of sand:peat:vermiculite (5:4:2, v/v) and watered immediately after transplantation with the modified Ingestad solution (20 ml). Two seedlings were placed about 5 cm apart in each pot. Pots were placed in a climate chamber (16-h photoperiod at 70 W m−2, day/night temperatures of 20/16°C and 80% humidity) and circulated weekly. Pots were watered daily with dH2O and were given 10 ml modified Ingestad solution weekly.
2.2 Harvest
The seedlings were grown for 3 months and every month three pots of each treatment were taken randomly for harvest. Upon harvest, the top 2 cm of the potting mixture was removed and discarded, as it contained algae. Roots were separated from the remaining potting mixture and carefully shaken to remove excess adherent soil. The potting mixture was homogenised by hand and sub-samples of 100 g were frozen immediately (—15°C). These were used for PLFA and DNA extractions.
2.3 Hyphal staining
Hyphae were stained with fluorescent brightener F3397 (Sigma, St. Louis, MO, USA), which binds to β1-3 and 1-4 polysaccharides, i.e. cellulose and chitin. Soil samples were diluted in water (30 g FW soil in 190 ml dH2O) and mixed in a food processor for 1 min, and 9 ml of this solution was fixed by adding 1 ml of formaldehyde (37%). Fixed solutions were shaken and allowed to settle for 2 min. Then, 12 μl was taken out, smeared on a coated microscope slide (one 12-μl drop covering a 200-mm2 hole in the slide coating) and air-dried. Subsequently, a drop (50 μl) of freshly prepared fluorescent brightener F3397 solution (1 mg ml−1) was added and samples were stained in the dark for 2 h. After removing the stain solution the slides were rinsed three times for 20 min with dH2O and finally dried. Stained and dried samples were covered with a drop of immersion oil and a cover slide and stored in the dark at 6°C. Hyphal lengths were estimated by epifluorescence microscopy, using a gridline intersection method over 100 randomly selected microscopy fields [20]. Total hyphal lengths (m g−1 DW soil) were calculated according to the procedures described by Bloem [20] and Paul et al. [21].
2.4 PLFA determination
Extraction and analysis of PLFAs was done according to the method modified from Pennanen et al. [22]. Two gram (FW) of the potting mixture was extracted with chloroform:methanol:citrate buffer mixture (1:2:0.8) and the lipids were separated into neutral lipids, glycolipids and phospholipids on a silicic acid column. From the phospholipid fraction, 3 ml was used to extract PLFAs. The quantity of PLFA 18:2ω6,9 was determined for the dry weight of each sample and used as an indicator of fungal biomass, as it is suggested to be mainly of fungal origin in soils [22].
2.5 DNA extraction and amplification
DNA was extracted from 7 g (fresh weight) of the well-mixed potting mixture using a Bead-Beater, according to the method described by Smalla et al. [23]. DNA was purified twice with the Wizard® DNA Clean-Up System (Promega, Madison, WI, USA) according to the manufacturer's purification protocol before amplification.
For the cloning procedure, DNA amplification of the internal transcribed spacer (ITS) regions was performed on a PCR Express Thermocycler (Thermo Hybaid, Ashford, UK) with the basidiomycete-specific primer pair ITS1F (5′-CTT GGT CAT TTA GAG GAA GTA A-3′) and ITS4B (5′-CAG GAG ACT TGT ACA CGG TCC AG-3′) [24]. The PCR reaction mix consisted of 1 μl 50×diluted template DNA, 38 μl sterile Ultrapure water, 5 μl 10×PCR buffer 2 (Roche, Basel, Switzerland), 200 μM of each deoxynucleoside triphosphate, 200 nM of each primer and 0.5 μl Expand enzyme mix (Roche). The following thermocycling pattern was used: 94°C for 3 min (1 cycle); 94°C for 1 min, 50°C for 1 min and 72°C for 3 min (30 cycles); and 72°C for 10 min (1 cycle).
For the DGGE procedure, ITS sequences were amplified on a PCR Express (Hybaid) with the primers ITS1F and ITS4B-GC. ITS4B-GC is similar to ITS4B and includes a GC clamp on the 5′ end to stabilise the melting behaviour of the DNA fragments. The PCR reaction mix consisted of 1 μl 50×diluted template DNA, 39 μl sterile Ultrapure water, 5 μl 10×PCR buffer 2 (Roche), 200 μM of each deoxynucleoside triphosphate, 200 nM of each primer and 0.5 μl Expand enzyme mix (Roche). The following thermocycling pattern was used: 94°C for 3 min (1 cycle); 94°C for 1 min, 50°C for 1 min and 72°C for 3 min (35 cycles); and 72°C for 10 min (1 cycle).
2.6 DGGE analysis
The presence of successfully amplified PCR products (ITS1F–ITS4B primer pair) was confirmed by analysing 2 μl of PCR product on a 1% (w/v) agarose gel, stained with SYBRGold (Molecular Probes Europe, Leiden, The Netherlands) and visualised using a CCD camera system (Genesnap 4.00.00, ©Synoptics Ltd, 1993–2000, Syngene, Cambridge, UK). Ten microlitres of the obtained PCR products were subsequently analysed by DGGE. Gel electrophoresis was performed on an 8% (w/v) acrylamide gel containing a linear denaturant gradient from 20% to 60% of urea and formamide (100% denaturant contains 7 M urea and 40% (v/v) formamide). Gels were run overnight on a Dcode DGGE system (Bio-Rad, Munich, Germany) at a constant temperature of 60°C, with 80 V for 18 h. After completion of the electrophoresis, gels were stained with SYBRGold and documented on a Syngene CCD camera system.
2.7 Cloning procedure
Successfully amplified PCR products (ITS1F–ITS4B primer pair) of the TS treatment were cloned into the pGem-T vector (Promega). Ligation mixtures were transformed into ultracompetent Escherichia coli XL1-Blue (Stratagene, Cambridge, UK) according to the manufacturer's instructions. The bacteria were plated in three dilutions. From each sample, 20 white colonies were picked with a toothpick, resuspended in the PCR mixture and amplified directly with the ITS1F and ITS4B-GC primer pair. The amplified products were identified by DGGE analysis, using the same DGGE conditions as described in Section 2.6. A S. bovinus–P. involutus marker, consisting of the 0.7-kb ITS regions of both fungi, was used to identify the Suillus or Paxillus band in each sample.
2.8 Development of specific primers and probes
Design of the two Paxillus and Suillus primer and probe sets was based on sequences obtained from DNA extracts of the P. involutus and S. bovinus fungal cultures. A 5.8S primer (5′-TGA ATC ATC GAA TCT TTG AAC G-3′, 22 bp, Tm=60°C, 36% GC) was used for Paxillus as well as Suillus amplification. An ITS2 primer was used to detect Suillus sequences (5′-CCC GAA CAC GAA TAT TCA GG-3′, 20 bp, Tm=60°C, 50% GC) and another ITS2 primer was used to detect Paxillus sequences (5′-CCA TCG CTA ATG CTT TTA AGG-3′, 21 bp, Tm=60°C, 43% GC). Specificity of the primer pairs was tested by amplification of seven EM fungal cultures and 18 EM basidiocarps collected in The Netherlands (Table 1).
The specificity of the two primer sets developed to amplify Suillus and Paxillus sequences was tested against seven EM fungal cultures and 18 sporocarps collected in The Netherlands
| Origin | Primer pair | ||
| Suillus | Paxillus | ||
| Cultures | Hebeloma crustuliniforme | − | − |
| Hebeloma longicaudum | − | − | |
| Laccaria bicolor 1 | − | − | |
| Laccaria bicolor 2 | − | − | |
| Paxillus involutus | − | + | |
| Suillus bovinus 1 | + | − | |
| Suillus bovinus 2 | +/− | − | |
| Suillus variegatus | − | − | |
| Sporocarps | Amanita gemmata | − | − |
| Amanita muscaria | − | − | |
| Amanita rubescens | − | − | |
| Boletus badius | − | − | |
| Cantharellus cibarius | − | − | |
| Cortinarius sp. | − | − | |
| Entoloma cetratum | − | − | |
| Gymnopilus sapineus | − | +/− | |
| Inocybe sp. | − | − | |
| Laccaria bicolor | − | +/− | |
| Laccaria proxima | − | +/− | |
| Lactarius hepaticus | − | − | |
| Paxillus involutus | − | + | |
| Rhizopogon luteolus | − | − | |
| Russula emetica | − | − | |
| Russula ochroleuca | − | − | |
| Russula adusta | − | − | |
| Suillus bovinus | +/− | − | |
No amplification is represented with a minus sign (−), while slight amplification and good amplification are represented by +/− and + respectively.
Hybridisation probes were used for the sequence-specific detection of S. bovinus and P. involutus target DNA with the LightCycler. Two probes were developed for each species. One probe is labelled with the marker dye fluorescein, while the other is labelled with LCRed640. Fluorescence occurs when both probes are bound, in a head-to-tail arrangement, to adjacent sequences on the target DNA. Two probes were developed for the detection of Suillus sequences (5′-GAG CAT GCC TGT TTG AGC GTC AGT AAA-3′, 27 bp, Tm=65.5°C, 48.1% GC; and 5′-LCRed640-CTC AAC TCC TCT CGA TTG ACT TCG-3′, 24 bp, Tm=66.5°C, 51.7% GC) and two other probes were developed for the detection of Paxillus sequences (5′-CAA CCA TCC CTC GAT TCG TTT CGA G-3′, 25 bp, Tm=65.8°C, 52.0% GC; and 5′-LCRed640-GTT TGG CTT GGA TTT TGG GGG C-3′, 22 bp, Tm=67.3°C, 54.5% GC). Specificity of the primers was tested in silico, making use of the GenBank database. For Suillus, the 27-bp probe was genus-specific while the 24-bp probe was species-specific and for Paxillus the 25-bp probe was species-specific while the 22-bp probe was genus-specific.
2.9 Quantitative PCR
DNA extracts from the two SS treatments and from the TS treatment were amplified by quantitative PCR. Quantitative PCR was performed on the LightCycler (Roche), using LightCycler capillaries and LightCycler software version 3.5.3. (Roche, 2001). Reaction solutions of 20 μl were pipetted in each capillary. The Suillus reaction mix contained 2 μl 10×diluted template DNA, 6.5 μl water, 2 μl LightCycler FastStart reaction mix buffer, 3 mM MgCl2, 0.5 μM of each primer, 0.2 μM of probe 1 (fluorescein) and 0.2 μM of probe 2 (LC-Red640). The Paxillus reaction mix contained 2 μl 10×diluted template DNA, 7.8 μl water, 2 μl LightCycler FastStart reaction mix buffer, 3 mM MgCl2, 0.5 μM of each primer, 0.2 μM of probe 1 (fluorescein) and 0.4 μM of probe 2 (LC-Red640). All chemicals originated from the LightCycler-FastStart DNA kit (Master Hybridisation Probes, Roche). The following thermocycling pattern was used for the Suillus PCR: 95°C for 10 min (1 cycle); 95°C for 10 s, 60°C for 15 s and 72°C for 10 s (45 cycles); followed by 1 cycle at 55°C for 15 s. The following thermocycling pattern was used for the Paxillus PCR: 95°C for 10 min (1 cycle); 95°C for 10 s, 60°C for 15 s and 72°C for 10 s (45 cycles); 72°C for 10 min (1 cycle); followed by 1 cycle at 55°C for 15 s. Dilutions of known amounts of ITS plasmid inserts were used as standard curve, assuming that the amplification efficiency of plasmid target DNA was equal to the amplification efficiency of sample target DNA. LightCycler results (μg target DNA in 20 μl PCR mixture) were converted to pmol target DNA g−1 soil (DW). LightCycler product formation was confirmed by melting curve analysis. The melting point of a DNA fragment depends for example on its individual length and its G/C content, and the determination of the individual melting temperature for a DNA fragment can therefore be used to characterise the amplification products. LightCycler product formation was also confirmed by analysing the PCR products on a 1% (w/v) agarose gel, stained with SYBRGold.
2.10 Statistics
Data analysis was performed using SAS programs (SAS 8, ©1999 by SAS Institute) and SPSS (SPSS 8.0, ©1997 by SPSS). All analyses were performed on log-transformed data. A normality test (SPSS, non-parametric test, sample Kolmogoroff–Smirnoff) and a test of homogeneity of variances (SPSS, one-way analysis of variance) showed that the log-transformed data sets were normally distributed and that their variances were spread homogeneously. A correlation analysis (SPSS, Pearson correlation, two-tailed) was performed to check for correlations between PLFA and hyphal data for four treatments. GLM analysis (SAS) was used to test for significant differences between treatments at each sampling time and to test for significant differences for each treatment over time (Tukey's Studentised range test). For each treatment at each month, three replicates (n=3) were used.
3 Results
3.1 PLFA and hyphal length results for all treatments
In all four treatments, over 3 months, the total hyphal lengths (Fig. 1A) showed the same trend as the amounts of PLFA 18:2ω6,9 (Fig. 1B). The Suillus treatment showed a significant increase in hyphal length as well as amounts of PLFAs, while the Paxillus treatment and the TS treatment remained constant over time. The controls showed a significant increase in hyphal lengths as well as PLFAs over time. Correlations between PLFA concentration and the hyphal lengths of the Suillus treatment, the TS treatment and the controls (resp. RS=0.828, RTS=0.937 and RC=0.867) were significant at the 0.01 level (two-tailed). The correlation for the Paxillus treatment (RP=0.283) was not significant.
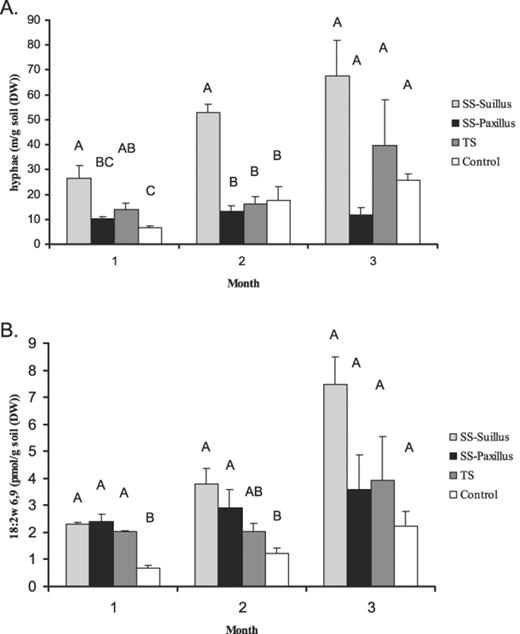
Fungal colonisation of the potting-mixture over 3 months determined by (A) hyphal lengths and (B) PLFA 18:2ω6,9 analysis. SS indicates the single-species treatments and TS indicates the two-species treatment. Error bars indicate ±S.E.M., n=3.Different letters within each month indicate statistically different values (GLM/Tukey's Studentised range).
3.2 LightCycler results for SS treatments
LightCycler PCR product formation was confirmed by melting curve and agarose gel analysis, with the melting curves showing one distinct peak and the agarose gel showing one distinct band of the right size per sample. The standard curves for both the Paxillus and Suillus LightCycler analyses were highly reproducible (for Paxillus R2=0.9936 and 0.0865 and for Suillus R2=0.9999 and 0.9976). In general, the amounts of DNA measured in the Suillus treatment (Fig. 2) were higher than the amounts of DNA in the Paxillus treatment. Both treatments showed no significant changes over time. Standard errors were high for both treatments. No significant correlations between PCR data and PLFAs or hyphal lengths for the SS treatments were found.
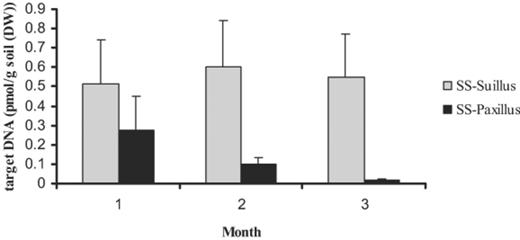
Concentrations of target DNA in the potting mixture over 3 months for the two SS treatments, as determined by LightCycler analysis. Error bars indicate ±S.E.M., n=3.
3.3 DGGE results for TS treatment
DGGE analysis confirmed the presence of Suillus and Paxillus DNA in the TS treatment soil (Fig. 3). Over time, DGGE band intensities varied, since the average band intensity of Paxillus DNA decreased, while the average band intensity of Suillus DNA increased. DGGE analysis also revealed the presence of bands that did not belong to either Paxillus or Suillus, indicating the presence of other fungi in the treatment and control soil (data not shown). No attempt was made to identify these fungi.
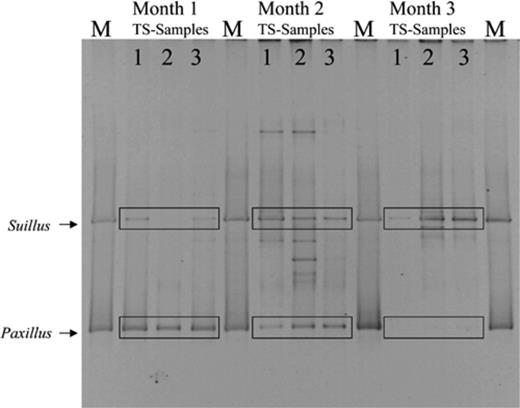
DGGE of amplified ITS rDNA fragments from the TS treatment, representing the fungal community in the potting mixture over 3 months. Marker lanes (M) show the Suillus-Paxillus marker. For each month, TS samples 1, 2 and 3 represent the results of three pots that were destructively harvested. Over time, the average intensity of the Suillus bands increases, while the average intensity of the Paxillus bands decreases.
3.4 Clone counts of TS treatment
Suillus as well as Paxillus clones were detected after amplification, cloning and DGGE analysis of extracted DNA from the TS treatment (Fig. 4A). Fungal clones other than Suillus or Paxillus were also found but these were excluded from the analysis. The majority of clones found in the first month were Paxillus clones (>97%), but their frequency decreased to 0% during the following 2 months. After the second month, the frequency of the Suillus clones increased from 55% to 100% at the end of the experiment.
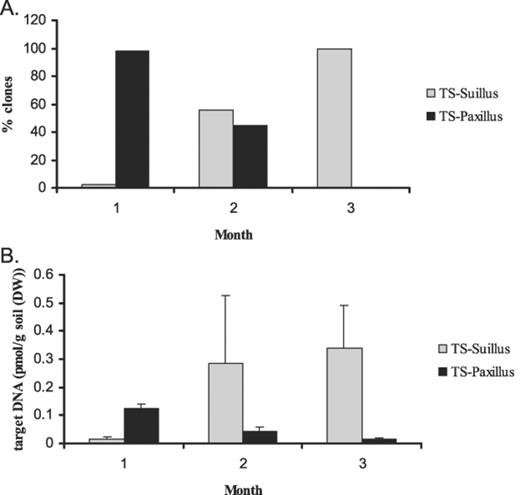
Concentrations of target Suillus and Paxillus DNA in the potting mixture over 3 months for the TS treatment, as determined by (A) clone counts and (B) LightCycler analysis. Error bars indicate ±S.E.M., n=3.
3.5 LightCycler results for TS treatment
DNA of Suillus as well as Paxillus was detected and quantified in the potting mixture of the TS treatment (Fig. 4B). Over time, the amount of Suillus DNA increased from 0.01 to 0.34 pmol g−1 soil DW, while the amount of Paxillus DNA significantly decreased from 0.12 to 0.01 pmol g−1 soil DW. Standard errors were high for both fungi.
4 Discussion
4.1 The use of molecular tools to obtain fungal biomass estimates
This study has shown that molecular methods enable identification and quantification of hyphal material in an artificial mixed-species environment. Analogous to the use of hyphal lengths and PLFAs, DNA soil extracts proved a useful source for fungal biomass estimations. The three molecular methods tested showed consistent results and provided tools to analyse species-specific fungal abundance in soil.
First of all, DGGE fingerprinting provides a powerful tool in microbial ecology to assess the microbial diversity in environmental samples [25]. In this study, DGGE analysis allowed detection of the two inoculated EM fungi and also allowed detection of fungi that had spontaneously invaded the soil. In addition, DGGE band intensities provided an indication of fungal abundance. The average band intensities of Suillus in the TS treatment were found to increase, while the average band intensities of Paxillus were found to decrease. This trend was confirmed with the other two molecular methods. Nonetheless, quantitative use of DGGE implies plateau-phase quantification of PCR products, since band intensities do not further increase after a certain number of PCR cycles [26]. Only with the use of an internal standard can DGGE band intensities accurately quantify the abundance of the corresponding organism in the template DNA mixture [26].
The second molecular method applied was the screening of a clone library. In E. coli, cloning is a method to separate PCR-amplified DNA fragments from a mixture [27]. Cloned DNA fragments can be sequenced to identify them to species level, but this is a costly procedure. In this study, a number of cloned fragments were analysed by DGGE, allowing rapid and relatively cheap identification. Cloning techniques have been applied to identify fungi in different soil fungal communities [5,28], but the influence of cloning systems on quantitative detection of fungi is poorly investigated [27]. Nevertheless, ITS clone numbers have been used to quantitatively compare sites for different functional groups of fungi [3]. In this study, determination of the percentage of clones originating from Suillus or Paxillus showed a trend equal to the DGGE results over time and revealed the presence of other fungi besides Suillus and Paxillus.
The third method used to quantify amounts of DNA was real-time quantitative PCR. Specific DNA quantification is obtained with two fluorogenic probes that hybridise to a region of the target DNA, defined by two PCR primers. To standardise the PCR quantifications in this study, dilutions of cloned Suillus and Paxillus DNA were used assuming that the amplification efficiencies of plasmid target DNA and sample target DNA were equal. Analysis of all samples in duplicate, however, showed that LightCycler soil sample results fluctuated, whereas analysis of the standard plasmid samples did not reveal these fluctuations. The standard samples produced highly reproducible standard curves and variances due to pipetting inaccuracies can therefore be excluded as a source of fluctuating results. In contrast to the purified plasmid DNA extracts, co-extracted components may have contaminated the soil DNA extracts. Co-extracted contaminants can inhibit PCR amplification [27] and even low concentrations may affect the amplification efficiency of the highly sensitive LightCycler. Differences in homogeneity of samples analysed in duplicate, though small, may have differentially affected the LightCycler efficiency. Due to the exponential nature of the PCR, small changes in amplification efficiency will have a large impact on its outcome and therefore may have caused the fluctuations observed in this study. In general, differences in target DNA extraction efficiency and recovery after purification may also have contributed to the fluctuating results. Increasing the number of soil replicates extracted per treatment and testing each DNA extract in triplicate would possibly reduce the observed fluctuations. Still, in correspondence to the DGGE and clone data, quantitative PCR showed increasing amounts of Suillus DNA and decreasing amounts of Paxillus DNA in the TS treatment.
All three molecular methods revealed a similar trend in the TS treatment, with increasing amounts of Suillus DNA and decreasing amounts of Paxillus DNA over time. In contrast, PCR analysis of the SS treatment revealed no significant changes in Suillus and Paxillus DNA amounts over time. This suggests that interaction between the two EM fungi negatively influenced Paxillus growth in the TS treatment.
4.2 Using hyphal lengths and PLFAs to obtain fungal biomass estimates
In this study, three molecular techniques were compared to hyphal length measurements and PLFA analyses. Amounts of PLFA 18:2ω6,9 are generally used as indicators of the presence and abundance of fungi in soils [29]. It is also assumed that each fungal species in a community contributes to the PLFA profile in proportion to its biomass [30]. In this study, the amounts of PLFA 18:2ω6,9 correlated well with the hyphal lengths of three treatments. For the Paxillus SS treatment however, a relatively large amount of PLFA 18:2ω6,9 was found compared to the hyphal length data. Contrary to other reports [10], there were no indications from the hyphal length and PLFA results of the SS treatments that Suillus produces relatively more PLFAs compared to Paxillus. Hyphal lengths and PLFAs in the non-inoculated control treatment showed a gradual increase over time, as the potting mixture became colonised by invading fungi. DGGE banding pattern analysis allowed the detection of fungal species other than S. bovinus and P. involutus, which had indeed spontaneously invaded the potting mixtures of the controls as well as the treatments. The fungi that spontaneously invaded the treatment soils also contributed to the measured hyphal lengths and PLFA profiles of these treatments, but not necessarily to the same extent as indicated by their presence in the control soils. The growth rate of a non-mycorrhizal fungus in a control treatment does not necessarily equal its growth rate in a more-species treatment, where competition for resources occurs. This study indeed showed that the sum of the hyphal lengths and PLFA amounts from Suillus and Paxillus in the two SS treatments did not represent the total amounts of hyphae and PLFAs in the TS treatment. The practice of subtracting the amount of fungal biomass in the control treatment from the total fungal biomass [11–13] in order to estimate mycorrhizal fungal biomass is therefore problematic.
4.3 Concluding remarks
The choice of a (vital) stain determines whether living and/or dead fungal hyphae are quantified, but this distinction is less clear when analysing fungal DNA. The changes in species abundance found with molecular methods cannot directly be translated to changes in fungal biomass. This is illustrated by the fact that even in the SS treatments no significant correlation was found between the DNA data and the hyphal and PLFA data. This could be due to the combined effect of the different limitations of each of the techniques used. In addition, copy numbers of ITS genes on the genome can vary between fungal species. For quantification purposes, it would therefore be most reliable to use a biomarker gene with a known copy number. Copy numbers of the ITS genes and their extraction efficiency were assumed equal for the two fungal species tested in this study, although this likely caused some bias. Nevertheless, PLFAs are used extensively to quantify fungal biomass, despite the fact that their quantity depends on the fungal species considered and its active membrane area [10]. The use of DNA adds the highly required specificity to the hyphal quantification measures and the present uncertainties might not be much different from those of PLFA use. Nevertheless, the specificity of the primers and probes used for real-time PCR analyses needs special attention when attempting to use this technique to identify specific fungi in natural forest soil.
In conclusion, the molecular methods used in this study have enabled identification and (relative) quantification of mycelia of two EM fungi in a mixed-species environment. The results of this study demonstrate the high potential of molecular methods to assess relative changes in fungal biomass over time, thereby providing a species-specific measure to quantify mycelia in soil.
Acknowledgements
We thank Paula Leeflang (RIVM) for her help with the inoculation procedure, Jaap Bloem and An Vos (Alterra) for their help with the hyphal staining procedure and Nico Nagelkerke (RIVM) and Petra van Vliet (WU) for their help with the statistical analyses. Roger Finlay (SLU) is acknowledged for providing the fungal cultures. Financial support to R.L. from the Netherlands Organisation for Scientific Research (NWO) is gratefully acknowledged.
References
